
Abstract
The survival of Salmonella in low moisture foods and processing environments remains a great challenge for the food industry and public health. To explore the mechanisms of Salmonella desiccation resistance, we studied the transcriptomic responses in Salmonella Tennessee (Tennessee), using Salmonella Typhimurium LT2 (LT2), a strain weakly resistant to desiccation, as a reference strain. In response to 2 h of air-drying at 11% equilibrated relative humidity, approximately one-fourth of the open reading frames (ORFs) in the Tennessee genome and one-fifth in LT2 were differentially expressed (>2-fold). Among all differentially expressed functional groups (>5-fold) in both strains, the expression fold change associated with fatty acid metabolism was the highest, and constituted 51% and 35% of the total expression fold change in Tennessee and LT2, respectively. Tennessee showed greater changes in expression of genes associated with stress response and envelope modification than LT2, while showing lesser changes in protein biosynthesis expression. Expression of flagella genes was significantly more inhibited in stationary phase cells of Tennessee than LT2 both before and after desiccation. The accumulation of the osmolyte trehalose was significantly induced by desiccation in Tennessee, but no increase was detectable in LT2, which is consistent with the expression patterns of the entire trehalose biosynthesis and degradation pathways in both strains. Results from this study present a global view of the dynamic desiccation responses in Salmonella, which will guide future research efforts to control Salmonella in low moisture environments.
Introduction
The mechanisms by which Salmonella survives on a dry surface or in low moisture foods remain elusive. The formation of filamentous cells in low water activity aqueous solution, the multicellular morphology (rdar) induced by prolonged growth on agar plates, and changes in outer membrane lippolysaccharides have been reported as the major responses of Salmonella to desiccation (Mattick et al., 2000; Gibson et al., 2006; Garmiri et al., 2008; White et al., 2008). Nonetheless, Salmonella in dry processing environments or extremely low moisture foods would be exposed to harsh desiccation stresses but may lack the growth conditions to undergo the reported phenotypic changes. In this project, we aimed to use microbiological and genomic approaches to better understand the Salmonella global response to desiccation stress from air-drying and to identify intrinsic factors that regulate Salmonella resistance to desiccation exposure.
Materials and Methods
Strains
Salmonella Typhimurium LT2 American Type Culture Collection (ATCC) strain 19585 (LT2) and Tennessee strain K4643 (Tennessee), a clinical isolate from the 2006 peanut butter-associated outbreak of salmonellosis, were grown in Tryptic Soy Broth at 37°C with orbital shaking, and stationary phase cultures (20 h) were used for the entire study.
Desiccation and Enumeration of Salmonella
LiCl was used to obtain an equilibrated relative humidity (ERH) of 11% in a sterile desiccator (Himathongkham et al., 1999). For each strain, approximately 8 log colony forming units (CFU) in 0.1M PBS were added onto a sterile filter paper disc and stored in the desiccator for 2 h to 3 weeks as indicated.
In the desiccation survival study, discs were collected at various time intervals up to 3 weeks and homogenized in 5 mL of 0.1% peptone water in a stomacher, and surviving cells were enumerated by total plate count or MPN assay (FDA, 2012). Three biological replicates and two technical repeats for each were carried out.
Transcriptional microarray study of Salmonella desiccation
The 60- mer oligo probes were designed based on the sequence and annotation for LT2 from GenBank (NC-003197) (McClelland et al., 2001) and the whole genome shot gun sequence for Tennessee (ACBF00000000.1; Genus BioSystem, Inc., Northbrook, IL) (MacCannell, 2008). A total of 17,000 probes, including two probes for each open reading frame from both genomes, were printed in quadruplicate on each slide (4X44K; Agilent Technologies, Inc., Santa Clara, CA).
Cells (∼8 log CFU) for each strain were prepared on the discs as described above and either stored at −80°C directly, as control samples; or kept at 11% ERH at 25°C for 2 h and then transferred into −80°C, as desiccation-treated samples. Total RNA was isolated (Rneasy Mini Kit; Qiagen Inc., Valencia, CA) and confirmed for quality (Agilent 2100 Bioanalyzer; Agilent Technologies, Inc., Santa Clara, CA) following the manufacturers' instructions. MessageAmp II-Bacteria Kit was used to label the normalized total RNA per manufacturer's instructions (Ambion, WI). Totally three slides (three independent experiments) were hybridized with the labeled cRNA of 12 biological samples, washed and scanned (GenUs BioSystems Inc., Northbrook, IL) on an Agilent G2565 Microarray Scanner (Agilent Technologies, Inc.).
Bioinformatics analysis
The raw data signals of all probes were analyzed using Agilent Feature Extraction and Gene Spring GX v7.3.1 software packages. All signals were normalized to the 75th percentile of each array. The p-value and false discovery rate (FDR) were calculated using Paired Two Conditions with Bayesian Analysis via the Cyber-T software web server (
Gene expression validation with reverse transcription–real time PCR
Ten genes differentially expressed in the microarray data were selected for qPCR validation. Total RNA from three independent experiments was isolated with the UltraClean Microbial RNA Isolation kit (MoBio Inc., Carlsbad, CA), and reverse transcription–polymerase chain reaction (RT-PCR) amplification was carried out using Quantifast SYBR Green RT-PCR kit per the manufacturer's instruction. Primers are listed in Table 1.
Trehalose assay
The cell pellet (∼10 logs CFU) of each culture was stored in the desiccation chamber (11% ERH) for 0, 2, 24, and 120 h, respectively. The trehalose production was measured by the addition of trehalase, and followed by GO glucose assay (Sigma Aldrich Inc., St. Louis, MO) (Joseph et al., 2010). The desiccation-induced trehalose production for each sample was determined by the increased percentage of glucose units in comparison to the non-desiccated control. All experiments were repeated four times in triplicate readings each time. DDXL Boxplot and one-way analysis of variance (ANOVA) were used for the significance tests.
Results
Strain selection and characterization of their desiccation survival
Tennessee was selected as the target strain for its association with the 2006 peanut butter outbreak. LT2 was selected as a control strain because of its mutated rpoS, which results in an insufficient stress response and attenuated virulence (Wilmes-Riesenberg et al., 1997). The desiccation study showed a drastic difference in cell viability between the two strains, with Tennessee demonstrating stronger resistance to desiccation stress than LT2 as evidenced by its greater survival (Fig. 1). In the following array study, Tennessee and LT2 represented Salmonella strains having strong and weak desiccation resistance, respectively.
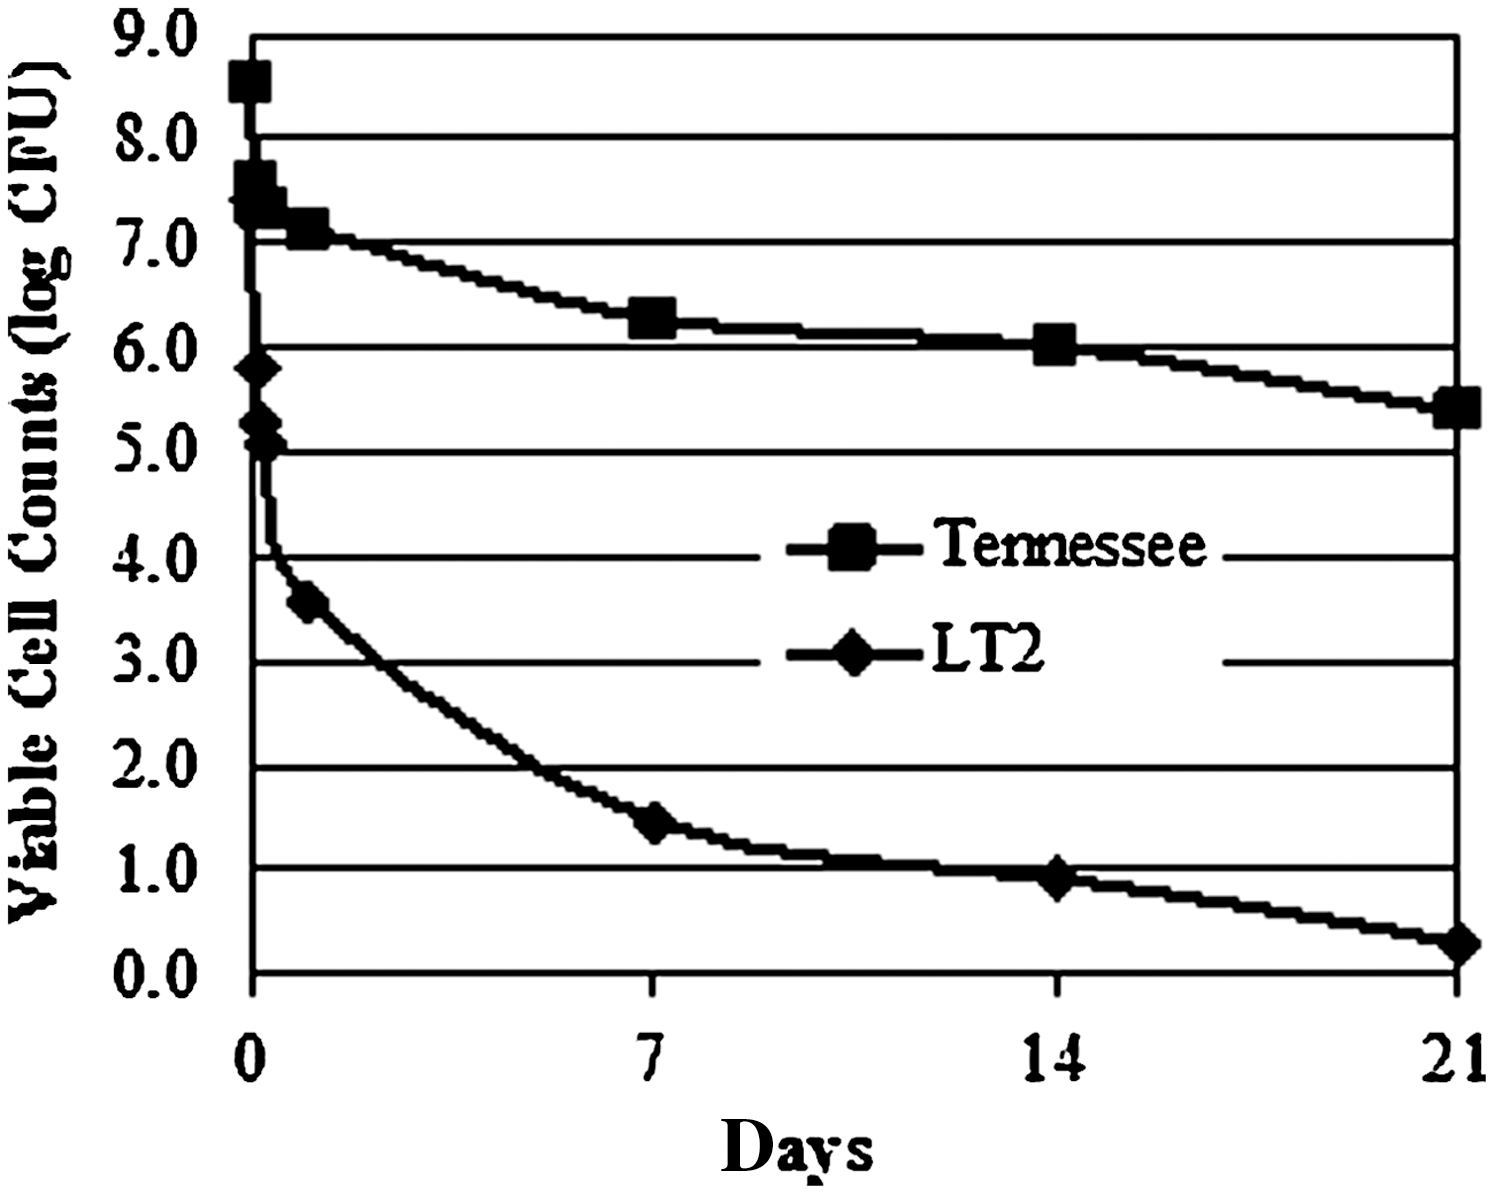
Viability of Salmonella Tennessee and Salmonella Typhimurium LT2 during storage in 11% equilibrated relative humidity (ERH). Cell viability was determined by plate counts; except for the estimations of viable LT2 after the second and third week of storage, which were performed by the most probable number (MPN) method and marked with an asterisk.
Overview of the desiccation-induced global transcriptional profile change in Salmonella
The array data showed that differential expression of genes in both Tennessee and LT2 was profoundly triggered by desiccation (Fig. 2). When a cutoff of 2-fold was used, approximately 1/4 of the open reading frames (ORFs; ∼1200 out of 4775) in Tennessee and 1/5 of the ORFs (∼810 out of 4330) in LT2 were differentially expressed in response to desiccation stress.

Box Whisker Plot of global gene expression in Salmonella Typhimurium LT2 and Salmonella Tennessee with and without desiccation treatment. The 75th percentile (top edge of the box), 25th percentile (bottom edge of the box), and median (line inside the box) provides an overview of data distribution. The outliers (short lines) represent transcripts hybridized at a greater signal intensity beyond 1.42 interquartile range (IQR).
A cutoff of fivefold was used for further functional group analysis based on the KEGG pathway database from JCVI (
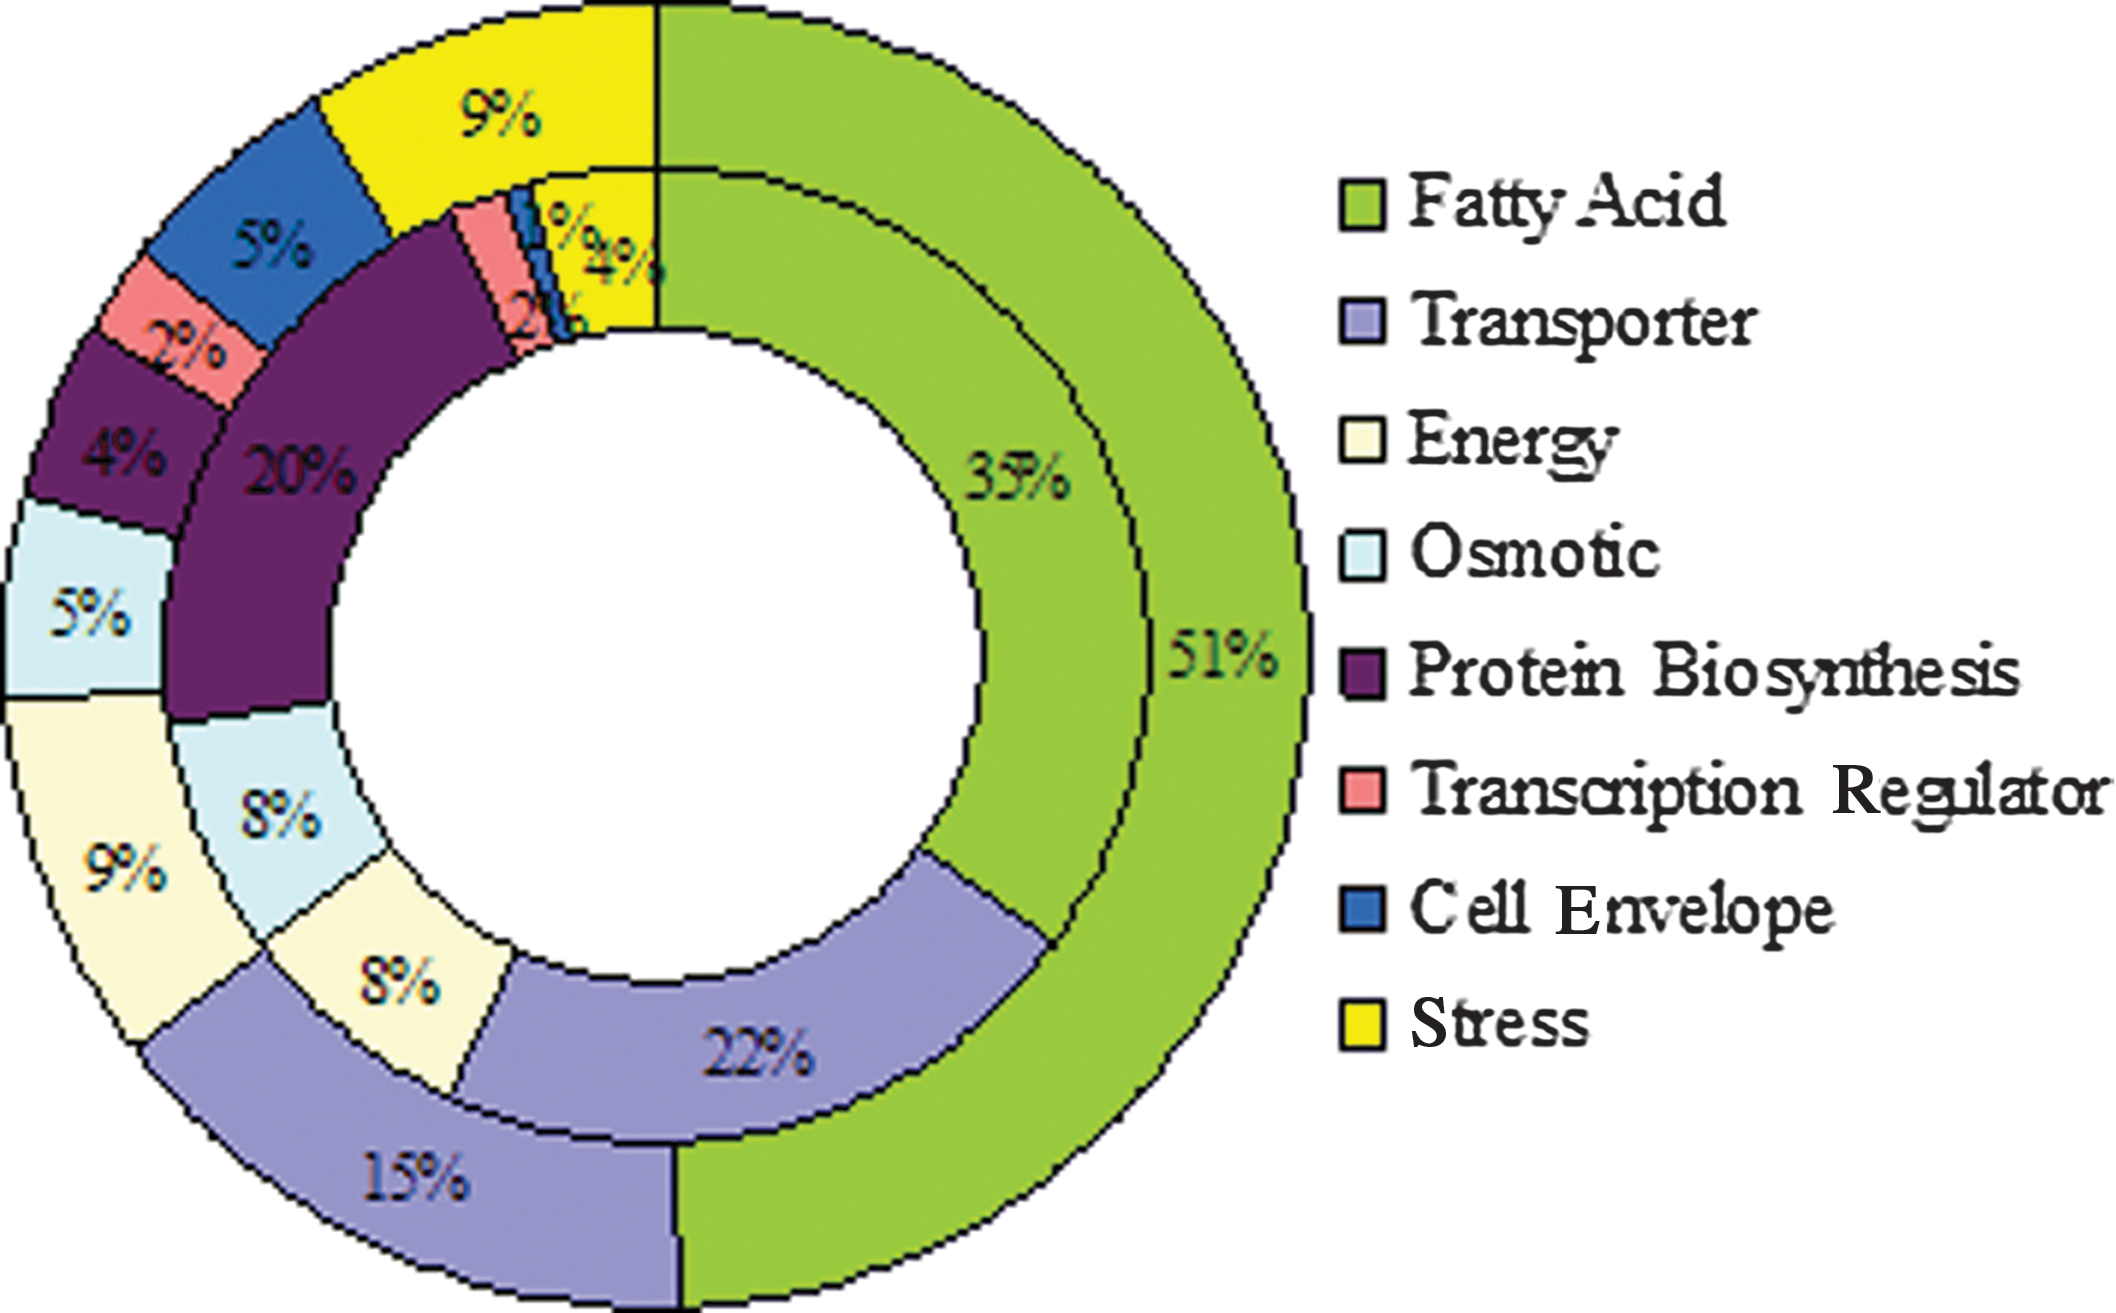
Comparison of the desiccation-induced total expression change in major functional groups between Salmonella Tennessee and Salmonella Typhimurium LT 2. The inner circle represents LT2; the outer circle represents Tennessee.
The maximum expression fold change of an ORF in each operon.
The degrees of freedom for the t-test statistic plus that associated with the Bayesian estimate are 10 for all the p-values.
Validation of the microarray data with quantitative reverse transcription–polymerase chain reaction (qRT-PCR)
qRT-PCR of nine genes was carried out to validate the microarray data, using the housekeeping gene agp (glucose-1-phosphatase) as an internal control since desiccation did not change its expression in array data (Fig. 4). Calibrated to the expression of agp, the Ct numbers of the nine genes closely correlated with the microarray data. Figure 4 showed that the fold change detected by qRT-PCR for each gene was not significantly different from the microarray data; therefore, the qRT-PCR validated both qualitatively and quantitatively the detection of the differentially expressed genes in the microarray data.

Validation of microarray data of the selected genes using quantitative reverse transcription–polymerase chain reaction (qRT-PCR). The fold changes in microarray data were converted to log2 value for comparison with the Ct number determined by qRT-PCR. Housekeeping gene agp was used as an internal control for qRT-PCR.
FA metabolism
FA in bacteria are mainly present in the cell membrane in the forms of lipoproteins and phospholipids (Suutari and Laakso, 1994). After 2 h of air-drying, the most significant transcriptional activity change in both strains of Salmonella was associated with FA metabolism. Gene fadA (3-ketoacyl-CoA thiolase) was up-regulated 94-fold in Tennessee and 64-fold in Typhimurium LT2 and represented the greatest expression change in both strains. Additionally, fadB, D, E, H, I, and L were up-regulated from +77 to +8-fold in Tennessee, and from +43 to +6 in LT2. The total fold change of the FA group constituted 51% of that of all genes with expression changes greater than 5 fold (516 out of 916-fold) in Tennessee, and approximately 35% in LT2 (327 out of 869-folds; Fig. 3).
Genes associated with two short-chain FA, propionic (prpEBCD) and butyric acid (gabTBD), were also among the top list of genes with up-shifted expression. prpEBCD were up-regulated in the range of +32 to +40-fold in Tennessee, and +10 to +25-fold in LT2. Operon gabTBD was up-shifted in the range of +27 to +33-fold in Tennessee, and +8 to +14-fold in LT2.
Osmoprotectants and trehalose metabolism
Genes related to glycine (+18, +18), choline (+10, +9), and proline betaine (+13, +15) transport were significantly up-regulated in both Tennessee and LT2 at similar levels (Table 2). In Tennessee, osmB (osmotic induced lipoprotein precursor) and otsB (trehalose biosynthesis) were the two additional genes up-regulated by about sixfold (Tables 2 and 3).
L and T represents Typhimurium LT2 and Tennessee, respectively. 2 and 0 represent 2-h desiccation treatment and no desiccation, respectively. The p-values in the shaded cells are greater than 0.05 confidences; thus, the difference is insignificant.
The degree of freedom for the t-test statistic plus that associated with the Bayesian estimate is 10 for all p-values.
Trehalose is a non-reducing glucose disaccharide, which can protect cell membranes from osmotic stress in many organisms (Elbein et al., 2003). Table 3 shows a comparison of the expression profiles of all trehalose biosynthesis pathways between two strains. The expression of the pathways otsBA (utilizing UDP-glucose) and treZY (glucan) was much greater in Tennessee than LT2 both before (Table 3; T0/L0: otsBA: +32, +8; treZY/ +10, +12) and after desiccation treatment (Table 3; T2/L2: otsBA/ +61, +16; treZY/ +8, +7). Moreover, desiccation treatment increased otsBA to a greater extent in Tennessee (+6, +4) than in LT2 (+2, +2).
TreBCR and TreA/F are two trehalose degradation pathways involved in capturing and transporting external trehalose into the cytoplasm for the TCA cycle (Crowe et al., 1988; Klein et al., 1995; Horlacher et al., 1996). A twofold increase of transcriptional activities in treBC was observed in Tennessee, as was treA in LT2 (Table 3). Precisely, expression of the periplasmic trehalase (treA) but not its cytoplasmic homologue (treF), was increased twofold in LT2 after desiccation. Consistently, transcription of treR, the repressor of treBC, remained unchanged by desiccation in both strains.
Trehalose production
To confirm the transcriptional activity of trehalose biosynthesis, trehalose production under desiccation was measured in both strains (Fig. 5). When Tennessee was stored at 11% ERH for up to 5 days, there was a linear increase in the glucose units in correlation with desiccation exposure time. One-way ANOVA analysis showed that trehalose production in Tennessee after 5 days, 24 h, and 2 h of desiccation treatment differed significantly with F (2, 30)=18.59, p<0.0001. The post hoc Tukey test showed a significant difference between the 5-day sample and samples of 2 or 24 h, but no significant difference between 2- and 24-h samples. There was no detectable increase of trehalose in LT2 during storage at 11% ERH for up to 5 days. The significant induction of trehalose in Tennessee is consistent with its greater resistance to desiccation, compared to LT2.
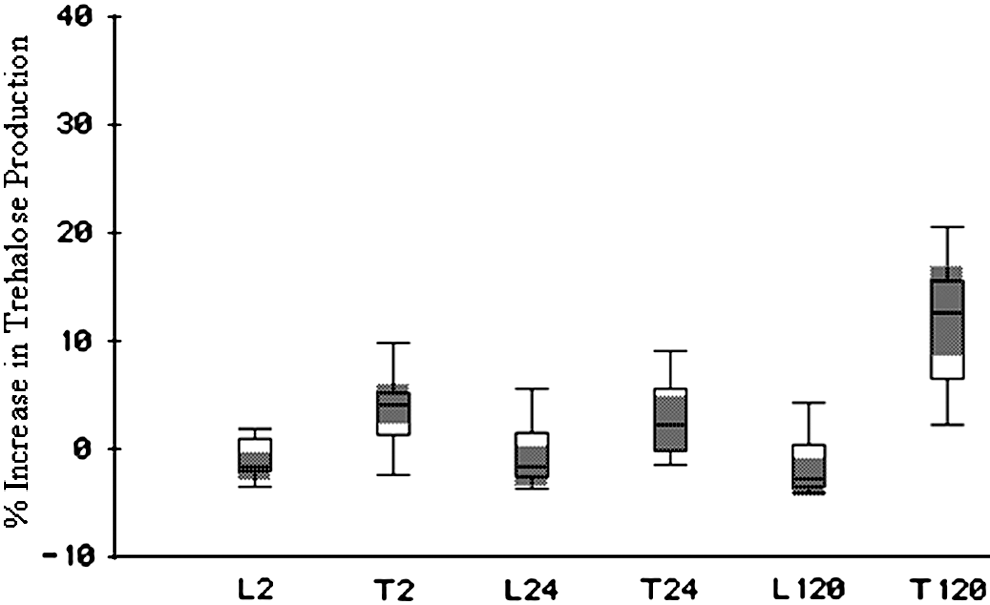
Box Whisker Plot of trehalose production induced by desiccation in Salmonella Tennessee and Salmonella Typhimurium LT2. The 75th percentile (top edge of the box), 25th percentile (bottom edge of the box), and median (line inside the box) provides an overview of data distribution. T, Tennessee; L, Typhimurium LT2; 2, 24, and 120, hours of desiccation treatment.
Transcription of genes associated with filamentation, fimbriae, and flagella was not increased significantly by 2-h desiccation
Many previous studies of osmotic pressure resistance in Salmonella have suggested that filamentous cell formation and the rdar morphology development are major survival strategies during long-term starvation and desiccation, and that the latter is mainly due to the co-production of cellulose and thin aggregative fimbriae (Mattick et al., 2003; White et al., 2006, 2008). Nonetheless, within the 2-h air-drying treatment, expression of these functional groups was not significantly changed compared to control stationary phase samples (Fig. 6).
Filamentous cell formation was presumably caused by incomplete cell division. Our microarray data showed that cell division functional components either remained the same ( ftsZ,) in both strains or were moderately up-regulated by desiccation ( ftsI: ∼+2 in both strains; ftsW, I: ∼+2 in Tennessee). In Escherichia coli, it is known that the MinCDE system prevents the FtsZ ring from being formed in locations other than the middle of the cell membrane during cell division (Rothfield et al., 1999; Huang et al., 2003). The array data showed that minCD were up-regulated approximately +2-fold by desiccation in Tennessee and were unchanged in LT2. Transcription of minE remained the same in both strains. Therefore, ftsZ and minCDE were not down-regulated by 2 h of desiccation, suggesting that FtsZ ring formation and cell division were not suppressed.
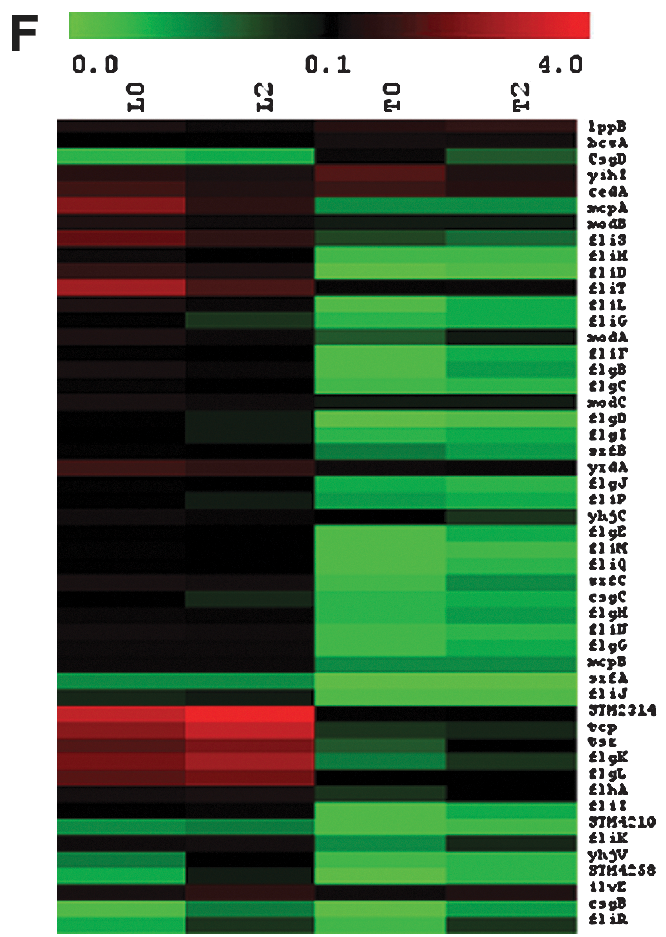
The 13 putative operons involved in chaperone-usher assembly of flagella (Fig. 6E), as well as operons involved in curli (thin aggregative) fimbriae formation (Fig. 6C), cellulose synthesis (Fig. 6A), extracellular polysaccharide synthesis (Fig. 6B), and Tennessee-specific fimbriae formation (Fig. 6D), were assembled in a heatmap for the expression analysis. Expression of the majority of listed genes was very low; and even among the three relatively highly expressed operons (yih,saf, fim), none of them were up-regulated by more than twofold by desiccation treatment. This analysis indicated that the genes involved in rdar morphology and filamentous cell formation did not play a major role in the immediate response to air-drying desiccation stress.
Inhibition of flagellar gene expression was another distinct feature observed in the microarray data (Fig. 6F). Expression of flagella-associated genes in Tennessee was much lower than in LT2, and appeared to be tightly shut down once cells entered into the stationary phase. In contrast, STM2314, tcp, fliTS, flgKL, mcpA, cedA, tsr, and yrdA in LT2 were expressed at moderate levels; however, none of them were significantly up-regulated above twofold by desiccation.
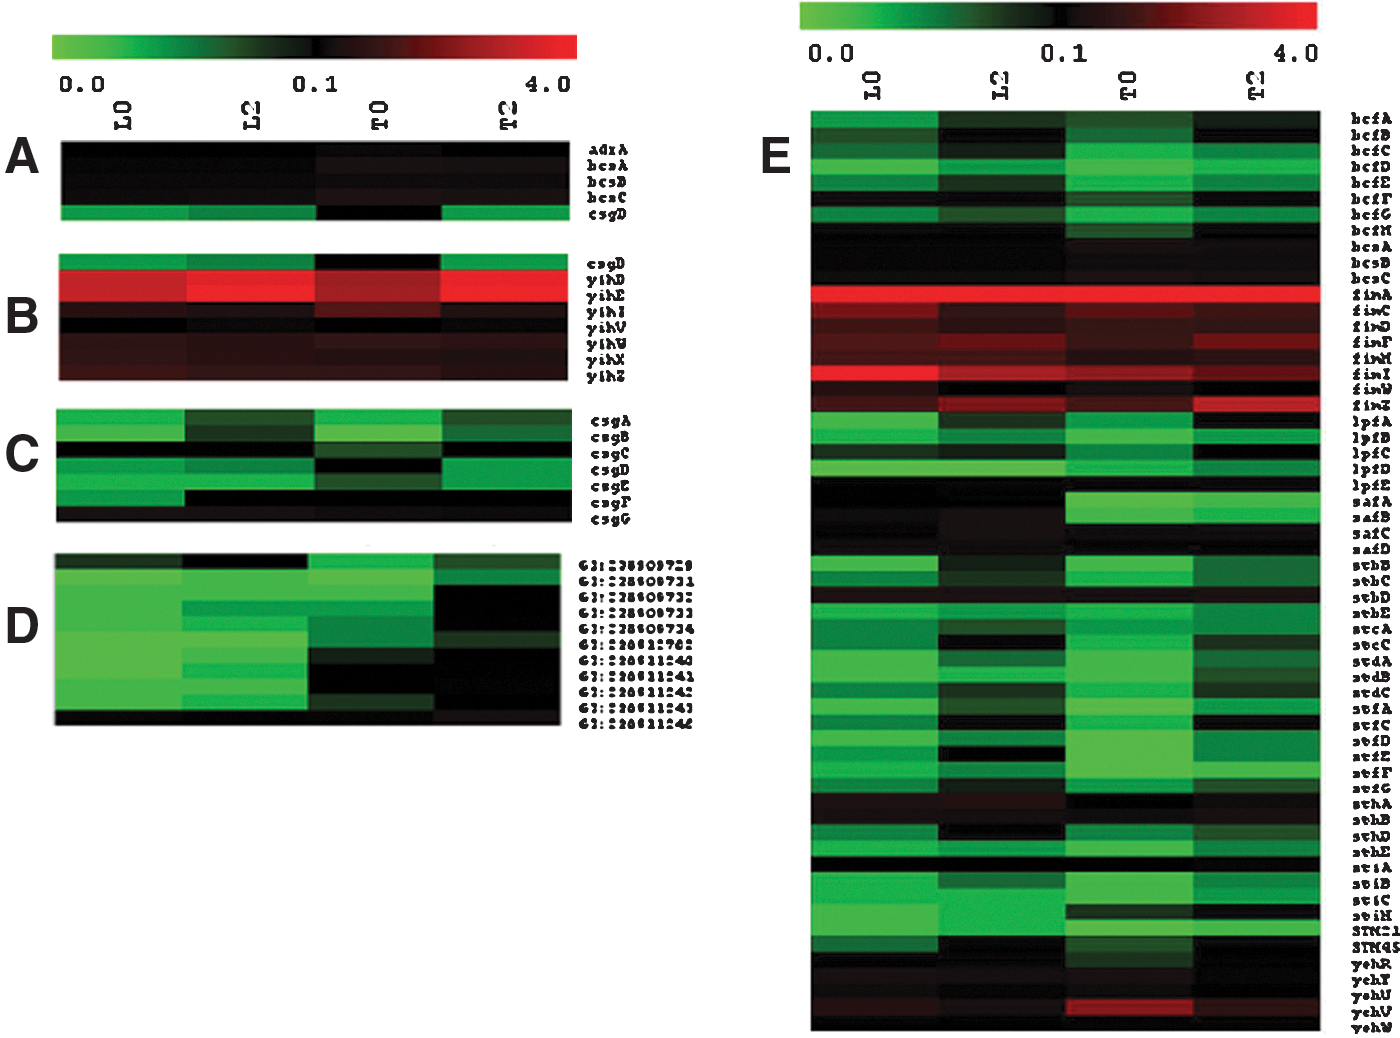
Pseudo-color expression heat map of Salmonella Tennessee (T) and Salmonella Typhimurium LT2 (L) genes involved in cellulose
Discussion
A clear message from our array data is that FA metabolism is the most significantly induced physiological activity when Salmonella is air-dried on a surface for 2 h. The change of FA profile was observed previously in Salmonella, Listeria, and other bacteria in response to low pH and high growth temperature, but not under desiccation stress (Alvarez-Ordonez et al., 2008). The drastic increase in FA metabolism is likely because the starvation response elicits a need for energy by the cell and the osmotic pressure induces a need for a more rigid membrane (low fluidity). FadA (3-ketoacyl-CoA thiolase), which showed the highest expression fold change in both strains, is involved in the last step of the beta-FA oxidation pathway, which degrades long-chain FAs into acetyl-coA that can be fed directly into the TCA cycle. The oxidation of FA generates significantly more ATPs per carbon atom than that from an equivalent number of glucose carbon atoms; therefore, it is a very cost-effective energy source for cells (James et al., 1999). The changed FA composition may affect the fluidity and thermodynamics of the cell membrane. A more descriptive study of FA metabolism in response to desiccation might unlock important information on mechanisms of Salmonella desiccation survival and thermal resistance.
This study is the first report regarding the global gene expression profile of Salmonella exposed to air-drying on a solid surface. Most Salmonella survival studies involving expression analysis at the individual gene level have been carried out in broths with low water activity (aw) generated by humectants or prolonged growth on agar plates. Our data showed that air-drying at 11% ERH for 2 h did not further increase the expression of genes associated with filamentous cell formation and rdar morphology, as observed in previous studies. The lack of change in expression of genes associated with these phenomena in both strains may be partly due to the short exposure time, i.e., desiccation for 2 h versus several days; or due to the more stringent stress, i.e., a water activity of 0.11 compared to ≥0.94 used in previous studies (Mattick et al., 2000).
The most significant difference between the two strains was the decreased protein biosynthesis in Tennessee (4%) than in LT2 (20%). In comparison to LT2, Tennessee also showed more active stress responses and cell envelope modifications, and a more stringent shut-off of flagella formation, as well as a significant increase in trehalose production. A conceivable explanation is that protein biosynthesis and flagella assembly are very energy-expensive events, and a redirection of energy into other metabolic needs endows Tennessee with better survival during desiccation/starvation stress. The lack of the osmotic protectant trehalose and the cell envelope modifications, and the less efficient stress responses in LT2 due to its mutated rpoS, all help to explain the weaker desiccation resistance phenotype in LT2 compared to Tennessee (Elbein et al., 2003).
While the exact mechanisms for these responses remain speculative, this study has shed light on our understanding of the desiccation resistance of Salmonella. Further characterization of these cellular responses will unlock the desiccation resistance mechanisms in Salmonella and move us one step further to reach our ultimate goal of controlling Salmonella in dry foods and processing environments.
Footnotes
Acknowledgments
We thank Dr. Kaiping Deng for helpful discussions.
Disclosure Statement
No competing financial interests exist.