
Abstract
The Shiga toxin–producing Escherichia coli O104:H4 outbreak in Germany in 2011 required the development of appropriate tools in real-time for tracing suspicious foods along the supply chain, namely salad ingredients, sprouts, and seeds. Food commodities consumed at locations identified as most probable site of infection (outbreak clusters) were traced back in order to identify connections between different disease clusters via the supply chain of the foods. A newly developed relational database with integrated consistency and plausibility checks was used to collate these data for further analysis. Connections between suppliers, distributors, and producers were visualized in network graphs and geographic projections. Finally, this trace-back and trace-forward analysis led to the identification of sprouts produced by a horticultural farm in Lower Saxony as vehicle for the pathogen, and a specific lot of fenugreek seeds imported from Egypt as the most likely source of contamination. Network graphs have proven to be a powerful tool for summarizing and communicating complex trade relationships to various stake holders. The present article gives a detailed description of the newly developed tracing tools and recommendations for necessary requirements and improvements for future foodborne outbreak investigations.
Introduction
F
Therefore, we describe here the information technology tools for trace-back and trace-forward investigation of food supply chains that were developed ad hoc during this large STEC outbreak to identify the vehicle of the pathogen and to stop the outbreak. Requirements for improving the elucidation of future outbreaks are also presented.
Materials and Methods, and Results
General trace-back and trace-forward strategy
A trace-back investigation is the method used to determine and document the full distribution and production chain in order to identify the sources of a product that has been implicated in a foodborne outbreak (EFSA, 2011b). Without reliable information on the contaminated vehicle, the first step is usually the selection of cases complying with a case definition. In more complex situations, outbreak clusters are chosen if available that may allow microbiological investigation of retained food samples and/or interviews with human cases to identify food commodities or recipe components as candidates for trace-back. If a common source (e.g., producer or supplier) can be identified, it might be possible to investigate the entry site and probable source of the contamination (Fig. 1). Subsequently, trace-forward from this common network node in direction to the customer is a strategy to detect yet unknown outbreak clusters or critical nodes (e.g., grocery stores) where contaminated food commodities might still be available (EFSA, 2011b).
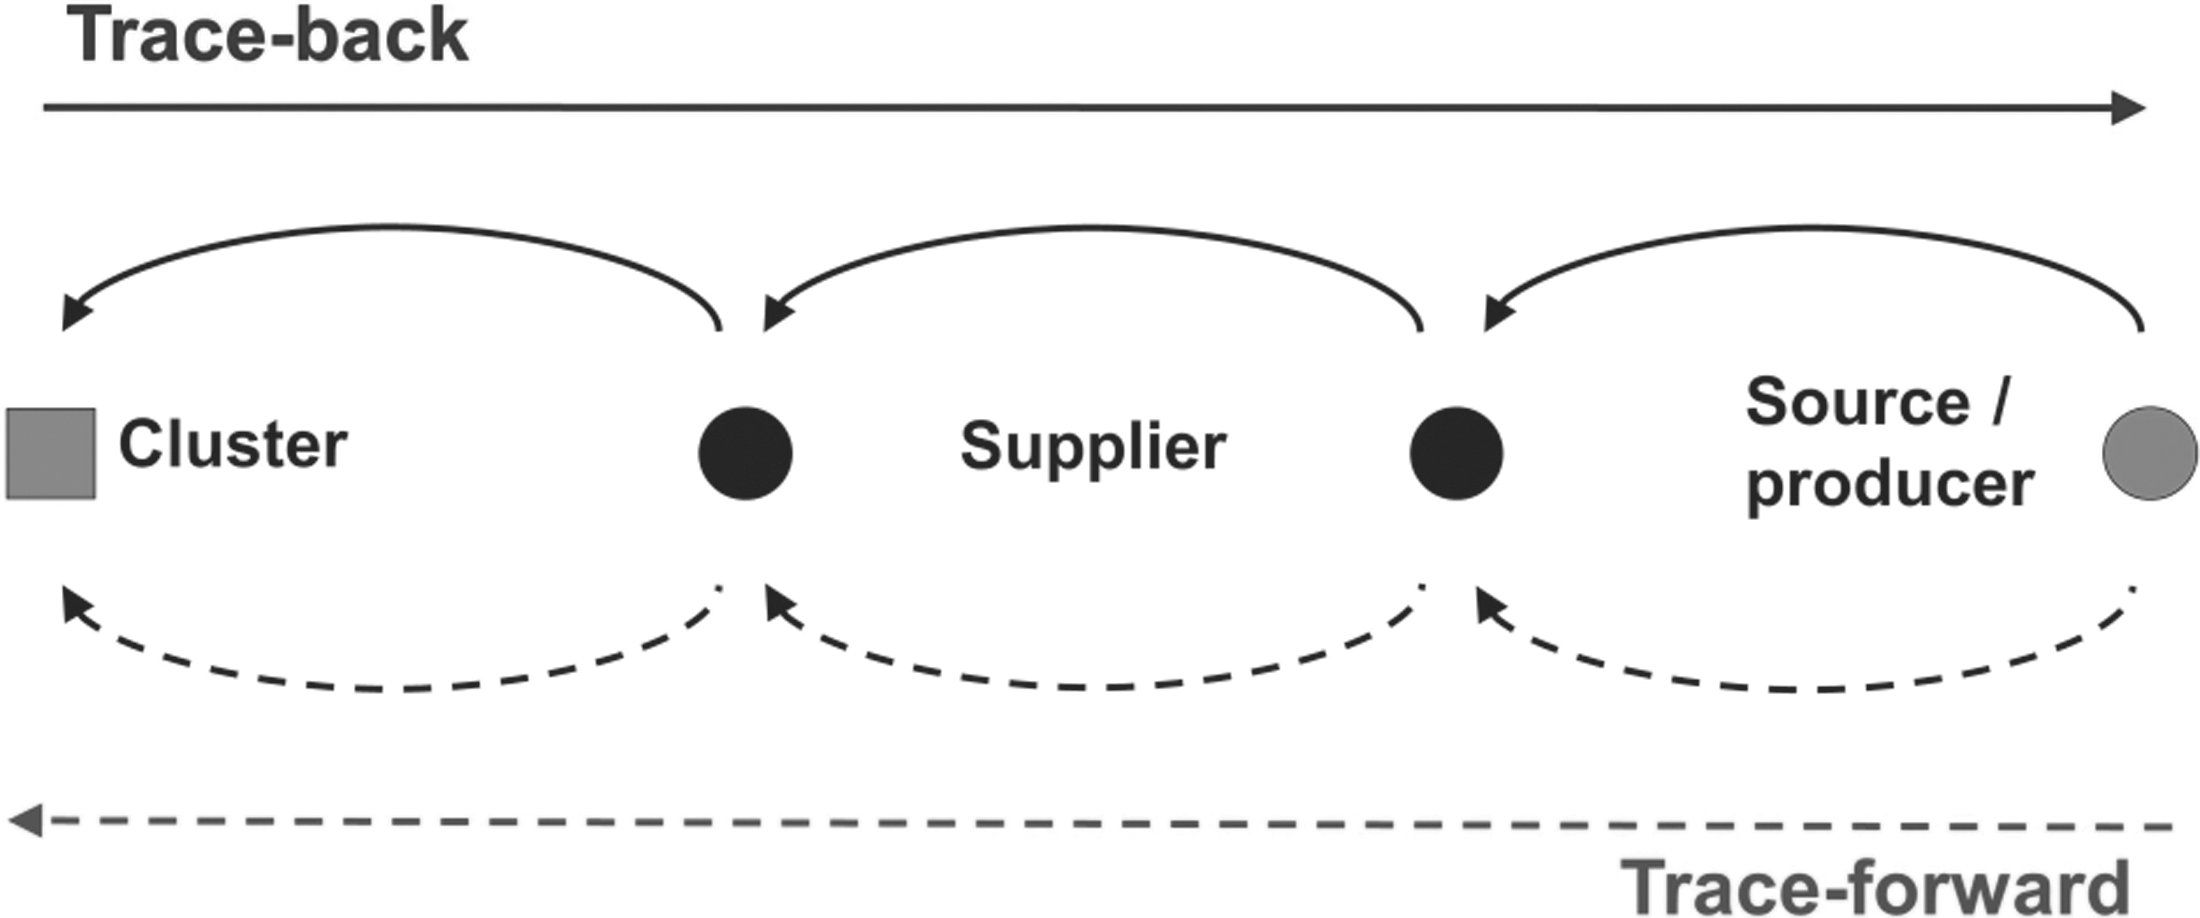
Scheme of tracing strategies: (1) Disease clusters are identified (by public health authorities). (2) Trace-back is performed in order to identify common nodes of different clusters (straight solid arrow). (3) Trace-forward is performed in order to identify yet unknown or potential clusters (straight dotted arrow). This strategy is usually followed within the context of an ongoing process that involves company audits, local sampling, and further trace-back and trace-forward investigations.
Structure of data collecting tools
Up to the German STEC O104:H4 outbreak in 2011, no systematic data collecting tool for an appropriate outbreak tracing along complex food chains and analysis of trade data was available in Germany. Therefore, a new data collecting and exchange format together with new data analyzing tools had to be developed.
(1) Data collecting tool based on Excel
For a stepwise and consistent trace-back and trace-forward investigation, the data collecting tool had to fulfil three major requirements: (1) it should be easy to handle for a wide variety of users, (2) data should be importable into a centralized database, and (3) it should be possible to forward the data electronically (e.g., via e-mail) to specialists ensuring a rapid working flow.
Based on experiences made during initial trace investigations during the outbreak, an Excel sheet had been designed to collect all information that is essential for a lot-specific trace-back and trace-forward. The layout of the tables follows the requirement for the Food Business Operator to document all trade data one-step-up (items received) and one-step-down (items delivered) according to Regulation No. 178/2002 (European Commission, 2002). The original Excel template with example data and a short manual is provided in the Supplementary Data (available online at
(2) Relational JAVA-based database HSQLDB
HyperSQL database (HSQLDB:
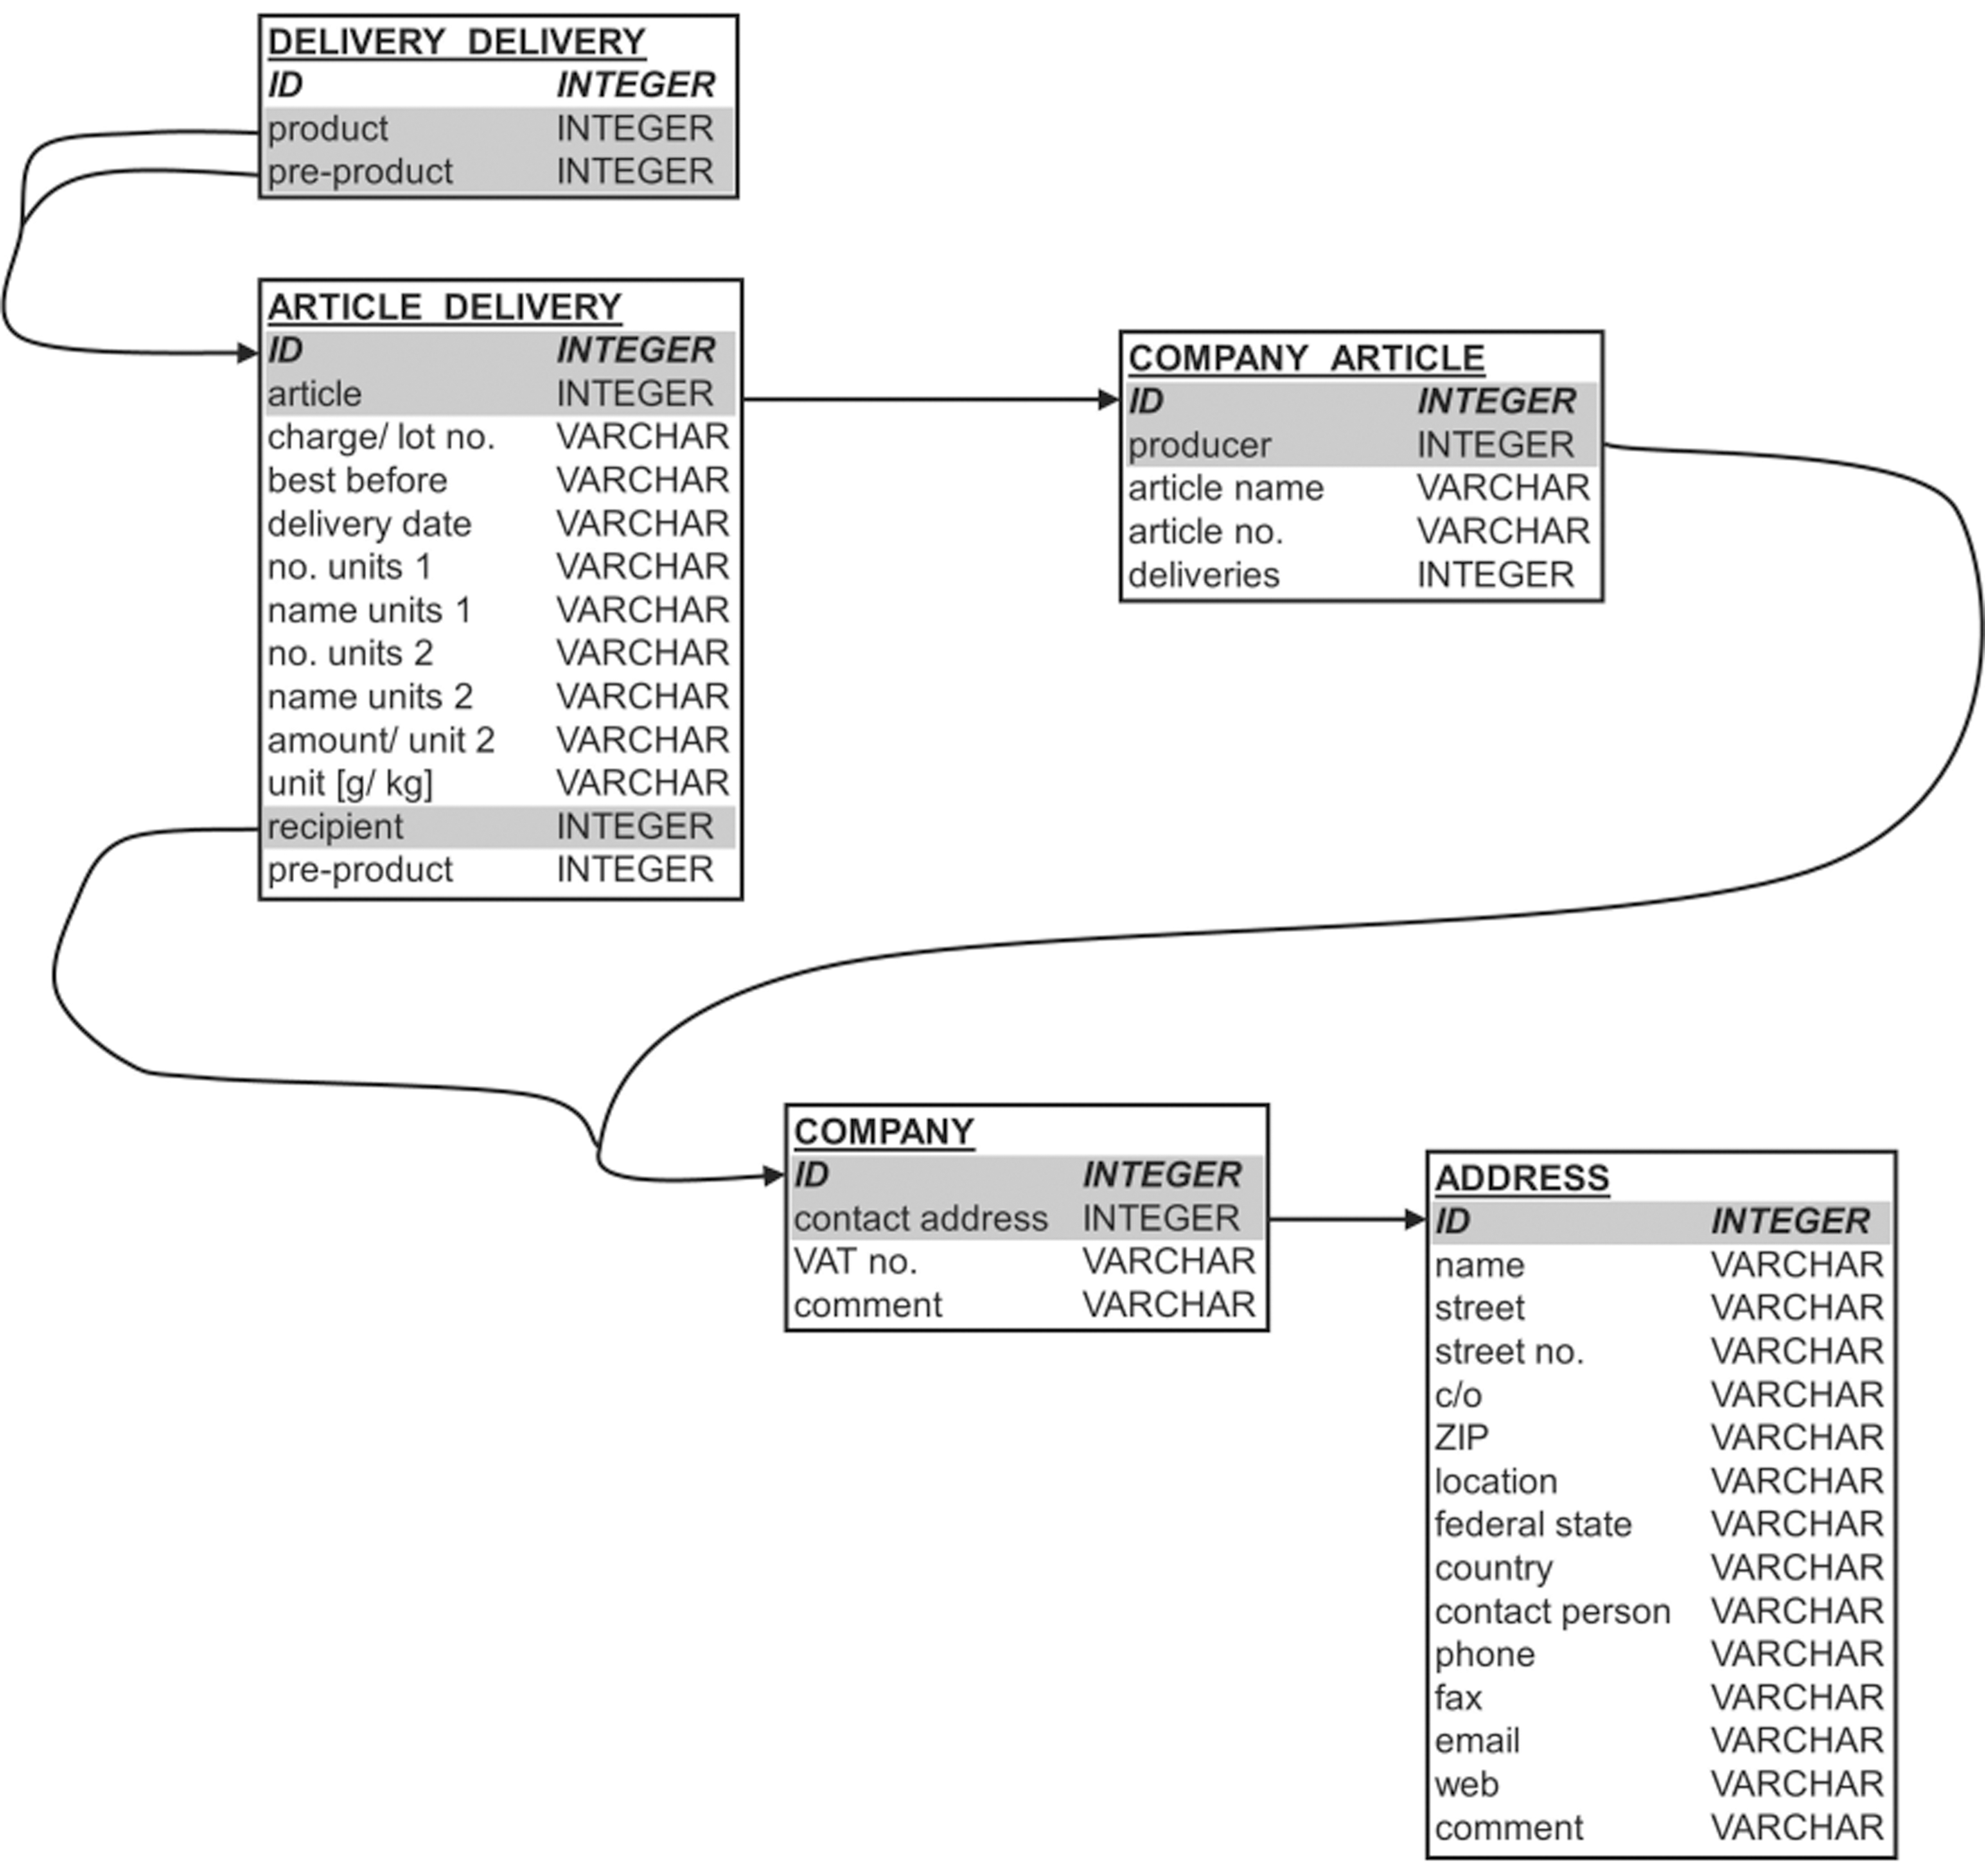
Database structure. The database consists of five tables that are relationally interconnected by the gray shaded items.
Capabilities of the tools for food tracing investigations in outbreak situations
Data collection and import into the database
Available data can be filled into the Excel sheet by the industry/authority/institution responsible for the trace-back and/or trace-forward investigation. As a prerequisite, the pre-filled tables are sent directly to the companies or competent authorities that have to complete the missing data. Regarding the import into the database, the number and sequence of Excel sheets are irrelevant.
During the import step into the database, the data is tested for correctness and consistency, and redundant data are eliminated. These tests include checks of correct food operator names and addresses, and safe and sound assignment of supply chains, respectively. Each food operator detail (e.g., zip code, street, town) must be unique—which is in comparison to primary data collection (as done by Excel sheets) rarely true in reality. Zip codes are checked for actually existing. Tests for correct food operator assignment include a similarity search for addresses, which can be re-checked interactively. The same similarity algorithm is applied for product names, product numbers, and lot numbers. Additionally, tests were performed for plausible time frames (i.e., the chronology within a supply chain): outgoing deliveries within the same lot have to occur after the incoming deliveries. Furthermore, quantities of each product were checked for (1) getting smaller along the supply chain and (2) being of the same order of magnitude for incoming and outgoing deliveries/storage at each company.
Analysis and visualization of the data
The most self-evident task on the data analysis is the visualization of the supply chains as a network graph. The more data that is collected, the less analysis of the trading network is manageable without computerized tools. Database filters were developed to look at specific categories related to products (e.g., product name, lot number, or food operator name). If the filter criteria are met, then each node of the supply chain is included in the output, even if a node itself does not directly fulfil the filter criteria. For example, one food operator is chosen as filter, and then information on all network nodes directly or indirectly connected by supply chains to this food operator is given as output. An arbitrary number of filters may be put together, resulting in a graph that is more manageable as more filters are set.
The identification of common nodes is straightforward: selecting specific nodes in the network (e.g., the outbreak clusters) and desired filters (e.g., lot number 48088) results in a list of common nodes and their connections among each other within the network.
All filtered data can be exported using standardized data formats (*.xls, *csv, *.xml, *.txt) as interface to other software environments (e.g., R or graphviz) for further analysis. Besides the node identity and edge direction, these sheets can provide further information on product quantity balances of each node, quantity units for each delivery along the network edges, delivery dates, and start and end points of each supply chain.
Visualization of the supply network was accomplished in multiple ways by importing the filtered output format into visualization tools which translated them into graphs or projections. For the R package “network” (Butts, 2008) (
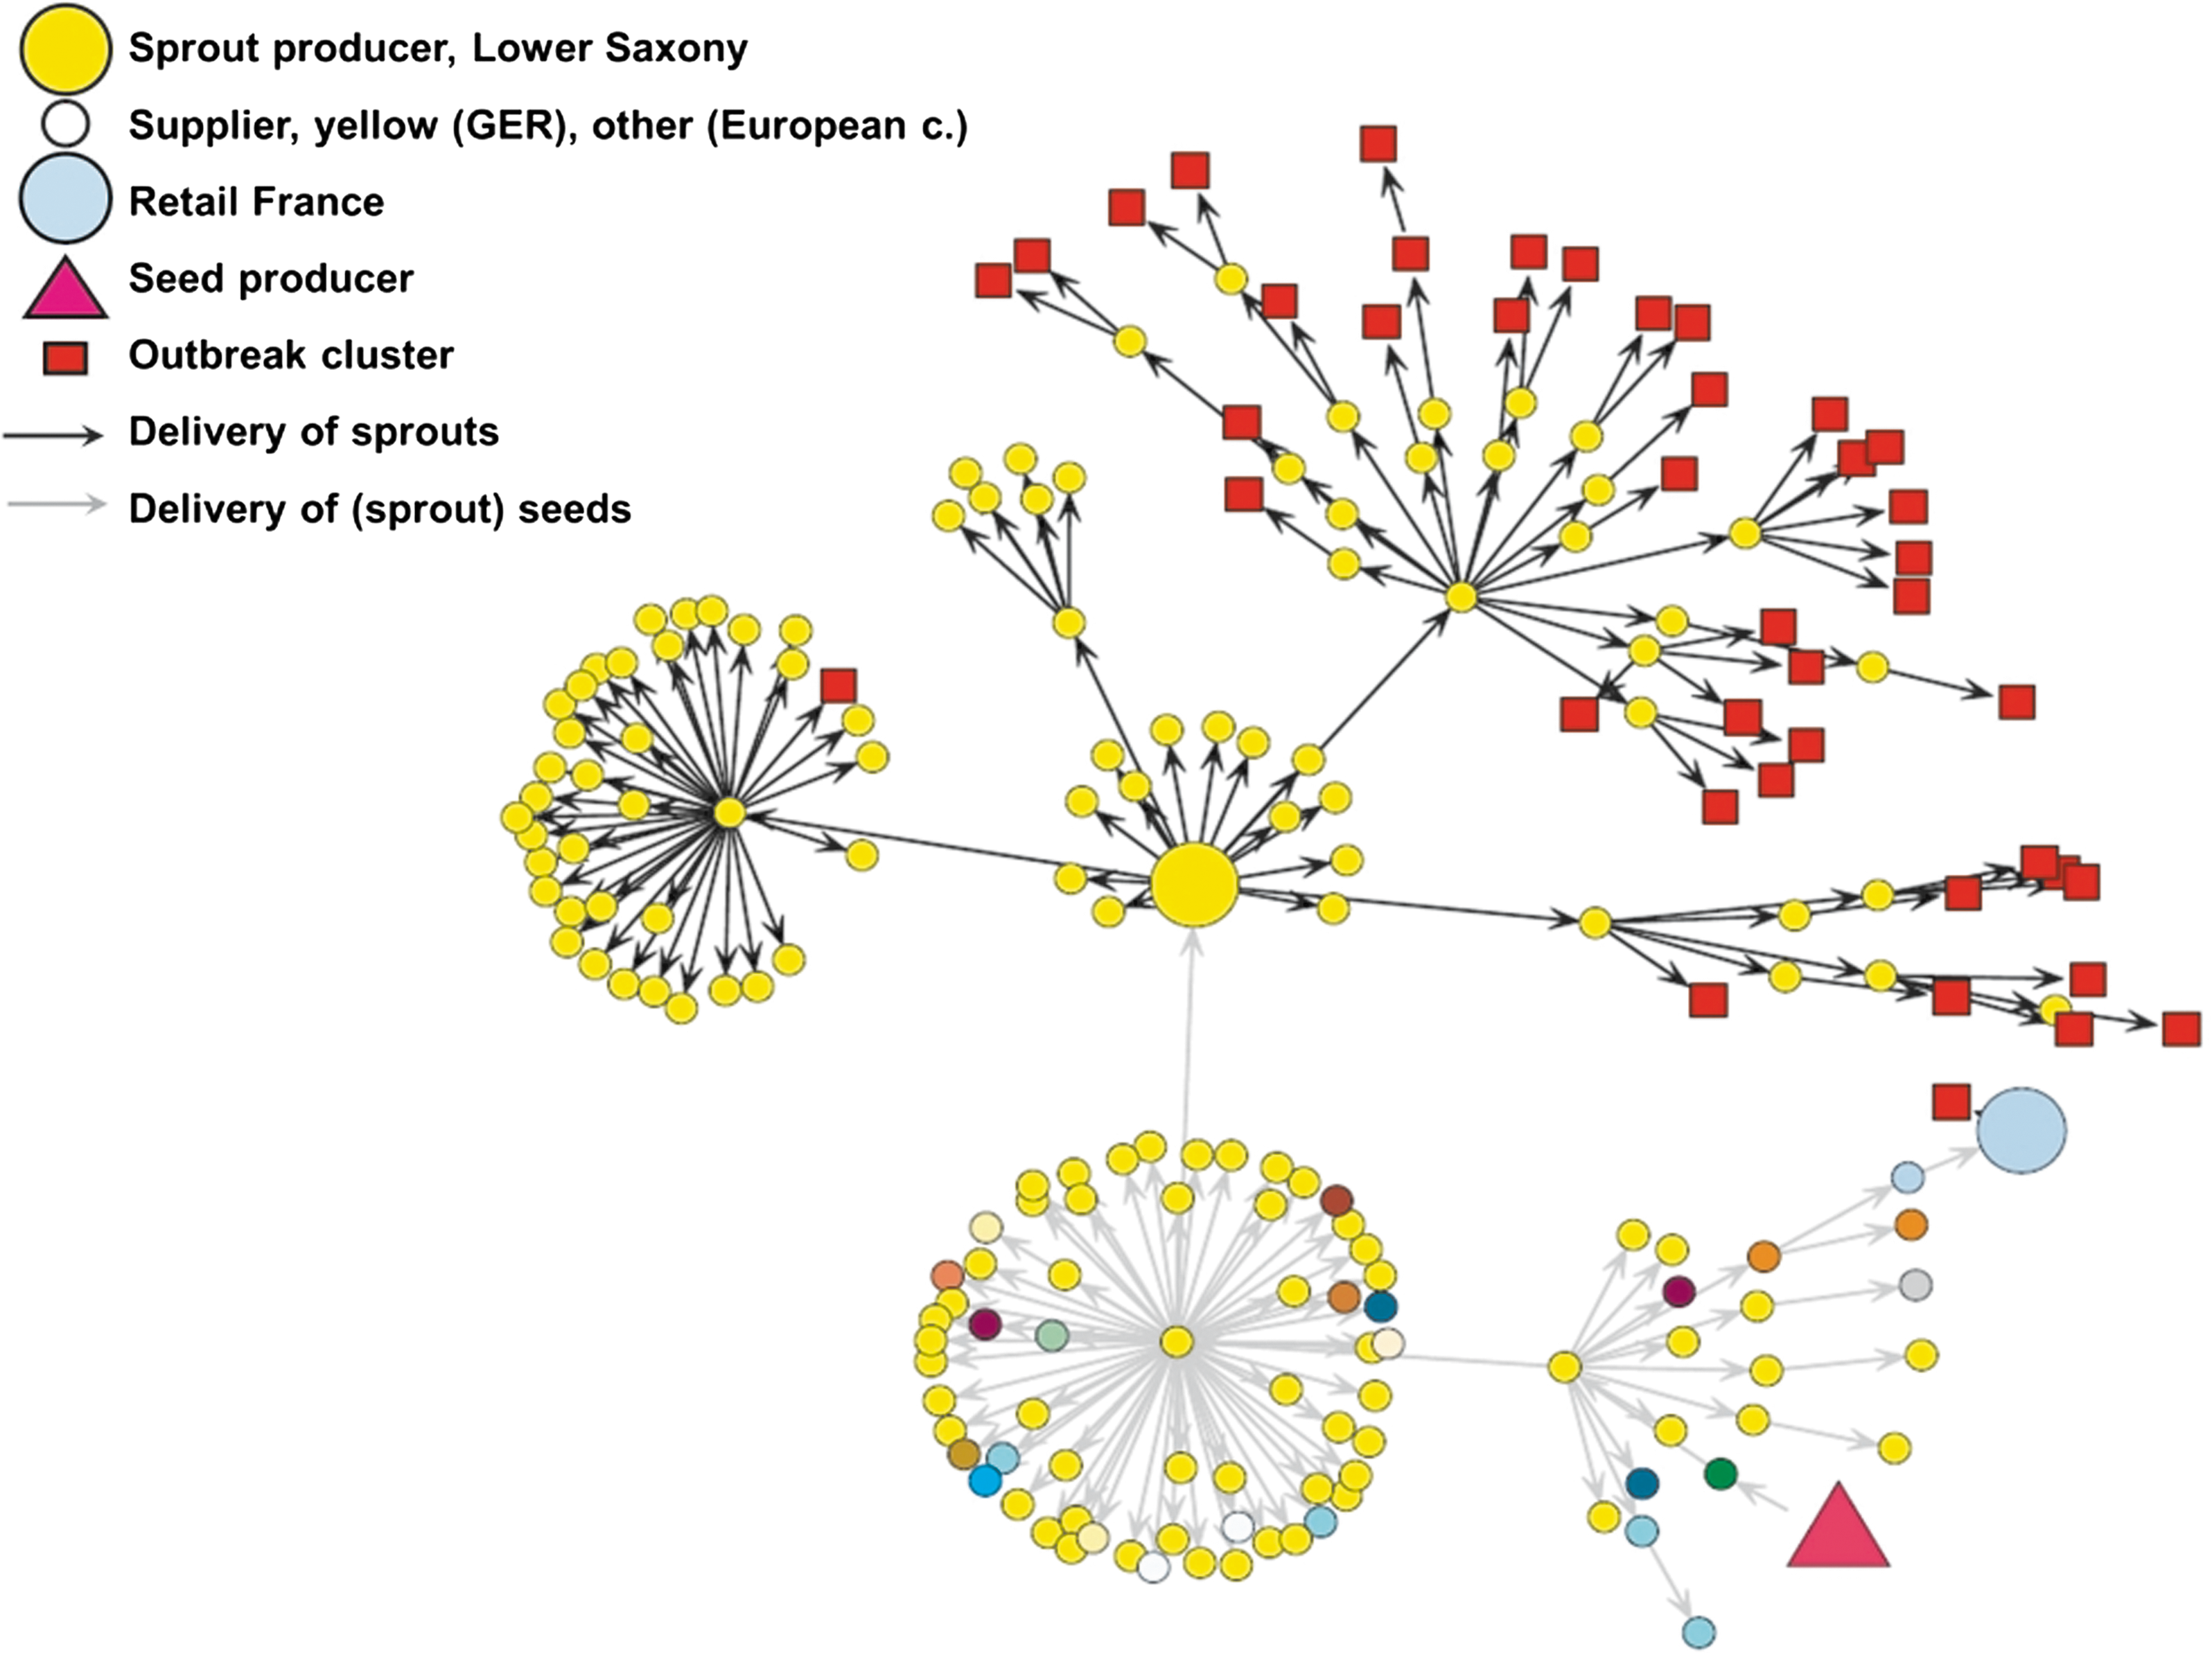
Combined network of all relevant fenugreek seed and sprout supplies. Supplier network of the STEC O104:H4 outbreak in 2011; results of combined forward and backward tracing of the supply chain. Here, all the companies are represented that have come in contact with the suspected batch of seeds or produced sprouts (created with the R-Package “network,” available at
Other visualization opportunities were realized with the graphviz visualization software (
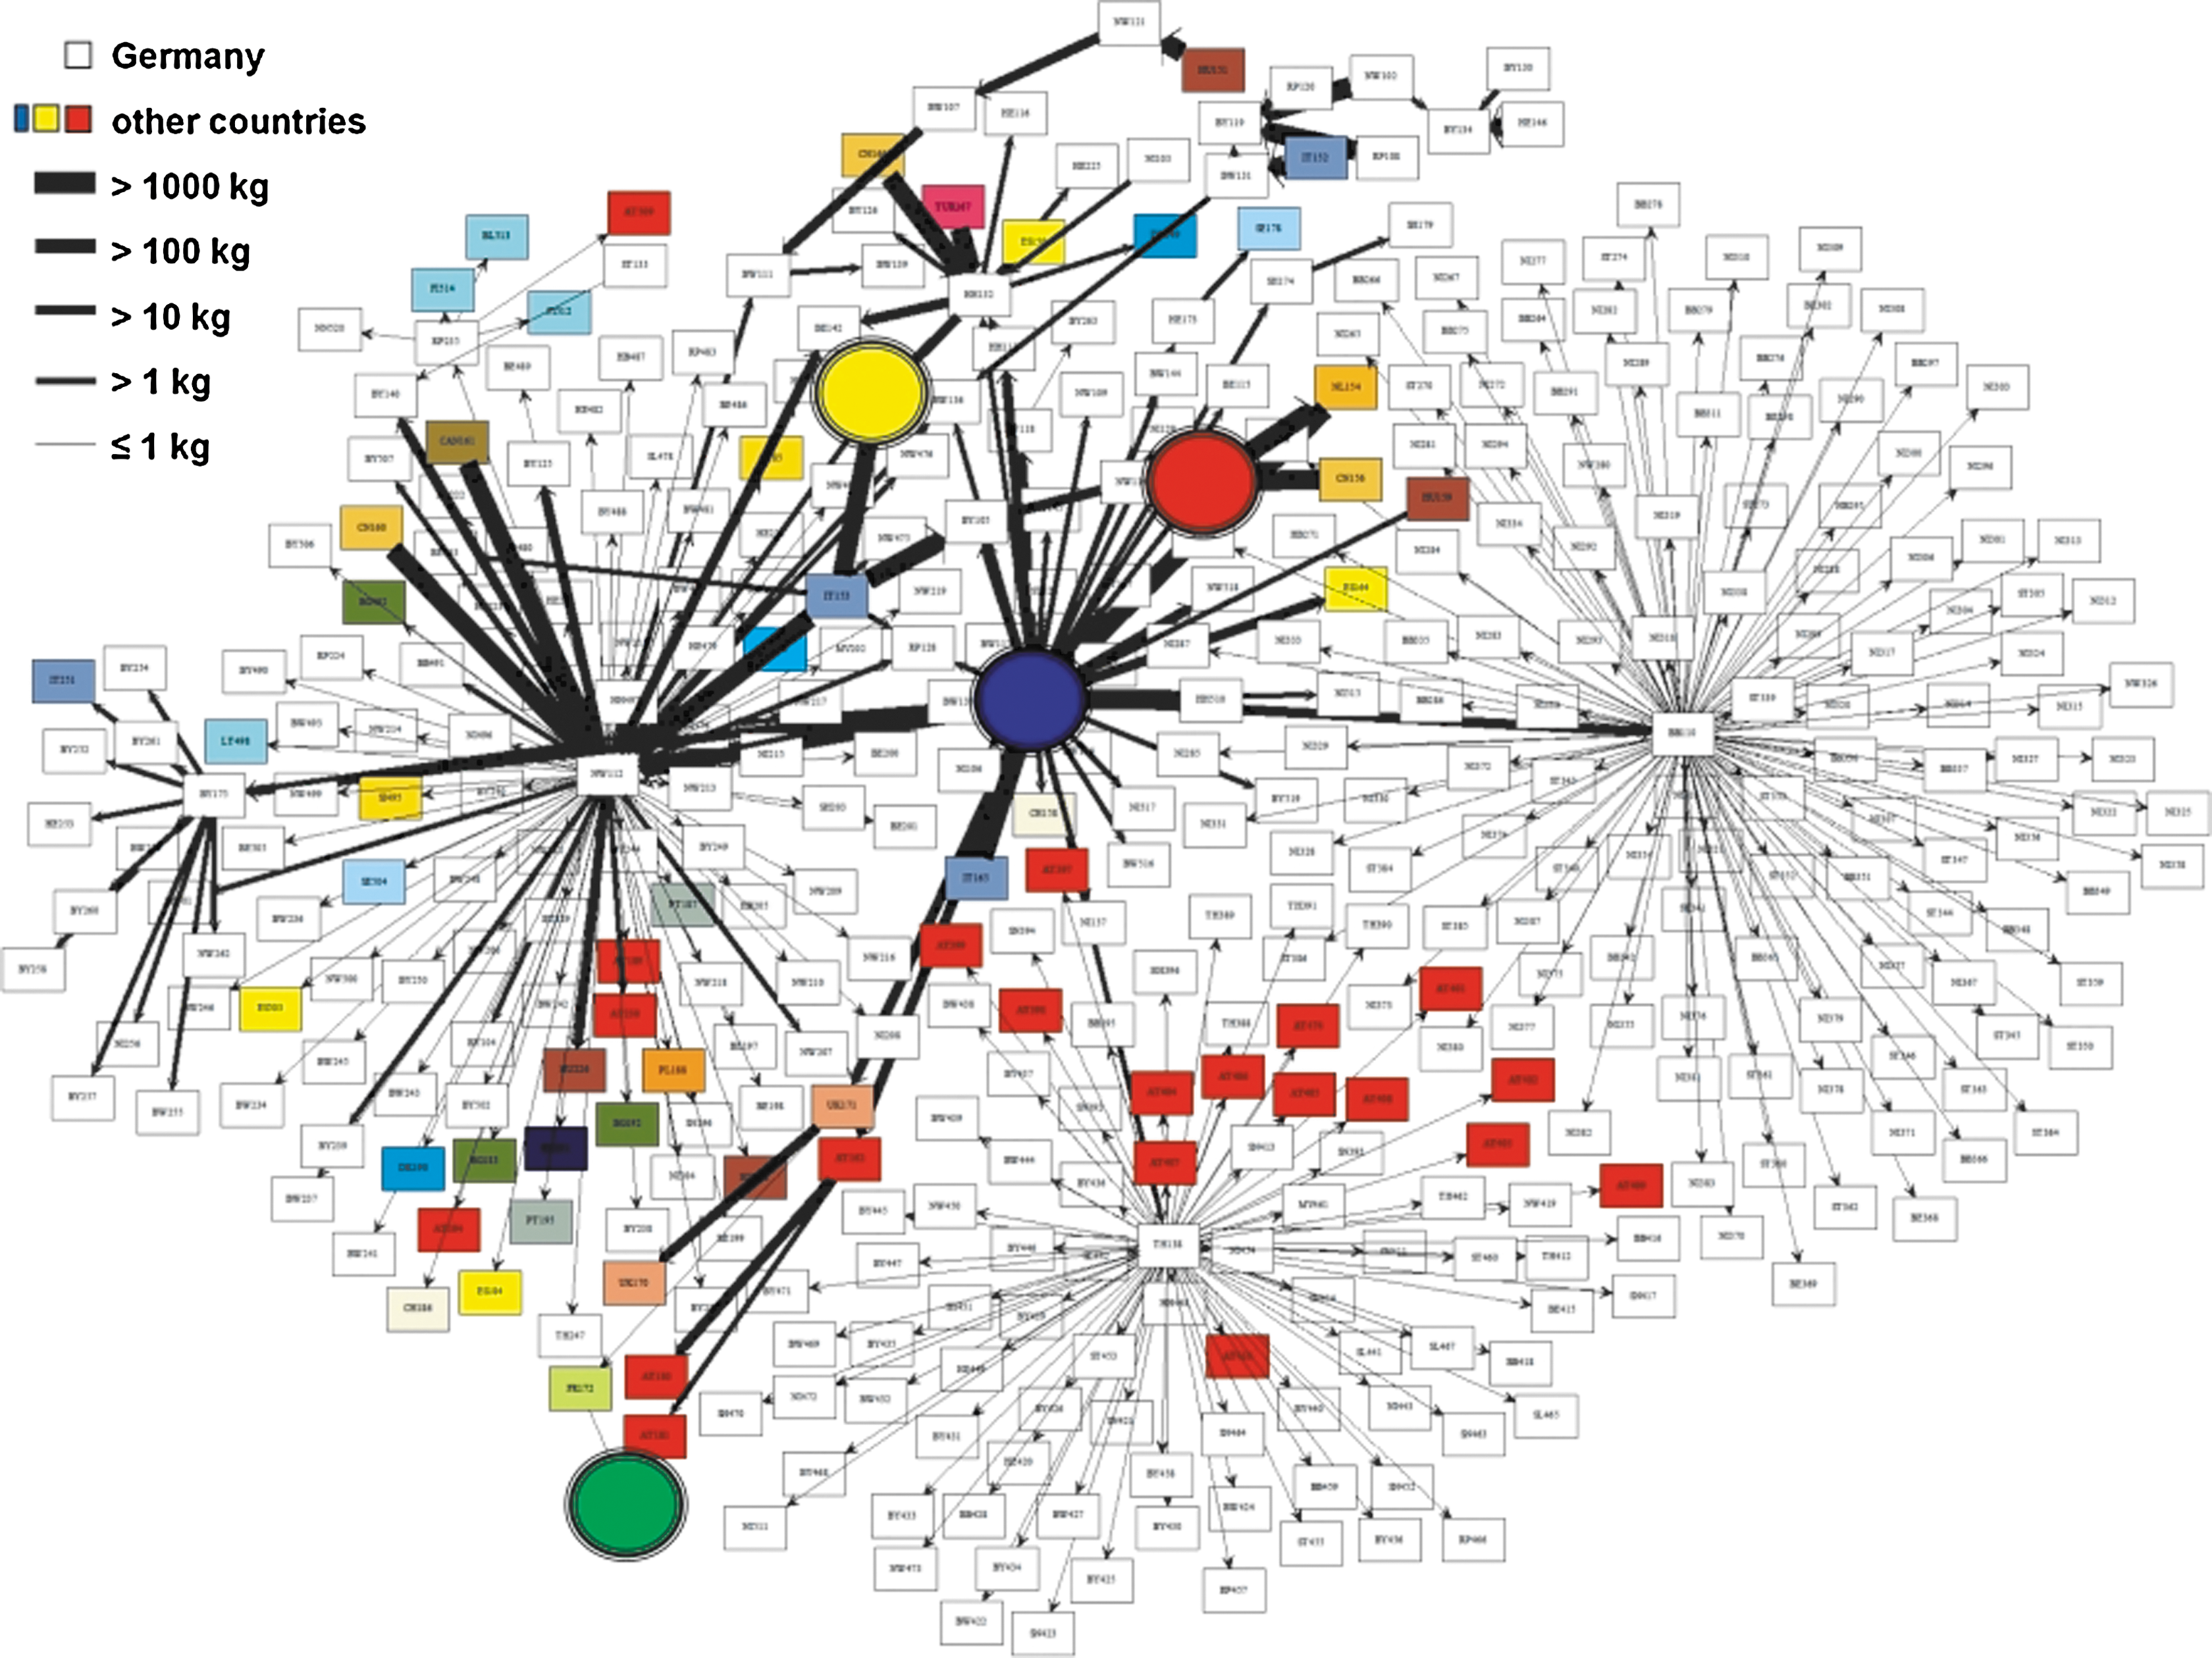
Representation of the delivery quantities and routes of all examined seeds (six varieties, including fenugreek). The rectangles contain anonymized names of companies and provide distributors, producers, and retailers (foreign companies are represented in color). The delivery quantities vary between a minimum of 50-g pack and a maximum of 15 tons—indicated by the thickness of the arrows. The most important spots in the network are circled and colored: horticultural farm in Lower Saxony (yellow), French retailer (green), German importer (blue), and Egyptian exporter (red) (created with graphviz, available at

County-based geographical projection of the known distribution of sprouts from the horticultural farm in lower Saxony using Google Earth. The horticultural farm in Lower Saxony is located in the county shown in light gray. Sprouts produced there were delivered into the counties shown in white.
Results during the STEC O104:H4 outbreak 2011
Based on information collected and analyzed by the RKI (Federal Institute for Risk Assessment, 2011b; Frank et al., 2011; RKI, 2011) in several case-control and cohort studies, a list of 91 potential food items was generated by the German Task Force EHEC (Bernard et al., 2011), which was the basis for the tracing analysis. Due to the historical involvement of sprouts in several STEC outbreaks (Como-Sabetti et al., 1997; Breuer et al. 2001; Ferguson et al. 2005; Michino et al. 1999; Taormina et al. 1999), they were one important food item group on that list; the other groups were herbs, small leaves, lettuces, onion/leek, and fruit vegetables (e.g., tomatoes). When France reported a cluster of patients with bloody diarrhea, caused by the identical outbreak strain, the same tracing approach was used on the European level to investigate the seeds used for sprouting. A list of six suspicious seed types were generated by the EFSA Task Force (EFSA, 2011b). Finally, the seed supply chains were traced back to December 2009 and the sprout supply chains to mid-April 2011.
Network graphs showed that a horticultural farm in Lower Saxony and several first-step post-suppliers were hubs in the sprout and seed trading network linked to many outbreak clusters (Fig. 3). Furthermore, the trading patterns of the six seed types showed that, within the seed trading network in Germany, there are only four to five hubs ensuring the integrity of the whole network consisting of more than 400 companies (Fig. 4). However, the German and French outbreak could only be connected via one specific lot (48088) of fenugreek seeds imported from Egypt in December 2009 (Fig. 3). From these seeds, sprouts were produced at the horticultural farm in Lower Saxony and by private households in France, thus making fenugreek seeds the most likely underlying source of the outbreak (Bernard et al., 2011; EFSA, 2011a, b). The trace-back/trace-forward investigations revealed that the same lot of fenugreek seeds was traded via suppliers from Germany, the United Kingdom, and France (Fig. 3) and was split into two different supply chains 16 months before the outbreak event took place. The geographical projection (Fig. 5) indicates that all counties in Germany where sprouts were produced at the horticultural farm in Lower Saxony (county with dark gray border) were traded to. This projection gives also an impression of the geographical scale that can be affected by products of only one business operator (see also geographical projection of STEC cases in RKI [2011]).
Discussion
During investigations of foodborne outbreaks (animal- and plant-based vehicles), much emphasis has been laid on case interviews and microbiological analysis of food samples. When there has been a failure to detect the microbiological agent in food, a trace-back strategy combined with epidemiological analysis is a suitable method to identify the source or at least a common node of intersection, as was the case in the German EHEC outbreak in 2011 (Askar et al., 2011; Buchholz et al. 2011). The challenging point is the acquisition and structuring of the trading data. Trading information stems at best from well-designed company databases or at worst from heterogeneous paper delivery receipts and invoices. The approach developed during the STEC O104:H4 outbreak event 2011 in Germany is based on Excel sheet templates with product and trading information connected to a new central database structure. This combination guarantees that data providers—mainly local authorities—are able to supply necessary information electronically, as Excel is in widespread use and is familiar to most users. The final structure of the Excel template (e.g., trading connections represented as triads—i.e., one step back, one step forward) was designed according to Regulation No. 178/2002 (European Commission, 2002). It accelerates information gathering, as both trace-back and trace-forward information are acquired simultaneously with just one request of the food business operator. This is especially important in saving time during disease outbreaks. To compensate for the disadvantages of Excel-based information exchange (manual data input is time consuming and error-prone), a new database infrastructure has been developed that supports data correction and integration. The method presented here—using software products that are free of charge—proved to be quick and effective. Available information was automatically double-checked and analyzed immediately. The proper identification of the origin and vehicle of an outbreak is essential for a timely response (i.e., mitigation or recalls) during foodborne disease outbreaks. It took approximately 3 weeks, including data gathering, to develop and implement the tool. The collection of data from one retailer, for example, took about 1–3 days.
Due to network complexity, size, and number of nodes, it was not possible to visualize all information manually (e.g., on a flipchart or pinboard). The newly developed tools helped to quickly and promptly visualize all connections between suppliers of interest. This permitted easy communication of results to all people involved in the outbreak investigation.
Once the validated data are entered in the database, they may be used as prerequisite for all kinds of analysis, visualization, risk assessment, and epidemiological investigations. The database solution presented here provides interfaces in the form of different export file types, which can easily be used by other software for further analysis.
In general, additional problems are faced in tracing individual lots. Lot numbers or product names may change along the supply chain. Even the composition may change by product processing, conversion, or addition to other distributed products. Thus, a correct attribution of the product and the corresponding lots and amounts of the different raw materials used to generate the product is necessary for exact trace-back and trace-forward. However, the data structure presented here still misses information on the mixture ratios between different ingredients in the product, which should be considered in the future. Furthermore, it would be helpful for risk assessment to have, firstly, additional information on the intended use of the products on each stage of the supply chain (including further processing). Secondly, it would also be beneficial to have a classification of operators into kind of business (e.g., producer, consumer, retail, wholesale, gastronomy). In future data structures, we recommend accounting for this information.
For general applicability, the question arises as to whether network analysis can provide sufficient evidence for identification of an outbreak source in the absence of microbiological confirmation and if the retrieved trade data is not as abundant as in the case of the STEC outbreak of 2011. On a qualitative level, investigators should then try to assess the completeness and possible biases of the available trade data. It should be ensured that retrieval and analysis of trace-back data is continued even after identification of the first common source if there is still a plausible chance that other sources may as well explain the observed outbreak pattern. On a quantitative level, outbreak-related trade data could be analyzed in combination with more complete trading data generated in “peace time.” It can be anticipated that statistical significance tests for identification of a single source on the basis of more complete trading data requires additional assumptions (or data) regarding the homogeneity of the pathogen in the food matrix and consideration of survival and growth of the pathogen as features assigned to both nodes and edges of the trading network.
Another lesson learned is that outbreaks do not stop at administrative borders. During the STEC outbreak, a high level of coordination of tracing and other activities was achieved by holding daily telephone conferences. There is a clear need for data sharing of the involved responsible authorities at the regional, national, and international level.
Conclusion
The trading data collecting and analyzing system developed during the STEC outbreak period proved to be effective in summarizing a large amount of complex trade data and identifying a common link of all outbreak clusters for which data were available. Thus, the successful control of the outbreak can be also attributed to this tool, which was developed in real-time. It is applicable to all kinds of food products, and it proved to be manageable in national as well as in international outbreak investigations. It is particularly useful in large outbreak situations, where the network of involved food producers and distributors is highly complex. Without electronic tools, it would be exhausting and error-prone to analyze complex trading networks.
Therefore, based on the concepts developed and experiences earned during the STEC O104:H4 outbreak in Germany in 2011, a generic methodology of trace-back investigations that is appropriate in different disease outbreak situations should be further developed. Appropriate data acquisition systems should be implemented at all responsible levels in the near future. Such data acquisition systems might either be online accessible databases or a two-step system consisting of data acquisition sheets importable into a centralized database, similar to the tool presented here. We additionally recommend using the triad structure for information gathering in any future data acquisition system to reflect general trading relationships of the business operator, which would accelerate information flow.
Footnotes
Acknowledgments
We thank the German Task Force EHEC, the Robert Koch Institute (RKI), the competent authorities of the federal states (especially Lower Saxony, Schleswig-Holstein, Mecklenburg-Western Pomerania, North Rhine-Westphalia, and Hessen), and Federal Office of Consumer Protection and Food Safety (BVL) for collecting and providing the German data, and EFSA for collecting and providing the European data. We thank all involved staff at the Federal Institute for Risk Assessment supporting the outbreak investigation. Work was funded by the Federal Institute for Risk Assessment.
Disclosure Statement
No competing financial interests exist.
References
Supplementary Material
Please find the following supplemental material available below.
For Open Access articles published under a Creative Commons License, all supplemental material carries the same license as the article it is associated with.
For non-Open Access articles published, all supplemental material carries a non-exclusive license, and permission requests for re-use of supplemental material or any part of supplemental material shall be sent directly to the copyright owner as specified in the copyright notice associated with the article.