
Abstract
Norovirus (NoV) are increasingly important as etiological agents of gastrointestinal infections. Consumption of bivalve molluscs and ready-to-eat fishery products is one of the most common ways of acquiring NoV foodborne infections, and the rise of outbreaks of viral gastroenteritis represents an important health problem that is also responsible for economic losses. The aim of this work was to define the prevalence of NoV contamination in preserved fishery products and in shellfish commercialized in Italy, taking into account the results obtained during 9 years of survey (2003–2011) and paying special attention to the regions more involved in national production. A total of 4463 samples were examined (2310 mussels, 1517 clams, 510 oysters, 22 other shellfish species, 104 preserved seafood products) and the average positivity rate for NoV presence was 4.1% and ranged from 0.6% in 2007 to 9.8% in 2003 and from 1.9% in preserved seafood products to 4.7% in mussels. Genetic characterization of circulating strains showed a prevalence of genogroup II genotypes, including GII.b and GII.e polymerase types and different GII.4 variants. This information could contribute to the optimization of risk-based sampling strategies for NoV contamination in seafood, taking into account variability in different species and from year to year.
Introduction
I
NoV can easily contaminate food, because they are ubiquitous and highly infective. Foodstuffs can be contaminated at their source, as in the case of shellfish harvested in polluted seawater, fruits and vegetables irrigated with contaminated water, or contaminated drinking water. Less than 100 particles are enough to cause infection and gastroenteritis (Koopmans et al., 2002). Among food at risk of contamination, the attention is mainly focused on shellfish. Bivalve molluscs feed by filtering particulate matter from the large volumes of water passing over their gills. During this natural process, they may retain and concentrate in their bodies bacteria and viruses eventually present (Croci et al., 2005) up to 1000-fold higher levels than the surrounding waters (Love et al., 2010). They are primarily considered responsible for viral transmission to humans, especially if eaten raw or slightly cooked.
Italy is the third main European producer of bivalve molluscs, with an average of 100,000 tons per year. Italy is also the leading European producer of clams (Tapes philippinarum) with 40–50,000 tons per year. Among all Italian regions, Veneto is the leading producer of clams and mussels, generating 80% and 40%, respectively, of national production (Corrain et al., 2007). Significant levels of production, although characterized by lower amounts, are also present in Emilia Romagna, Friuli Venezia Giulia, Liguria, and all the other coastal regions (Fig. 1). However, in relation to the strong domestic demand for fresh produce, products are frequently imported.
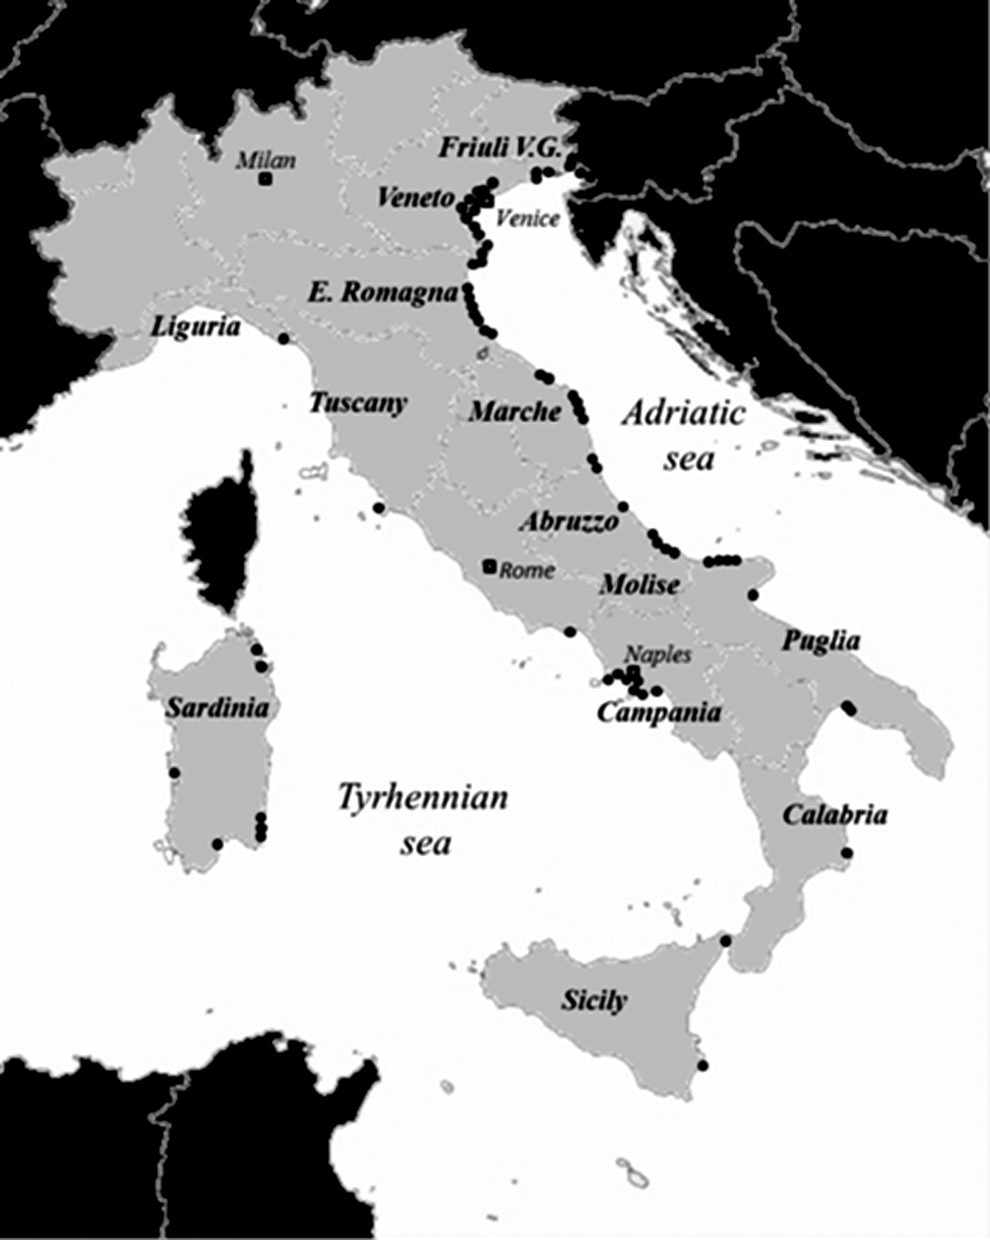
Geographical distribution of shellfish harvesting areas. The main number of dots is located along the Adriatic Sea. Source: Ministero delle Politiche Agricole e Forestali—L'acquacoltura Report.
The aim of this work was to describe the prevalence of NoV contamination in processed seafood products and in shellfish commercialized in Italy, taking into account the results obtained in the last 9 years through the surveillance carried out by the National Health System laboratories on marketed shellfish, production areas, and preserved fishery products, and paying special attention to the regions more involved in national production. Prevalence variability along 9 years and in different shellfish species was estimated in order to supply information for risk evaluation, and molecular characterization of circulating strains was performed.
Materials and Methods
Sampling
In the period 2003–2011, 4463 samples of seafood products, collected on the market or from shellfish production areas designed for direct human consumption (class “A” areas according to Reg. EC 853/2004), were analyzed. Samples included 2310 mussels (Mytilus galloprovincialis, Mytilus edulis), 1517 clams (Tapes spp., Callista chione), 510 oysters (Crassostrea gigas, Ostrea edulis), 22 minor species specimens (Ensis minor, Ensis ensis, Murex spp., Pecten jacobaeus, Tellina spp., Agropecten purpuratus, Chamelea gallina, Glycimeris spp., and Venus verrucosa) and 104 samples of preserved fish salads, fish fillets, fresh or frozen fish, squids, shrimps, and prawns (Table 1). Among the analyzed samples, 86.7% were domestic (n=3869), while 13.3% (n=594) were imported. About half of domestic samples were harvested in Veneto region (Adriatic sea), while the remainder was collected in Emilia-Romagna, Liguria, and other major coastal regions such as Marche, Puglia, Campania, Sardinia, and Sicily (Fig. 1).
Samples included in-oil fish salads, fish fillets, fresh or frozen fish, squids, shrimps, and prawns.
Samples included Ensis minor, Ensis ensis, Murex spp., Pecten jacobaeus, Tellina spp., Agropecten purpuratus, Chamelea gallina, Glycimeris spp., and Venus verrucosa.
Sample preparation
Samples collected from 2003 to 2007 were prepared according to a previously published protocol (De Medici et al., 2001). Briefly, 75 g of homogenate was diluted 1:2 in glycine buffer (0.05 M, pH 9.2; Sigma, St. Louis, MO), stirred for 30 min, and centrifuged at 10,000×g for 15 min at 4°C. The supernatant was collected and pH adjusted to 7.2. After two precipitations with polyethylene glycol (PEG8000, Sigma) 50% wt/vol solution in 7.5% NaCl, the suspension was stirred overnight at 4°C and centrifuged at 10,000×g for 45 min at 4°C. The pellet was resuspended in 3 mL of phosphate-buffered saline (PBS) (Oxoid) and centrifuged at 10,000×g for 10 min at 4°C. The supernatant was extracted twice with 30% chloroform (Carlo Erba Reagenti, Milan, Italy), and the final volume was adjusted to 3 mL with PBS.
Samples collected after 2007 were prepared according to a standardized method (Lees et al., 2010; CEN/WG6/TAG4, 2010). Shellfish digestive gland was extracted from the body, finely chopped, and 2 g were transferred into one 15-mL tube. Fish and other fish products were ground before weighing. Two milliliters Proteinase-K (0.1 mg/mL) was added and the solution was vortexed. After 1 h incubation at 37°C with shaking, the sample was incubated at 60°C for 15 min. The tube was then centrifuged at 3000×g for 5 min and supernatant was transferred into a new tube. Sterile PBS was added up to 3 mL final volume and solution was retained for RNA extraction.
Viral RNA extraction and reverse transcription
RNA was extracted from 1 mL of sample solution with QIAamp UltraSens Virus kit (Qiagen, Hilden, Germany) or from 500 μL of sample using the MiniMag NucliSens Magnetic Extraction kit (bioMerieux, France) following the manufacturers' instructions. cDNA was obtained by using random hexamers primers and MuLV reverse transcriptase (Applied Biosystems-Roche, Basel, Switzerland); reverse transcription was performed on 6 μL of RNA for 1 h at 42°C, and 5 min at 94°C.
Booster-polymerase chain reaction (PCR), real-time PCR, sequencing
Samples collected from 2003 to 2007 were analyzed using a conventional, double-round PCR (booster-PCR) while, following analytical methods improvements, from 2008 a one-step real-time PCR with separate amplifications for genogroup I (GI) and genogroup II (GII) was adopted and booster-PCR was used for sequencing purposes.
Booster-PCR was performed using a pair of specific primers for the RNA-dependent RNA-polymerase region previously described (Vinjè et al., 1996; De Medici et al., 2007): 5'-JV12Y=ATA CCA CTA TGA TGC AGA YTA-3' and JV13I=5'-TCA TCA TCA CCA TAG AAI GAG-3 '(I=inosine, Y=C/T). The temperature profile was 5 min at 94°C, and 30 s at 94°C, 90 s at 37°C, 60 s at 72°C for 40 cycles, both for the first and the second amplification. PCR products (expected 326 bps) were analyzed on 2.5% agarose gel and confirmed by hybridization (Bergmans et al., 1995; Vinjè et al., 2000). Amplicons were purified with the QIAquickGel Extraction Kit (Qiagen), sequenced on both strands by the BigDye Terminator Cycle Sequencing Kit (v2.0, Applied Biosystems). Sequences were compared in BLAST (
Real-time PCR was performed according to the protocol described in Da Silva et al. (2007). PCR probes were specific for GI and GII NoV detection, and primers were located at the ORF1-ORF2 junction (Kageyama et al., 2003; Loisy et al., 2005; Da Silva et al., 2007; Svraka et al., 2007). Reactions were performed using the ThermoScript/Platinum reverse transcriptase (RT)-PCR one-step kit (Invitrogen, Carlsbad, CA). The thermal profile was 30 min at 50°C (reverse transcription), 5 min at 95°C, followed by 15 s at 95°C, 1 min at 60°C, and 1 min at 65°C for 45 cycles. A sample's extraction control (Mengovirus) and a PCR inhibition control (synthetic RNA) were applied in each determination according to Da Silva et al. (2007) and results were considered acceptable if process control was recovered from samples and no inhibition was detected in PCR.
Statistical analysis
The results obtained from the different seafood matrices were compared between each other using the Fisher's exact test (R Software 2.4.0).
Results
Of the 4463 fishery products examined during the 9 years of monitoring, 183 positive samples were detected (4.1%) (Table 1). The positivity rate during the course of the study ranged from a minimum of 0.6% (2007) to a maximum of 9.8% (2003), with no evident trend emerging. With regard to the different matrices tested, 109 of the 2310 mussel samples (Mytilus spp.) tested positive (4.7%), while the percentage of positive samples was 3.8% for clams (Tapes spp.) and 2.4% for oysters (Crassostrea and Ostrea genera). A statistically significant difference between contamination frequency of the matrices was detected only when comparing mussels and oysters results (p=0.0154). Contamination was detected also on other species sporadically tested (one Chamelea gallina and one Glycimeris spp. sample) as well as among canned/preserved seafood products (one in-oil squid and one tomato-clams sauce sample, equivalent to 1.9% of the samples of this category). Five of the 594 imported products (0.8%) tested positive (data not shown).
In the 23 samples genotyped in 2003 (Table 2), four different genotypes were detected (14 GII.1, 6 GII.2, 2 GII.4, and 1 GII.8), while the year 2004 was characterized by the prevalence of GII.b genotype, which was identified in all the positive samples. In 2005 and 2006, strains belonging to the GII.4 cluster were mainly detected, alongside with GII.b (respectively 14 and 3 isolates in the biennium), while in the period from 2003 to 2007, in concomitance with the use of conventional PCR, only GII-positive samples were detected. Starting from 2008, contamination with GI and simultaneous GI+GII contaminations also were observed (Table 1). In 2008, 21 samples tested positive by real-time PCR; two samples were GI positive; 13 were GII and 6 showed the presence of GI+GII. Of these, 11 were characterized and included, beside a GI.3 strain, two genotype GII.4var2006a, five genotype GII.4var2006b, as well as three other GII.4 strains for which a variant could not be identified. Similar distributions were also found in 2009 (two GI, 35 GII, and nine samples contaminated both by GI and GII), 2010 (31 GII and 12 GI+GII), and 2011 (4 GI, 7 GII and 1 GI+GII), with GII.4var2004 and GII.4var2006b circulating together with GII.e in 2009 and with GII.b in 2010.
Conventional double-round polymerase chain reaction (PCR).
Real-time reverse transcriptase-PCR.
n.d., no genotype detected.
No., number of genotyped samples.
Discussion and Conclusions
The results of the 9-year monitoring on seafood products marketed in Italy showed the presence of NoV on average in 4.1% of the collected samples, including fishery products of different kinds (live bivalve shellfish and processed foods) and origin (domestic and imported). These results agree those reported from studies conducted in other countries on commercial products (United States: 3.9% of samples; The Netherlands: 4.8% in shellfish of national origin [De Paola et al., 2010; Boxman et al., 2006]), but are substantially lower than those previously obtained in a small-scale survey on markets and restaurants in an Italian region (Pepe et al., 2012).
Significantly, and independently from the analytical method adopted, viral contamination was detected throughout the whole 9-year period of monitoring, demonstrating the constant circulation of the virus in the environment, although at different levels. The prevalence of contamination was indeed quite variable along the years of monitoring, ranging from low values (e.g., 0.6% in 2007 or 1.2% in 2011) to considerable levels, as 9.8% in 2003 or 7.6% in 2010. Such fluctuations may be related in a certain degree to sampling factors, including the variable contribution to the multiyear sampling plan of shellfish production areas with different contamination frequencies and the different distribution of species and seafood products in the samples analyzed each year. Previous studies conducted in Italy at a regional level also showed a certain variability among the contamination frequencies from enteric viruses in shellfish grown and harvested in production areas in the Northern Adriatic Sea, Southern Adriatic and Tyrrhenian Seas (Croci et al., 2000; De Medici et al., 2001; Croci et al., 2007; Pepe et al., 2012), and variability in contamination frequency on a geographic basis was also detected in other countries (De Paola et al., 2010). However, the changes in the contamination frequency of seafood products during the course of the study may also reflect that levels of virus dispersion and presence in the environment are not uniform. Epidemiology studies of European NoV outbreaks, in fact, highlighted the unequal size of yearly seasonal peaks (i.e., number of outbreaks reported in the period of observation), with certain years including a much larger number of outbreaks than others (Kroneman et al., 2008). Such trends of NoV gastroenteritis in the population might cause virus shedding in different degrees and lead to a variable contamination of food products collected from the impacted environment.
With regard to the distribution of NoV among the different kinds of seafood tested, the results highlighted a higher prevalence of contamination in mussels with respect to the other species, although a statistically significant difference was detected only in comparison with oysters. These data are not in agreement with the results of a previous survey, which indeed reported interspecies variability in contamination frequencies but identified clams as the species most frequently contaminated (Suffredini et al., 2008). This study, however, is to our knowledge the first one comparing extensively the contamination in different shellfish species (more than 2300 samples for mussels, clams, and oysters), and accounting for the variability over years, different national areas, and cultivation procedures (e.g., harvesting from lagoon sand versus rope-grown or floating cage cultivation in open sea), which expose molluscs in different levels to fecal contamination sources. Furthermore, since 2008, data were gathered with the use of a validated real-time RT-PCR protocol, which ensured high sensitivity and specificity of detection, as well as enhanced comparability of results with other national surveys; such data could therefore contribute to the continuous update of the technical documents concerning viral hazard in food (e.g.,
Characterization of positive samples highlighted the simultaneous circulation of GI and GII strains in seafood samples. Although the first period of the monitoring revealed only GII strains, probably in relation to the limits of the conventional amplification system (Lees et al., 2000; De Medici et al., 2004; Lopman et al., 2004), since the application of real-time RT-PCR, GI contaminated samples or simultaneous contamination by GI and GII strains were frequently detected. These results on GI circulation are in agreement with previous studies (Suffredini et al., 2012) and confirm the data of other authors on shellfish, where multiple contamination is frequently detected also in outbreak-implicated samples (Le Guyader et al., 2012). These results should be taken into account when establishing microbiological criteria for NoV and, as suggested by the scientific community, in the absence of an accurate dose–response evaluation for each genogroup, a criterion considering the “total” NoV load should be defined (EFSA, 2012).
Besides genogroup distribution, strain characterization also confirmed the predominance of GII.4 cluster in seafood samples as in clinical cases (Bull et al., 2006; Kroneman et al., 2008; Greening et al., 2012); where identification was possible, however, the variants detected in food samples did not strictly follow the same epidemiological trends reported in clinical cases, with GII.4var2004 and GII.4var2006, for example, still detectable years after their peak in human outbreaks. This might be due to a prolonged persistence of NoV strains in the environment (e.g. in association with sediments [Smith et al., 1978]) as well as to the higher affinity of the conventional PCR degenerate primers toward certain sequences. Interestingly, seafood samples also confirmed the wide circulation of genotype GII.b, which is one of the non-GII.4 genotypes most commonly detected in European outbreaks (Kroneman et al., 2008) and is frequently detected in Italy, both in hospital surveillance (Colomba et al., 2007), outbreak investigations (Rizzo et al., 2007), and environmental analysis (La Rosa et al., 2007). Furthermore, sequencing also detected the presence of rarer genotypes, such as GII.8 and GI.3, as well as the circulation of the GII.e polymerase genotype, which was never reported before in Italy, and whose associated recombinant viruses seem to have superseded GII.b recombinants in 2009 (Mathijs et al., 2011).
Finally, special attention should be drawn to the results obtained on canned/processed foods (1.9% of positive samples). Because NoV infectivity cannot be tested, positive results on canned and/or heat-treated samples might represent the detection of heat-damaged, noninfectious viruses. However, if viruses are present in raw materials, depending on the type of treatment applied and on the physical characteristics of the food matrix, residual viral infectivity may be present after some industrial processes (Koopmans et al., 2004).
This study, despite the limitations related to the heterogeneity of sampling, provided a clear indication of the potential risk associated with the presence of NoV in seafood matrices and, confirming the inadequacy of current microbiological criteria for commercialization of shellfish, demonstrated the need, as affirmed in EC Regulation 853/2004, to “lay down additional health standards for live bivalve molluscs…including virus testing procedures and virological standards” (Reg EC N. 853/2004). Furthermore, this information, which could be additionally upgraded with the acquisition of quantitative data (i.e., genome copies of virus per gram), could contribute to the optimization of risk-based sampling strategies for NoV contamination in seafood, taking into account variability in different species and from year to year.
Footnotes
Disclosure Statement
No competing financial interests exist.