
Abstract
The European Union Reference Laboratory for Listeria monocytogenes (EURL for Lm) coordinates a European network of 35 National Reference Laboratories (NRLs), most of which perform food, environmental, and veterinary Lm strain surveillance in their respective countries. The EURL activities resulted in the recent creation of a database (EURL Lm DB). Typing and related epidemiological data submitted to the EURL Lm DB will be collected and shared by all the NRLs. For a given NRL, the only criterion required in order to submit pulsed-field gel electrophoresis (PFGE) profiles to the database was the successful participation with at least one EURL PFGE and PFGE profile interpretation Proficiency Testing (PT) trial. In this context, the EURL organized a PT trial in 2012 to evaluate the NRL's ability to perform PFGE and profile interpretation. A total of 18 NRLs took part in this study. Upon request from the Food- and Waterborne Diseases and Zoonoses Programme of the European Centre for Disease Prevention and Control, 10 National Public Health Reference Laboratories (NPHLs) also took part in this PT trial. Of the 28 participating laboratories, 16 obtained results classified as “good” or “satisfactory.” These 16 laboratories included 10 NRLs (56%) and 6 NPHLs (60%). Of the 22 NRLs and NHPLs that participated in the part of the PT trial related to PFGE profile interpretation, 11 laboratories obtained good results. These 11 laboratories included eight NRLs, which therefore can now submit profiles to the EURL Lm DB. This PT trial provided a valuable opportunity to facilitate and to stimulate the sharing of reproducible PFGE profiles between human and food reference laboratories.
Introduction
T
EURL activities have resulted in the recent creation of a database (EURL Lm DB) set up by the EURL and eight NRLs, and supported by the European Centre for Disease Prevention and Control (ECDC) and the European Food Safety Authority. The data submitted to the EURL Lm DB (serotyping, PFGE, and related epidemiological data) will be provided and shared by all NRLs. However, NRLs must be considered competent for PFGE typing before they can submit PFGE profiles to the database in order to ensure their quality. The NRLs, when participating in a PFGE PT trial, can be assessed on their ability to obtain high-quality PFGE profiles.
The close collaboration between the ECDC and the EURL will enable the exchange of molecular typing data (e.g., in the frame of the ECDC European Listeria Typing Exercise) project. This project aims to compare typing results from human strains with those obtained from food isolates that have been collected as part of the European coordinated monitoring program on the prevalence of Lm in certain ready-to-eat food categories at retail in EU Member States (EC Decision 2010/678/EU), in 2010–2011. In this study, the National Public Health Reference Laboratories (NPHLs) and the NRLs were encouraged to perform PFGE themselves. In this context, it is relevant to evaluate the ability to perform high-quality PFGE profiles for NPHLs and NRLs participating in this joint study.
For the NPHLs, the last PFGE PT trial was organized in 2003 in the frame of PulseNet Europe's activities (Martin et al., 2006). For the NRLs, the EURL organized two PT trials in 2009 and 2010 (Félix et al., 2012b). However, as these PT trials were focused on the PFGE protocol, the NRLs did not yet have the opportunity to be evaluated on their ability to interpret the PFGE profiles, according to the SOP (Félix et al., 2012a).
In this context, in 2012 the EURL organized a PT trial to assess the ability of NRLs to perform PFGE and PFGE profile interpretation. A total of 18 NRLs took part in this study. Upon request of the Food- and Waterborne Diseases and Zoonoses Programme of the ECDC, the PFGE performance of 10 NPHLs was also evaluated. The NRLs and NPHLs had the choice of whether or not to interpret the PFGE profiles.
Materials and Methods
Bacterial strains
The panel consisted of 10 strains: eight food strains and two strains isolated from clinical cases (Table 1). Three strains—5, 6, and 7—were selected, since most of the failures occurred for these strains during the 2009 PT trial (Félix et al., 2012b). Strain 10 was tested in duplicate (not shown in Table 1 or Fig. 1). Strains 1 and 2 were epidemiologically related (McLauchlin et al., 1991; Bille and Rocourt, 1996). The remaining strains were unrelated.
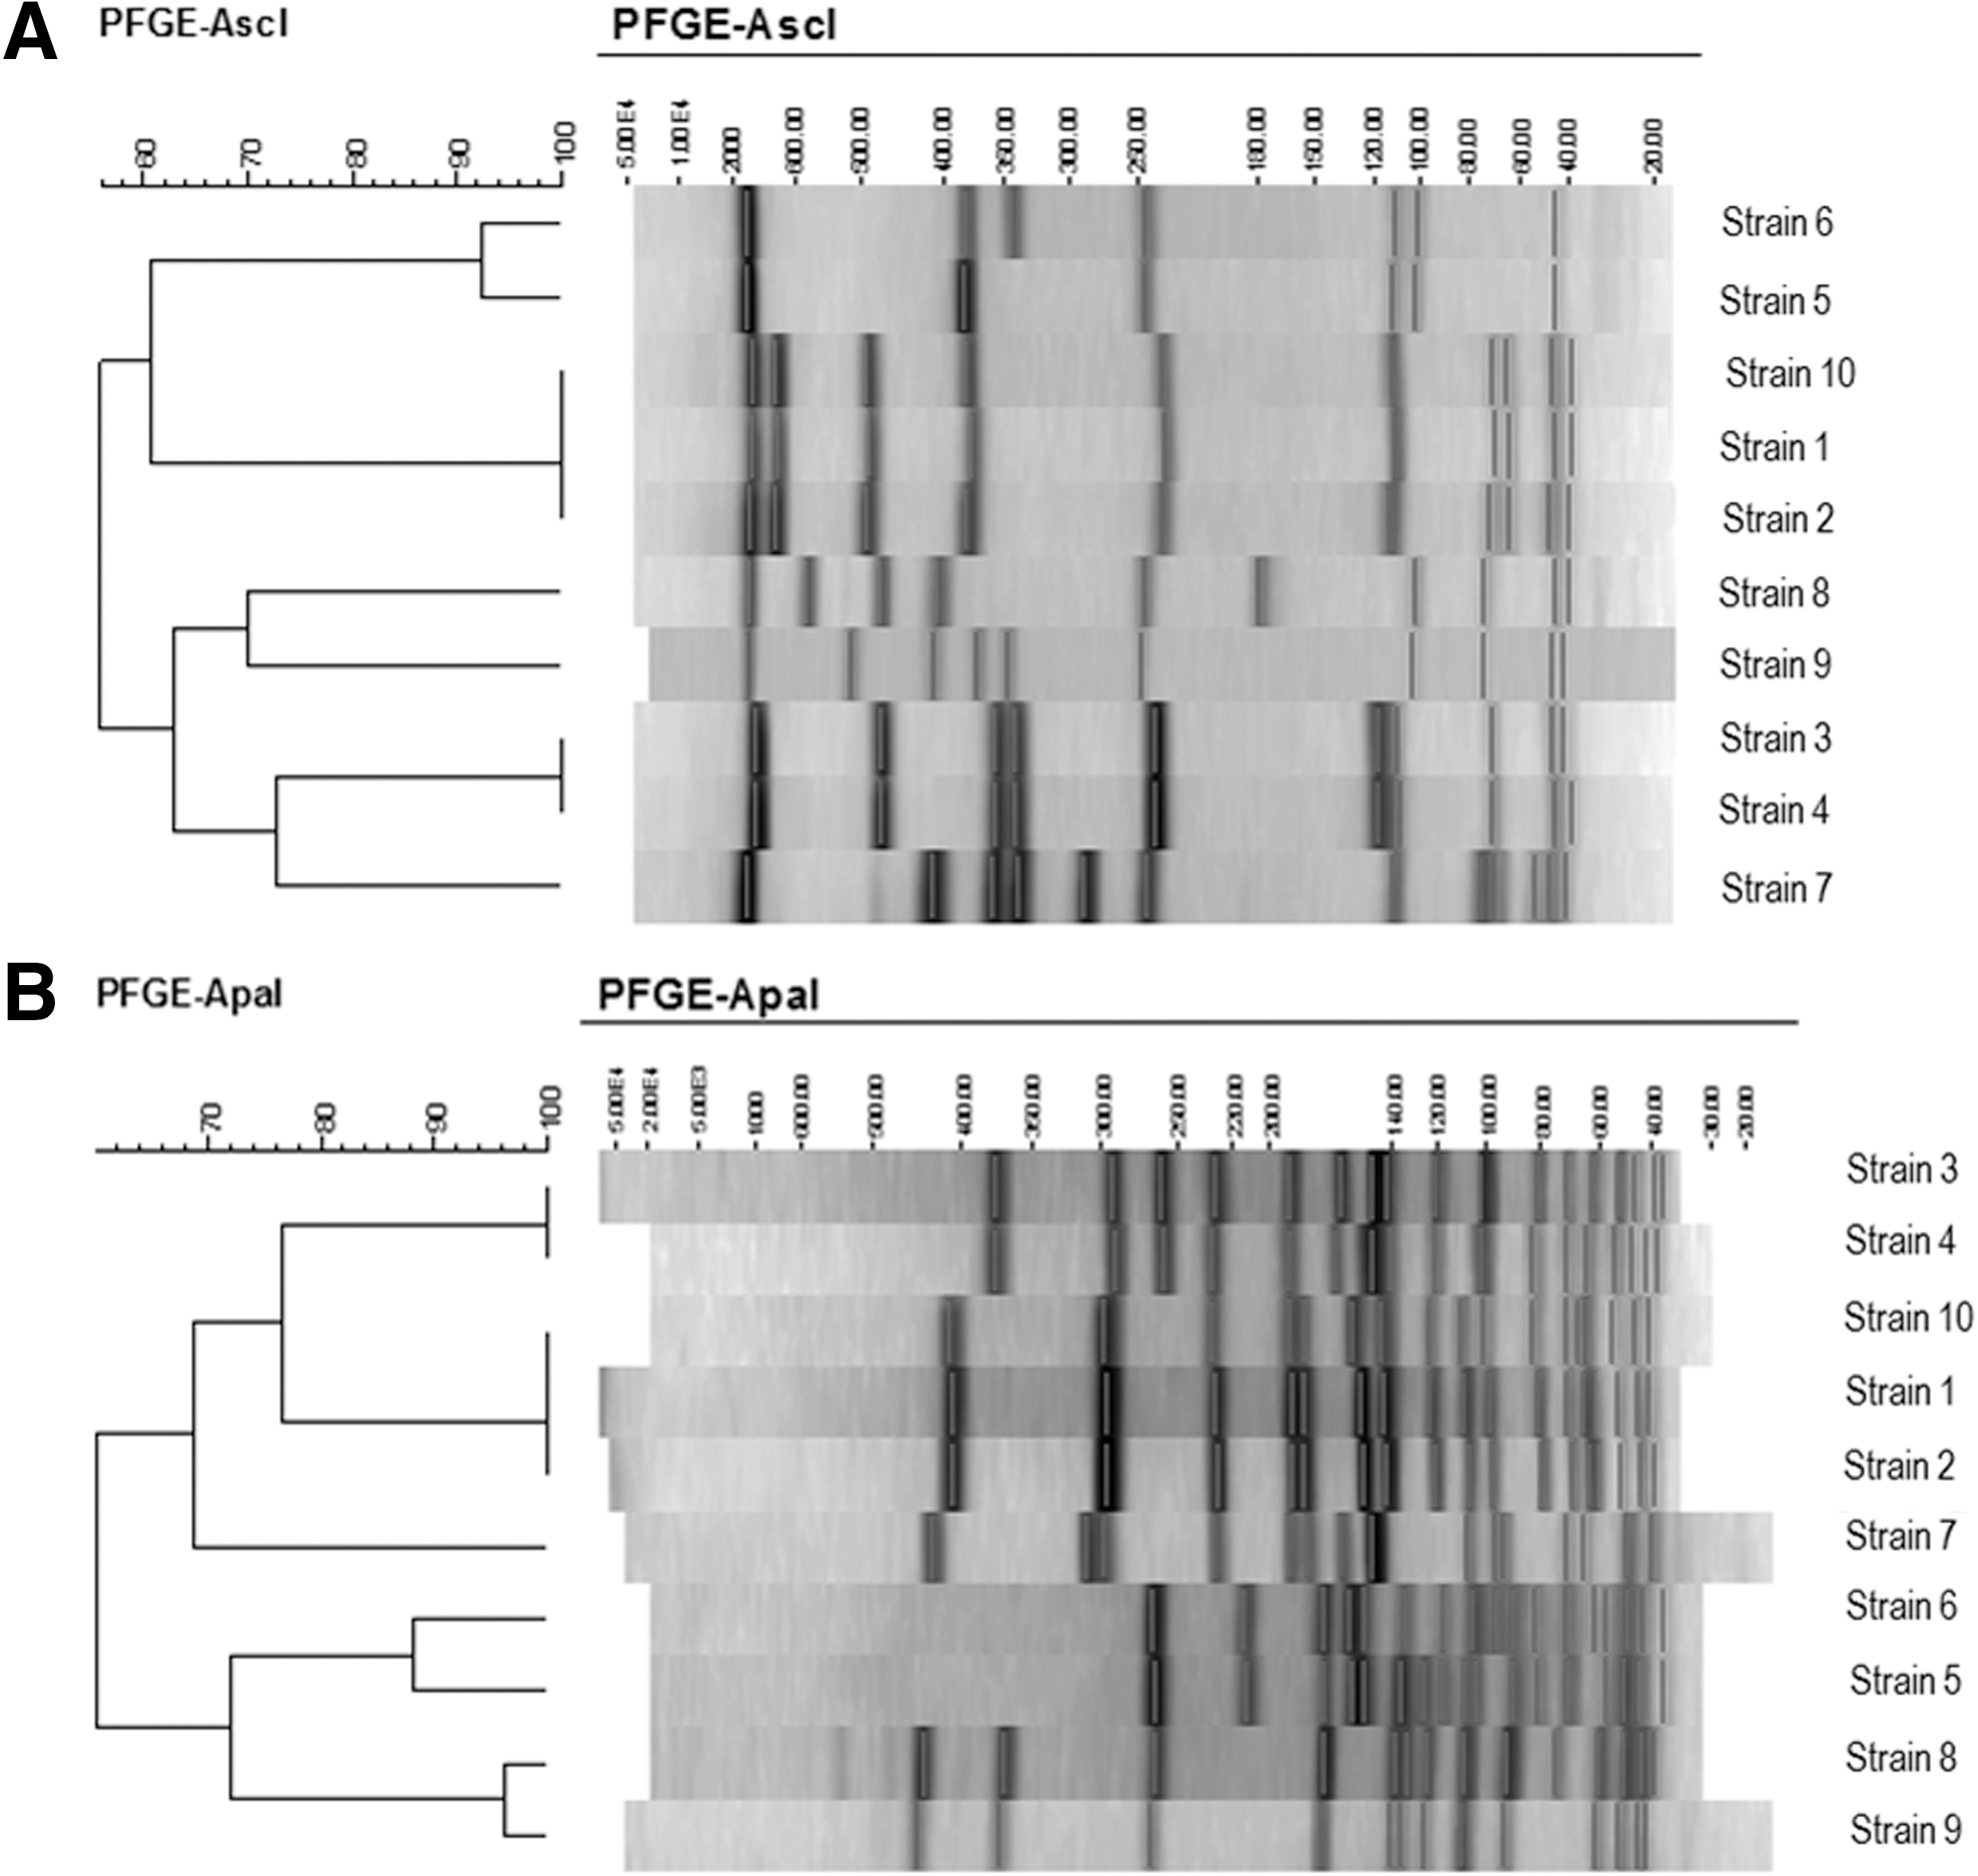
Similarity dendrograms for 10 distinct AscI
Strains related to the same epidemiological group (Bille and Rocourt, 1996).
Strain common to the PT trial strain panel 2009 and 2010.
Strain analyzed in duplicate during the study.
CEB, Unit Bacterial Characterization and Epidemiology.
All the strains, referenced with a CEB (Unit Bacterial Characterization and Epidemiology) Bacterial collection number, were food strains, previously collected from French food laboratories and sent to the EURL, in the context of monitoring or research projects. The strains labeled TS (“Test Study”) were previously used in the World Health Organization international multicenter Lm typing study (Bille and Rocourt, 1996; Brosch et al., 1996; Schonberg et al., 1996) (Table 1). Seven distinct ApaI and AscI PFGE profiles characterized the strain panel (Fig. 1).
PFGE intralaboratory repeatability
Duplicated strain 10 was included to assess PFGE repeatability within the same laboratory.
NRL evaluation to perform PFGE over 3 following years
The three strains 5, 6, and 7, present in the PT trial strain panels of both 2009 and 2010 (Félix et al., 2012b), were included to follow the NRLs' ability to perform PFGE typing over 3 successive years.
PFGE epidemiological concordance
The epidemiological concordance of PFGE was assessed by PFGE capacity to recognize the homogeneity of strains 1 and 2 (McLauchlin et al., 1991; Bille and Rocourt, 1996) within the same epidemiological group, within the same laboratory.
PFGE protocols
For PFGE, the EURL recommended that the NRLs and NHPLs use the EURL PFGE protocol (Félix et al., 2012b). However, each participant had the choice of using either this protocol or another PulseNet-based protocol (Halpin et al., 2010). Information on the parameters set by the EURL and those left to the discretion of the laboratories were described in Table 2.
All of the parameters were reported by the participants.
Eight parameters were set by the EURL: (1) agarose concentration: 1%, (2) agarose type: Lonza Seakem Gold agarose, (3) switch time ramping: 4 s–40 s, (4) pulsed-field gel electrophoresis (PFGE) system: CHEF DRIII or equivalent, (5) buffer temperature: 14°C, (6) voltage: 6 V, (7) reference system Salmonella Braenderup H9812 every six wells, (8) pulsed-field angle: 120°. The type of Tris borate EDTA (TBE) buffer was recommended but not required. The participants were also asked to send the gel images to the EURL in the TIF file format. All the other parameters were not set by the EURL. Experimental settings, supplier, and batch number were reported to the EURL by each participating laboratory for: lysozyme, proteinase K, restriction enzymes, TBE buffer, migration time, amperage at the start and at the end of the migration, gel image system, and processing software.
For PFGE profile interpretation, the EURL recommended using its SOP (Félix et al., 2012a), based on the interpretation method developed by (Barrett et al., 2006) and the PulseNet USA PFGE profile interpretation SOP. The participants could choose whether or not to interpret their PFGE profiles. They were asked to send their PFGE profiles in xml format.
Interpretation of laboratory results by the EURL
Evaluation of the participants' PFGE results by the EURL, based on tif images
PFGE profile analysis was performed using BioNumerics software (V6.6, Applied Maths, Kortrijk, Belgium) following the EURL SOP (Félix et al., 2012a). The EURL used all the criteria described in the SOP, except two gel quality criteria: (1) validation of doubtful bands in the upper part of the profiles, and (2) migration control of the Lm H2446 AscI profile (Félix et al., 2012a).
A similarity value was calculated comparing the NRL/NHPL tested profile and the EURL reference profile. A similarity limit of 99.99% was chosen to consider NRL profiles indistinguishable from the corresponding EURL reference profiles. Similarity values were calculated using the Dice coefficient, with tolerance and optimization parameters set at 1% as advised by PulseNet Europe (Martin et al., 2006). All profiles that were not indistinguishable from the EURL reference profile were considered as failed.
The profiles were analyzed independently of each other, and then compared to the profiles obtained by the EURL (reference profiles). Profiles that did not comply with the interpretation criteria were not interpreted and were considered as having a 0% match with the reference profile. The results obtained were classified into three categories: (1) a laboratory's results were considered “good” if all the profiles were indistinguishable from the reference profiles (similarity ≥99.99%); (2) a laboratory's results were considered “satisfactory” if only one AscI-PFGE profile or ApaI-PFGE profile had a similarity value of <99.99% as compared to the reference profile, for the whole panel; (3) in all other cases, results were considered “unsatisfactory.” A participant was considered competent for PFGE typing when its results were classified as “good” or “satisfactory.”
Evaluation of the participants' PFGE profile interpretation by the EURL, based on xml files
Seven main criteria and three optional criteria were used by the EURL to evaluate participants' ability to analyze gels and profiles (Table 3). These criteria were based both on the EURL SOP (Félix et al., 2012a) and the recommendations of the BioNumerics users' manual. The EURL considered NRL results as “good” if all profiles complied with the seven main criteria, and as “unsatisfactory” if the profiles did not comply with at least one of the seven main criteria. A participant was considered competent for PFGE profile interpretation when all its results were classified as “good.”
Active region: It delimits the region of interest of the gel: track and gel strips will be extracted within the active region.
Strip: each lane on the gel is delimited by a strip. The strip is a small image extracted from the complete file to represent a particular profile. The borders of these strips are represented as blue lines, or red for the selected lane.
EURL, European Union Reference Laboratory; SOP, standard operating procedure.
Results
PFGE typing results on the total strain panel
A total of 28 laboratories from 17 countries took part in this PFGE PT trial. Twenty-eight laboratories performed the combined (ApaI/AscI) PFGE analysis. Thirteen laboratories obtained good results, three laboratories obtained satisfactory results, and 12 laboratories obtained unsatisfactory results (Table 4). Sixteen laboratories were considered as competent for PFGE typing of Lm: 10 of 18 food NRLs (Fig. 2) and six of 10 human health NPHLs. Among the NRLs and NPHLs, the results were comparable in proportion (Table 4).
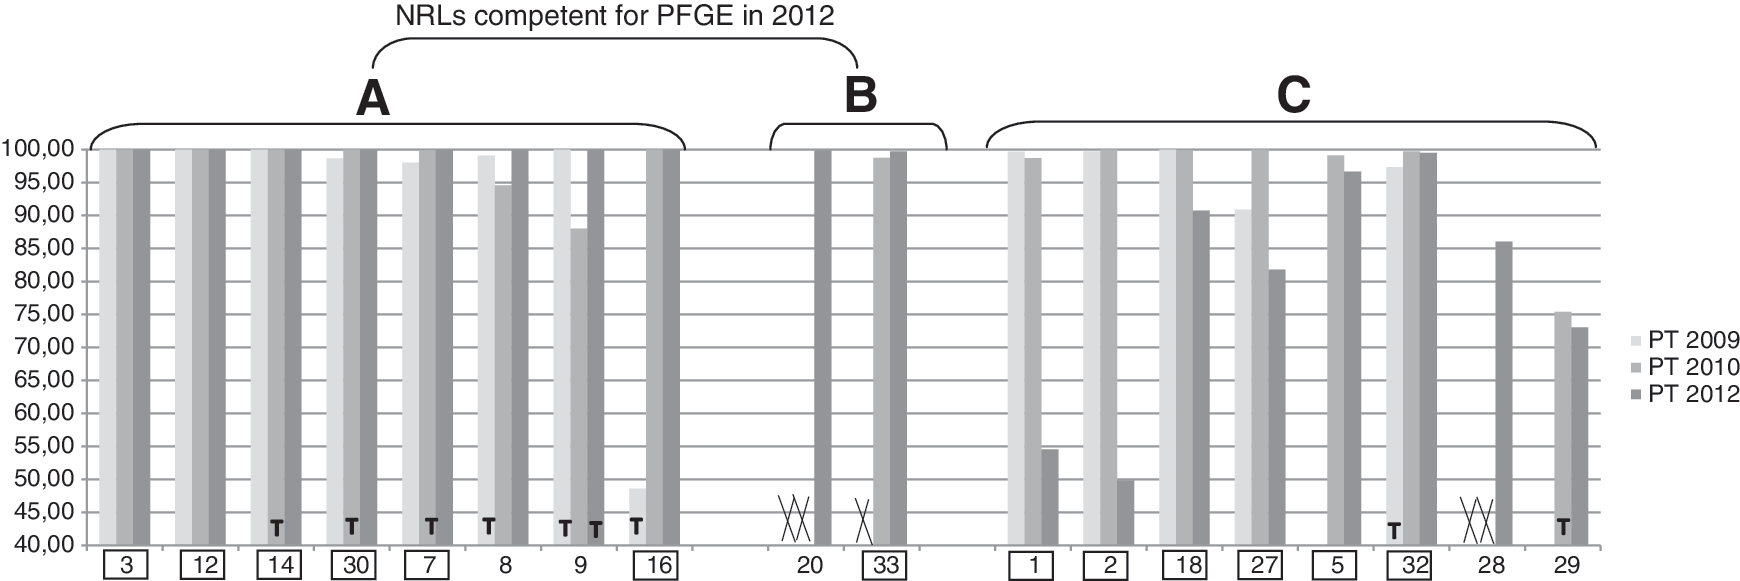
Overall results of the National Reference Laboratories (NRLs) for the three Proficiency Testing (PT) trials (2009, 2010, and 2012). Each bar gives the sum of the AscI and ApaI average similarity value. The letter “T” indicates NRLs trained in pulsed-field gel electrophoresis in the year preceding the PT trial. The crossed-out bars indicate NRLs that did not participate in the PT trial. NRLs that obtained good results in the 2012 PT trial are in group A. NRLs that obtained satisfactory results in the 2012 PT trial are in group B. NRLs that obtained unsatisfactory results in the 2012 PT trial are in group C. The lab numbers with boxes around them show the laboratories that obtained good or satisfactory results in the 2010 PT trial.
NRLs, National Reference Laboratories; NPHLs, National Public Health Reference Laboratories.
PFGE repeatability
Of 28 laboratories participating, 21 obtained interpretable profiles of strains in duplicate. Of these 21 laboratories, 18 found the profiles of strain 10 and its duplicate indistinguishable from the EURL reference (Table 5). For laboratory 4, one extra band was found on the ApaI profile of one of the duplicates. Two others (5, 29) obtained a deviation for the profiles of both of the duplicates.
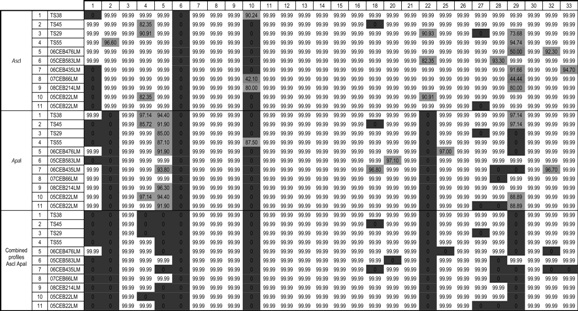
Values calculated from an unweighted-pair group method with arithmetic mean dendrogram using the Dice coefficient, with tolerance and optimization set at 1% between each laboratory-tested profile and the European Union Reference Laboratory (EURL) reference profile. All samples and laboratories are designated using a blind codification. White cells represent the results that agreed with the EURL reference profiles. Gray cells represent failed results. Dark gray cells represent poor-quality profiles that were not analyzed and are considered a 0% match.
PFGE epidemiological concordance
Eighteen laboratories found the profiles of strains 1 and 2 indistinguishable from each other and indistinguishable from the EURL references (Table 5). One laboratory found the profiles of the two strains different (18) (Table 5). However, this laboratory obtained a PFGE profile of strain 2 that was uninterpretable and consequently it could not really be compared. The laboratories that obtained uninterpretable profiles or deviations on both of the strains were not included in the comparison.
Evolution of NRL ability to perform PFGE over 3 successive years
Of the 10 NRLs considered as competent for PFGE in 2012, seven had successfully participated in the 2010 PT trial. One NRL (20) had not participated in the previous PT trials. Two NRLs (8, 9) failed in the 2010 PT trial but largely improved in 2012 (Fig. 2).
In 2012, nine NRLs (7, 8, 9, 16, 27, 3, 12, 14, 30) improved their results or remained stable between 2009 and 2012. Among the nine NRLs, six have been trained by the EURL for PFGE typing (Fig. 2). Of the 14 NRLs considered as competent in 2010, seven remained competent in 2012, one did not participate in 2012, and six failed (Fig. 2). NRL 29 failed in the three successive PT trials despite the fact that one staff member of this laboratory had been trained by the EURL for PFGE typing in 2009 (Fig. 2).
Sixteen NRLs tested the same three strains (5, 6, and 7) in 2012, 2010, and/or 2009 (Fig. 3). For four laboratories (3, 12, 14, 30), the combined profiles were indistinguishable from the EURL references in 2009, 2010, and 2012. For five laboratories (7, 8, 9, 16, 27), the results improved or remained indistinguishable from the EURL reference between 2009 and 2012. For five laboratories (1, 2, 18, 5, 32), the combined profiles were indistinguishable from the EURL references in 2009 or 2010 but not in 2012. For two laboratories (29, 33), at least one combined profile was different from the EURL reference for the last three PT trials (Fig. 3).
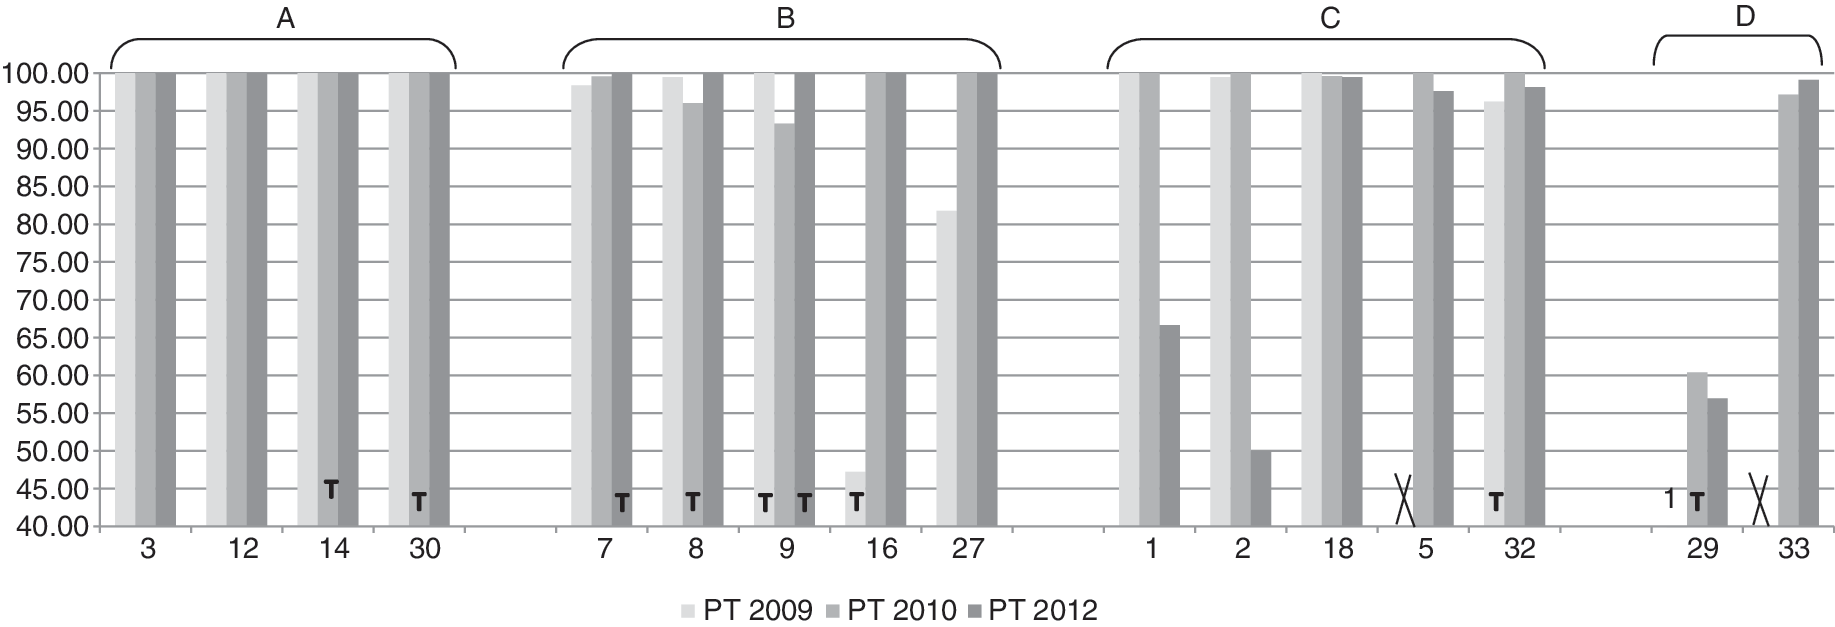
Results of the National Reference Laboratories (NRLs) for the same three strains (5, 6, and 7) in the Proficiency Testing (PT) trials for 2009, 2010, and 2012. Each bar gives the sum of the AscI and ApaI average similarity value obtained for the three strains. The letter “T” indicates NRLs trained in pulsed-field gel electrophoresis in the year preceding the PT trial. The crossed-out bars indicate NRLs that did not participate in the 2009 PT trial. The NRLs that remained stable and those that improved their results for the three strains from 2010 to 2012 are in groups A and B, respectively. The NRLs that failed for the three strains in 2012 but succeeded in the past are in group C. The NRLs that failed for the three strains in the PT trial they participated in are in group D. Superscript 1 indicates that Laboratory 29 obtained no profiles that were indistinguishable from the European Union Reference Laboratory reference in the 2009 PT trial.
Evaluation of PFGE profile interpretation participants based on xml files
Twenty-two of 28 laboratories interpreted the PFGE profiles they obtained themselves. Seventeen of 22 laboratories provided readable xml files. The five other laboratories (1, 5, 23, 28, 33) provided the xml files in an inappropriate data export format. Eleven of 17 laboratories obtained good results, and thus were considered competent for PFGE profile interpretation. These laboratories included eight NRLs and three NPHLs (Table 6).
NRLs, National Reference Laboratories; NPHLs, National Public Health Reference Laboratories.
Discussion
This PT trial included 28 laboratories, 18 food NRLs, and 10 human health NPHLs involved in the surveillance of food and human Lm strains in Europe. The aim of this study was to assess the ability of these laboratories to perform PFGE typing, including profile interpretation for the first time, on a panel of 10 strains.
Of 28 laboratories, three laboratories, two NPHLs (10, 22), and one NRL (1) did not comply with one of the mandatory criteria set by the EURL. The results of these laboratories were taken into account in the study. The deviations observed for the other laboratories were not related to changes in the protocol, but to other factors detailed below.
Most of the deviations (55.6% of the deviations on combined profiles) were caused by a distortion in DNA migration. These distortions could be due to the malfunctioning of the PFGE system. The distortion could also be due to other criteria of the run, such as gel volume, Tris borate EDTA (TBE) buffer composition, or buffer temperature stability during the run (Murchan et al., 2003).
The second cause of deviations (28.9%) was the poor quality of profiles. This can be explained by DNA degradation in the plug. Such degradation is often due to contaminated solutions or debris in the gel.
The third cause of deviation (5.6%) was incomplete DNA restriction. For two laboratories, extra bands were observed on some profiles, while the H2446 cell lysis control correctly migrated. In these cases, a failure in the lysis cell step could have inhibited the enzyme's ability to digest genomic DNA and thus be responsible for the incomplete restrictions.
The fourth cause of deviation (5.6%) was double-band separation. Some profiles observed in this study were characterized by signals clearly different from the EURL reference profiles. This problem could be related to the migration parameters or to the quality of the gel. A piece of debris stuck on the gel, a slight change in buffer concentration, or a heterogeneous melting of the agarose gel could generate slight changes in band signal shape.
The last cause of deviation (4.4%) was band intensity, and more specifically the intensity of the brightest band of the profile. This was related to overexposure of the gel analyzer's camera. This problem could be solved by decreasing the amount of DNA per plug and by optimizing ethidium bromide staining. The range of saturation of the camera could also be the cause of this overexposure and must be adjusted or improved so as to detect a larger range of brightening intensity. Weak intensity in the upper or lower bands of the profiles was also observed. This weak intensity could be related to insufficient staining, insufficient concentration of DNA in the plug, poor cell lysis efficiency, or degradation of the DNA by DNAse. This degradation may either occur during the cell lysis, restriction, or migration steps.
Regarding the NRL network, the percentage of profiles indistinguishable from the EURL profiles (73.7%) was lower than for the 2010 PT trial (81.7%) but higher than for the 2009 PT trial (68.9%). Among the eight NRLs trained by the EURL for PFGE typing, six have improved their results. This evolution demonstrated the benefits for the NRLs of participation in the PFGE training sessions.
Of the 14 NRLs considered competent in 2010, six failed in 2012 (1, 2, 5, 18, 27, 32). For NRL 1, the results obtained in 2012 could be explained by recent changes in the laboratory's internal organization and in the PFGE team. For NRL 2, the Salmonella Braenderup H9812 reference system correctly migrated while the profiles of test strains migrated with a shift forward. This problem, never observed during the last two PT trials, may be explained by the particular structure of the DNA plug, which increased the DNA migration rate during the run. For NRL 5, the deviations encountered were related to gel preparation. Two NRLs (18, 27) made an error in strain numbering. For NRL 29, which failed in the last three PT trials, the EURL recommended further training (even on site). Finally, NRL 32 obtained overexposed profiles.
In the 2009 and 2010 PT trials, deviations whose origin could not be explained accounted for 1% of all the combined profiles analyzed (Félix et al., 2012b). For the 2012 PT trial, the unexplained deviations remained at about the same level, representing 0.6% of all the combined profiles analyzed (2 of 308). Such deviations cannot be detected in routine analysis and would be considered as relevant.
Eleven of the 22 laboratories that participated in the PFGE profile interpretation part of the PT trial failed, including seven NRLs and four NPHLs. This relatively high level of failure may be due to the fact that this was the first time PFGE interpretation was included in a PT trial.
Each participant was informed of its results through a preliminary report sent by the EURL. This report provided detailed PFGE results and the deviations encountered. Based on this report and discussions with the EURL on the deviation encountered, each NRL was encouraged to perform its analysis a second time. Three NRLs (2, 5, 18) performed the analysis a second time and succeeded both for PFGE and for PFGE profile interpretation. The EURL final report summarized all the data obtained by the participants and the investigations carried out in collaboration with the NRLs on the deviations. This work made it possible to provide a technical PFGE solution to the NRLs and to specify the training needs of NRLs. A PFGE training session program was devised and individual or collective training sessions were scheduled at the EURL or on site. Thus, each NRL could benefit from individual technical follow-up and scientific assistance by the EURL. In addition, several profiles of poor quality were submitted during this PT trial. These should be less numerous in the future thanks to the participation of the NRLs in the EURL training sessions. The EURL could allow participants to re-do poor-quality profiles if they express this need before the submission deadline. All this work should improve NRL performance in future EURL PFGE PT trials.
Conclusions
Of the 28 laboratories that participated in the 2012 PT trial on PFGE typing of Lm, 16 laboratories (10 NRLs and six NPHLs) were considered competent. Of the 22 laboratories that participated in the PFGE profile interpretation part of the PT trial, 11 laboratories (eight NRLs and three NPHLs) were considered competent for PFGE profile interpretation. The results obtained here demonstrated that to date, eight NRLs are able to submit profiles to the EURL Lm database. This PT trial also provided a valuable opportunity to share comparable PFGE profiles among human and food reference laboratories.
Footnotes
Acknowledgments
We would like to thank the European NRLs and NPHLs that took part in this study. We also wish to thank Dr. Eva Moller Nielsen for her helpful advice in the drafting of this article. This study was conducted as part of the activities of the European Union Reference Laboratory for Listeria monocytogenes with a supporting grant by the Directorate-General for Heath and Consumer Protection (DG Sanco) of the European Commission.
Disclosure Statement
No competing financial interests exist.