
Abstract
Background:
Ciguatera and scombroid fish poisonings are common causes of fish-related foodborne illness in the United States; however, existing surveillance systems underestimate the overall human health impact.
Objectives:
This study aimed to describe existing data on ciguatera and scombroid fish poisonings from outbreak and poison control center reports and to estimate the overall number of ciguatera and scombroid fish–poisoning illnesses, hospitalizations, and deaths in the United States.
Methods:
We analyzed outbreak data from the Foodborne Disease Outbreak Surveillance Systems (FDOSS) from 2000 to 2007 and poison control center call data from the National Poison Data System (NPDS) from 2005 to 2009 for reports of ciguatera and scombroid fish poisonings. Using a statistical model with many inputs, we adjusted the outbreak data for undercounting due to underreporting and underdiagnosis to generate estimates. Underreporting and underdiagnosis multipliers were derived from the poison control call data and the published literature.
Results:
Annually, an average of 15 ciguatera and 28 scombroid fish–poisoning outbreaks, involving a total of 60 and 108 ill persons, respectively, were reported to FDOSS (2000–2007). NPDS reported an average of 173 exposure calls for ciguatoxin and 200 exposure calls for scombroid fish poisoning annually (2005–2009). After adjusting for undercounting, we estimated 15,910 (90% credible interval [CrI] 4140–37,408) ciguatera fish–poisoning illnesses annually, resulting in 343 (90% CrI 69–851) hospitalizations and three deaths (90% CrI 1–7). We estimated 35,142 (90% CrI: 10,496–78,128) scombroid fish–poisoning illnesses, resulting in 162 (90% CrI 0–558) hospitalizations and 0 deaths.
Conclusions:
Ciguatera and scombroid fish poisonings affect more Americans than reported in surveillance systems. Although additional data can improve these assessments, the estimated number of illnesses caused by seafood intoxication illuminates this public health problem. Efforts, including education, can reduce ciguatera and scombroid fish poisonings.
Introduction
In the United States, outbreaks of ciguatera and scombroid fish poisoning are reported to the Centers for Disease Control and Prevention's (CDC) Foodborne Disease Outbreak Surveillance System (FDOSS). Some states require reporting of individual cases of illness; however, these systems are not centralized and reporting requirements vary. Moreover, routine clinical diagnostic tests are unavailable for these toxins, so diagnosis is based on clinical presentation and a history of eating seafood in the preceding 24 h, after excluding other potential causes. Thus, existing surveillance systems likely underestimate the overall human health impact of these foodborne diseases (Dickey and Plakas, 2010; Hungerford, 2010).
In 2011, CDC published estimates of foodborne illness (Scallan et al., 2011) and noted the lack of agent-specific estimates for noninfectious causes of foodborne illness as an important limitation. This study helps address this data gap by describing existing data on reported ciguatera and scombroid fish poisonings from outbreak and poison control center reports and estimating the overall number of ciguatera and scombroid fish–poisoning illnesses, hospitalizations, and deaths in the United States using the model developed by Scallan et al. (2011) for other foodborne agents.
Materials and Methods
Data sources
Foodborne Disease Outbreak Surveillance System (FDOSS)
Health departments report outbreaks of ciguatera and scombroid fish poisoning centrally to CDC's FDOSS (Gould et al., 2011). A confirmed seafood toxin outbreak is defined as ≥2 cases of a similar illness resulting from the ingestion of a common food, of which ≥1 has met the confirmed case definition (CDC, 2009). For ciguatera and scombroid fish poisonings, confirmed cases are persons with clinical symptoms who report eating seafood in the preceding 24 h, where the implicated seafood is a species previously associated with ciguatera or scombroid fish poisonings or with laboratory evidence of ciguatoxin or elevated histamine levels (CDC, 2006).
We extracted data from FDOSS on confirmed ciguatera and scombroid fish–poisoning outbreaks and outbreak-associated illnesses reported from the 50 states and the District of Columbia from 2000 to 2007. Data included the reporting state, date of illness onset for the index case, reported symptoms, and the number of hospitalizations and deaths. Outbreaks involving ≥2 states were counted as a single outbreak. Outbreak-associated illnesses included epidemiologically linked cases (CDC, 2009).
National Poison Data System (NPDS)
In 2009, American Association of Poison Control Centers (AAPCC) consisted of 60 Poison Control Centers serving 50 states, the District of Columbia, and 10 U.S. territories (Bronstein et al., 2010). Poison control center staff trained in toxicology respond to queries about exposures and requests for information and document telephone calls in an online system. Exposures entered into NPDS are unverified. Beginning in 2005, AAPCC documented exposure calls reporting ciguatera and scombroid fish poisoning (Lai et al., 2006). Prior to 2005, these were included in the broad category of “food poisoning.”
Using NPDS annual reports from 2005 to 2009, we extracted information on exposure calls involving ciguatoxin or scombroid fish poisonings including age, reason for exposure (unintentional, intentional, other, adverse reaction), whether or not the patient was treated in a healthcare facility, and outcome (none, minor, moderate, severe, or death) (Bronstein et al., 2007, 2008, 2009, 2010).
Estimates of total illnesses
Estimates of the total number of illnesses, hospitalizations, and deaths were generated by adjusting the number of outbreak-associated illnesses for underreporting and underdiagnosis using a statistical model with many inputs (Appendix Tables 1 and 2). A similar model was used to estimate illnesses for other foodborne agents (Scallan et al., 2011).
For a ciguatera or scombroid fish–poisoning illness to be reported to FDOSS, the illness must be part of a recognized outbreak and the outbreak must be reported to public health authorities. Therefore, to estimate the number of illnesses that would be reported if all diagnosed cases (outbreak and nonoutbreak) were reported to surveillance (i.e., the estimated number of reported cases), we determined the average annual number of outbreak-associated illnesses reported from 2000 to 2007 and adjusted for underreporting using the outbreak under-reporting multiplier developed by Scallan et al. (2011) for bacterial foodborne pathogens. In order to compare with previous estimates, we based our estimates on the 2006 U.S. population.
Even if all diagnosed cases of ciguatera or scombroid fish–poisoning illness were identified by surveillance, only persons seeking medical care and those correctly diagnosed by their physician are reported (Appendix Fig. 1). Therefore, to estimate the total number of illnesses, we adjusted the estimated number of reported cases for underdiagnosis by estimating the proportion of cases that would seek medical care and the proportion that would be correctly diagnosed by their physician and creating multipliers based on the inverse of these proportions. Because persons with severe illness are more likely to seek medical care, we considered those with severe and mild illnesses separately. We estimated the proportion of severe ciguatera and scombroid fish–poisoning illnesses using NPDS data, where exposure calls coded as having a moderate or severe outcome were considered severe. We estimated that 68% of physicians would correctly diagnose a case of severe ciguatera fish poisoning, based on a study of Florida physicians (McKee et al., 2001). For mild illnesses, we assumed the proportion correctly diagnosed would be half that for severe illnesses. Because of limited information, we applied the same data and assumptions to estimate scombroid fish–poisoning illnesses. We estimated the frequency with which persons with mild and severe illnesses sought medical care using data for other foodborne agents (Scallan et al., 2011).
To estimate the total number of hospitalizations, we determined the hospitalization rate from outbreaks reported to FDOSS and applied this rate to the estimated number of diagnosed cases. Because not all hospitalized cases will be diagnosed, we doubled this number to adjust for underdiagnosis, similar to the methods used by Scallan et al. (2011). Because no deaths were reported in ciguatera or scombroid fish poisoning in FDOSS, we estimated the death rate from the published literature: 0.1% and 0% for ciguatera and scombroid fish poisoning, respectively (Sobel and Painter, 2005; Hungerford, 2010), applied these rates of the estimated number of diagnosed cases, and doubled to adjust for underdiagnosis.
Uncertainty analysis
We used probability distributions to describe the uncertainty in each of the model inputs. We used empirical data to define entire distributions for the number of reported illnesses and hospitalizations by year (Appendix Fig. 1). For deaths and all multipliers, we used a four-parameter Beta (modified PERT distribution). Based on 100,000 iterations, we obtained empirical distributions of counts corresponding to Bayesian posterior distributions. We then used these posterior distributions to describe the point estimate and upper and lower 90% credible limits for the numbers of illnesses, hospitalizations, and deaths. Analyses were conducted using SAS, version 9.2 (SAS Institute, Cary, NC).
Results
Outbreak reports
During 2000–2007, 123 confirmed ciguatera fish–poisoning outbreaks were reported to FDOSS from 15 states and the District of Columbia, an average of 15 annually. These outbreaks included 479 illnesses, with Hawaii, Florida, and California reporting the majority (Table 1). Annually, there was an average of 60 outbreak-associated illnesses, with an average of four ill persons per outbreak (range: 2–29). Of the 121 outbreaks with case outcome information, 11.4% (53/465) of persons were hospitalized; no deaths were reported. Commonly reported symptoms included diarrhea (64.5%; 300/465), paresthesia (43.7%; 203/465), and abdominal cramps (43.2%, 201/465).
One ciguatera fish poisoning outbreak involved residents of multiple states.
Other states reporting outbreaks are CO, CT, DC, IL, LA, MA, MD, MO, NY, OR, RI, SC, and VA.
O, number of outbreaks; I, number of ill persons.
During the same period, 223 confirmed scombroid fish–poisoning outbreaks were reported from 21 states and the District of Columbia, an average of 28 annually. These outbreaks included 865 illnesses, with Hawaii, California, and Florida reporting the majority (Table 2). Annually, these outbreaks affected 108 persons with an average of four ill persons per outbreak (range: 2–41). Of the 212 outbreaks with case outcomes, 3.1% (25/810) persons were hospitalized. No deaths were reported. Commonly reported symptoms included flushing (50.3%; 408/810), diarrhea (49.3%; 399/810), headache (40.7%; 330/810), and abdominal cramps (24.7%; 200/810).
Three scombroid fish–poisoning outbreaks involved residents of multiple states.
Other states reporting outbreaks are CO, DC, GA, IL, LA, MA, MD, MN, MI, NY, OH, OR, PA, RI, SC, TN, WA, WI, and NJ.
O, number of outbreaks; I, number of ill persons.
Exposure reports
During 2005–2009, there were 863 ciguatera fish–poisoning exposure calls to NPDS, an average of 173 annually (range: 154–189). Of 510 (59%) describing patient outcome, 268 (53%) reported a moderate or major outcome. During the same time period, there were 999 scombroid exposure calls, an average of 200 annually (range: 161–266). Of 503 (50%) calls describing patient outcome, 173 (34%) reported a moderate or major outcome.
Estimate of total illnesses
After adjusting outbreak-associated illnesses for under-reporting and underdiagnosis, we estimated 15,910 (90% CrI 4140–37,408) ciguatera and 35,142 (90% CrI: 10,496–78,128) scombroid fish–poisoning illnesses in the United States annually. Ciguatera and scombroid fish–poisoning illnesses were estimated to result in 343 (90% CrI: 69–851) and 162 (90% CrI: 0–558) hospitalizations, respectively. We estimated an average of three deaths (90% CrI: 1–7) annually for ciguatera, but no deaths for scombroid fish poisoning. This suggests that for every outbreak-associated ciguatera and scombroid fish–poisoning illness reported to FDOSS, there are 259 and 317 illnesses in the community, respectively (Fig. 1).
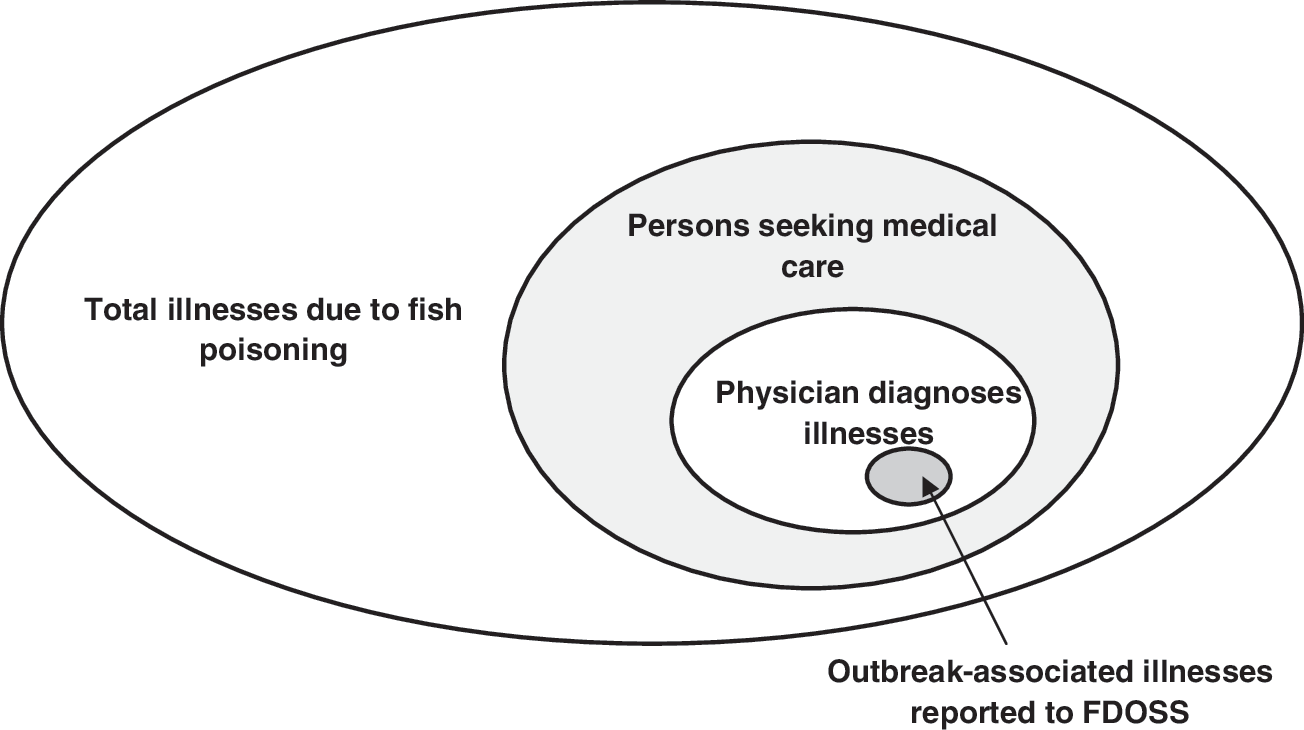
Schematic of total illnesses due to ciguatera and scombroid fish poisoning and the proportion of illnesses reported to the Foodborne Disease Outbreak Surveillance System (FDOSS).
Discussion
Ciguatera and scombroid fish poisonings are regularly reported as part of outbreaks and in calls to poison centers, with states located close to ciguatera-endemic waters reporting the majority of the ciguatera fish–poisoning outbreaks. While frequently reported, these represent a fraction of all illnesses. For an illness to be reported to CDC's FDOSS, the illness must be part of an outbreak that is recognized and reported to public health authorities. Because ciguatera and scombroid fish–poisoning outbreaks typically affect a small number of persons, they may be hard to detect and will therefore go unreported. Under-reporting also occurs in states that require reports of individual cases. In Florida, only 43% of ciguatera fish poisonings logged in the Poison Information Center-Miami system were reported to the Department of Health (Begier et al., 2006). Only 47% of Floridian physicians knew that ciguatera fish poisoning was a reportable condition (McKee et al., 2001), suggesting that a lack of knowledge about reporting requirements may contribute to under-reporting.
Ciguatera and scombroid fish poisonings may also be underdiagnosed because physicians incorrectly diagnose ill persons. Symptoms of ciguatera and scombroid fish poisonings are nonspecific and may be misdiagnosed, particularly in nonendemic areas where physicians rarely see these conditions (Sobel and Painter, 2005; Langley et al., 2009). Scombroid fish–poisoning symptoms, for example, often resolve with antihistamines and may be mistaken for a seafood allergy (Attaran and Probst, 2002; Hungerford, 2010). Even if a physician considers ciguatera or scombroid fish poisoning, diagnosis is not straightforward and relies on the patient reporting a recent history of fish consumption and presenting with identifiable symptoms. Laboratory tests for ciguatoxins in human specimens are expensive and availability is limited (Dickey and Plakas, 2010); laboratory tests to detect ciguatoxins in fish samples exist, but currently no rapid test options are available (HHS and FDA, 2011). While tests for elevated histamine samples in fish specimens are available (Hungerford, 2010), tests for scombroid-associated toxins in human specimens do not exist because histamine naturally occurs in the human body (Sobel and Painter, 2005). Scombroid fish–poisoning symptoms often resolve within 24 h, and therefore may not necessitate care by a physician (Hungerford, 2010). Also, because there are limited treatment options, ill persons, particularly those living in endemic areas and with familiarity of ciguatera and scombroid fish–poisoning symptoms, may decide not to seek care.
Published estimates of the global and country-specific incidence of disease attributed to ciguatera poisoning vary and are based on limited data. In their review, de Fouw et al. (2001) suggested that only 10%–20% of illnesses attributed to ciguatera fish poisoning are reported to surveillance, with variation from country to country. Our estimate of ciguatera fish poisoning is lower than estimates of the incidence of ciguatera fish poisoning in the countries bordering the Pacific Ocean and Caribbean Sea (50,000–500,000 cases annually) (Quod and Turquet, 1996) and higher than some estimates of the global incidence of disease (10,000–50,000 cases annually) (Lipp and Rose, 1997; Friedman et al., 2008). Rates of ciguatera fish poisoning in Pacific and Caribbean countries are likely higher than in the United States because the water temperatures support the growth of the ciguatoxin-producing organisms. There are no published estimates of scombroid fish–poisoning disease burden (de Fouw, 2001).
Our estimates of ciguatera and scombroid fish–poisoning illnesses are substantially lower than estimates of the leading infectious causes of domestically acquired foodborne illness in the United States. For example, the CDC estimated approximately 1.0 million illnesses due to both non-typhoidal Salmonella and Campylobacter (Scallan et al., 2011). Infectious diseases with a similar number of estimated foodborne illnesses to ciguatera fish poisoning included Staphylococcus aureus (11,217), diarrheagenic Escherichia coli other than Shiga toxin–producing E. coli and enterotoxigenic E. coli (ETEC) (11,982), and ETEC (17,894). Vibrio parahaemolyticus had a similar number of estimated illness (34,664) as scombroid fish poisoning (Scallan et al., 2011).
We estimated that scombroid fish poisonings cause more illnesses, but ciguatera fish poisonings result in twice the number of hospitalizations. FDOSS informed these estimates and they are consistent with NPDS data. More than half of exposure calls involving ciguatera fish poisoning were described as severe compared to one third of exposure calls involving scombroid fish poisoning.
The per capita U.S. seafood consumption rate is high, third only to China and Japan (National Marine Fisheries Service, 2010), and fish and shellfish consumption has increased in the United States since 1980 (National Marine Fisheries Service, 2010). International trade met the demand; now >80% of fish and seafood is imported (National Marine Fisheries Service, 2010). Rise in seafood consumption and the globalization of the seafood trade may increase the risk of ciguatera and scombroid fish poisoning and the geographic distribution (Villareal et al., 2006; Dickey and Plakas, 2010). Climate change may also raise the risk of ciguatera fish poisoning. Ciguatoxin-producing organisms have maximum growth rates in warm sea temperatures. With warmer sea temperatures, ciguatoxin-producing organisms might migrate to new locations and proliferate more rapidly (Tester et al., 2010).
There are several limitations to our analysis. When estimating the total number of ciguatera and scombroid fish–poisoning illnesses, we used an approach similar to that used by Scallan et al. (2011) to estimate the number of foodborne illnesses caused by infectious foodborne agents. When adjusting for under-reporting, we adopted the outbreak under-reporting multiplier used for bacterial infections; however, it is not clear how applicable this multiplier is to noninfectious fish-poisoning illnesses. When adjusting for underdiagnosis due to medical care–seeking behaviors, we also relied on estimates from Scallan et al. for medical care-seeking for severe and mild illness. These estimates were based on a study of persons with episodes of acute bloody and nonbloody diarrheal illness, and it is not known how these estimates relate to the medical care-seeking behaviors of persons with a fish-poisoning illness. For instance, the rate of medical care seeking among persons with ciguatera or scombroid fish poisoning may be lower, as these illnesses often have a shorter duration. If symptoms resolve quickly, ill persons may be less likely to seek medical care; a lower rate of medical care seeking would increase the total number of estimated illnesses. We estimated the rate at which a physician correctly diagnoses ciguatera illnesses from a study in an endemic area, but it is not known how well these data reflect practices in nonendemic areas. Moreover, due to the limited body of research on scombroid fish poisonings, we applied the assumptions made for ciguatera fish–poisoning diagnosis to scombroid fish poisonings. There are also limitations with the NPDS data used to estimate the proportion of cases of illness that are severe. Exposure calls to poison centers are self-reported and may be biased toward more severe cases seeking medical advice. NPDS reports include data from U.S. territories, but we limited the FDOSS data to those from the 50 states and the District of Columbia. The FDOSS data used in this analysis did not capture illnesses associated with international travel, which may represent additional cases.
These estimates represent a first step in understanding of the public health impact of scombroid and ciguatera fish poisonings in the United States. In the absence of data specific to scombroid and ciguatera fish–poisoning illnesses, we relied on estimates from Scallan et al. (2011) for a number of model inputs. More precise information on the medical care-seeking behaviors associated with scombroid or ciguatera fish poisonings and the diagnostic practices of physicians would improve the inputs and our estimates. In addition, scombroid and ciguatera fish poisonings occur most often in coastal states; further state-specific analysis could offer insight on incidence and geographic distribution.
Despite limitations, our estimates indicate that illness caused by seafood poisoning is an important public health problem. Further efforts, including education aimed at the prevention of seafood intoxication by avoidance of high-risk fish such as large predatory fish and proper fish storage, can help reduce ciguatera and scombroid fish poisoning.
Footnotes
Acknowledgments
We are grateful to Barbara Mahon and Hannah Gould for their thoughtful review and commentary on the manuscript.
Disclosure Statement
No competing financial interests exist.
Appendix
| Model input | Data source | Distribution | Parameters |
|---|---|---|---|
| Reported illness | Number of scombroid fish poisoning outbreak-associated illnesses reported to CDC's Foodborne Disease Outbreak Surveillance System (2000–2007) | Empirical | By year (2000–2007): 109, 137, 86, 161, 95, 107, 102, 68 |
| Population adjustment (year) | Population ratios applied to each year from 2000 to 2007 based on U.S. Census population estimates | Degenerate | Ratio by year (2000–2007): 1.058, 1.047, 1.038, 1.029, 1.019, 1.010, 1.000, 0.990 |
| Under-reporting | Outbreak surveillance multiplier used to adjust for under-reporting. Multiplier determined from 11 pathogens with active surveillance case counts and outbreak-related case counts (Scallan et al., 2011) | PERT | Low, modal, high, (precision) values: 5, 16, 237 |
| Proportion severe | Proportion of National Poison Data System's exposure calls coded as having moderate or severe outcomes (2005–2009). Uncertainty with this proportion was based on a 50% relative increase/decrease from 0.34 on an odds scale. | PERT | Low, modal, high values: 0.26, 0.34, 0.44 |
| Medical care seeking (severe) | Proportion (and 95% CI) of survey respondents with bloody diarrhea who sought medical care from FoodNet Population Surveys (2000–2001, 2002–2003, 2006–2007) (CDC, unpublished data) a | PERT | Low, modal, high values: 0.19, 0.35, 0.51 |
| Medical care seeking (mild) | Proportion (and 95% CI) of survey respondents with nonbloody diarrhea who sought medical care from FoodNet Population Surveys (2000–2001, 2002–2003, 2006–2007) (CDC, unpublished data) | PERT | Low, modal, high values: 0.15, 0.18, 0.20 |
| Physician diagnosis (severe) | Assumed to be the same proportion as ciguatera fish poisoning | PERT | Low, modal, high values: 0.59, 0.68, 0.76 |
| Physician diagnosis (mild) | Assumed to be the same proportion as ciguatera fish poisoning | PERT | Low, modal, high values: 0.26, 0.34, 0.44 |
| Proportion hospitalized | Proportion of cases hospitalized in scombroid fish poisoning outbreaks reported to the Foodborne Disease Outbreak Surveillance System (2000–2007) | Empirical | By year (2000–2007): 0.028, 0.066, 0.000, 0.006, 0.032, 0.009, 0.059, 0.029 |
| Proportion who died | Proportion based on the published literature (Hungerford, 2010) | Constant | 0.000 |
| Underdiagnosis (hospitalizations, deaths) | Number of hospitalizations and deaths doubled to account for underdiagnosis (Scallan et al., 2011). | PERT | Low, modal, high values: 1, 2, 3 |
The FoodNet Population Surveys are random-digit-dial telephone surveys of the general population in FoodNet sites. At the time of these surveys, the population in FoodNet sites included 11% (in 2000) to 15% (in 2007) of the U.S. population. Surveys were conducted over 12-month periods and collected information about episodes of diarrhea in the past month and whether ill persons sought medical care and submitted a stool sample for that illness. An episode of diarrhea was defined as >3 loose stools in 24 h in the past month lasting >1 day or resulting in restricted daily activities (Jones et al., 2007).
CDC, Centers for Disease Control and Prevention; CI, confidence interval.