
Abstract
To understand the nature of a bacterial strain, it is necessary to be able to identify and measure the proteins expressed by the bacteria. In this research, the entire protein complements produced by Escherichia coli O157:H7 strain 43894OW and its naturally occurring curli producing variant 43894OR were compared to better understand the unique capabilities of these two closely related strains. A nonlabeled proteomic comparison was performed utilizing the spectra counting and peptide fractionation abilities of a quadrupole-time of flight analyzer mass spectrometer to identify and quantitate the proteins produced by the two strains. The process reliably identified and measured the concentration of 419 proteins from strains 43894OW and 43894OR within three separate biological replicates. From these two sets, 59 proteins were identified that were preferentially expressed in strain 43894OW compared to 43894OR and 14 proteins that were conversely preferentially expressed in 43894OR. A subset of the preferentially expressed proteins was assayed to determine whether their levels of gene transcription corresponded with the observed protein expression. From the resulting list of confirmed differentially expressed proteins, it was observed that the proteins contributing to acid survival—GadA and GadB—were overexpressed in 43894OW compared to 43894OR. The predicted enhanced acid resistance phenotype of 43894OW was confirmed by experimentation at pH 2.5. Additionally, a knockout mutation in the csgD genes of the 43894OR strain was constructed and suggested that CsgD had a repressive effect on acid survival in 43894OR.
Introduction
E
Previous attempts to measure the differences in protein expression by these E. coli variants have produced disappointing results. Two-dimensional gel electrophoresis and two-dimensional (2-D) liquid chromatography produced inconsistent results that were neither cost effective nor amenable to multiple samples or replicates (Gunther et al., 2010). Alternatively, liquid-based isoelectric focusing, column-based chromatofocusing, and mass spectrometry improved reproducibility and cost effectiveness (Gunther et al., 2012). However, when performing whole-cell proteomic comparisons, the initial fractionation proved unnecessary. High-pressure liquid chromatography (HPLC) systems coupled to a mass spectrometer have been utilized to make direct comparisons of protein samples, allowing for a simplified workflow (Peng et al., 2003; Fournier et al., 2007; Zhang et al., 2010). Quantification of protein concentrations in the samples being compared have been accomplished using a variety of labeling techniques (Gygi et al., 1999a; Ong et al., 2002; Ross et al., 2004; Aggarwal et al., 2006; de Godoy et al., 2006; Fenselau, 2007; Schulze and Usadel, 2010). Recently, nonlabeled quantification techniques have been used for comparative proteomics, providing a cost advantage compared to labeled techniques (Liu et al., 2004; Old et al., 2005; Wang et al., 2006; Neubert et al., 2008; Boehmer et al., 2010). For these reasons, a 2-D HPLC system connected directly to a quadrupole time-of-flight analyzer (Q-Tof) mass spectrometer was utilized to make a nonlabeled comparison of the total proteins produced by 43894OW and 43894OR. Messenger RNA transcripts were also utilized for comparative expression assays based on an implied direct relationship between mRNA levels and expressed protein concentrations (Gygi et al., 1999b). Among the proteins identified as differentially expressed were GadA and GadB, which play a role in E. coli survival in acidic conditions (pH 2.5) (Castanie-Cornet et al., 1999; De Biase et al., 1999). This observation led to an investigation of the differences in acid resistance between the variant strains.
Materials and Methods
Bacterial strains and growth conditions
E. coli O157:H7 strains 43894OW and 43894OR were derived from human disease isolate ATCC 43894 (American Type Culture Collection) (Wells et al., 1983; Uhlich et al., 2001). Strains were stored at −80°C in brain heart infusion media plus 15% glycerol. Strains were grown and maintained on Congo red indicator (CRI) plates (per liter: 20 g agar, 1 g yeast extract, 10 g casamino acids [Becton Dickinson, Sparks, MD], 20 mg Congo red dye) and incubated at room temperature (∼25°C).
Whole-cell protein extraction and digestion
43894OW and 43894OR were streaked from CRI plates for confluence onto six YESCA plates (per liter: 20 g agar, 1 g yeast extract, 10 g casamino acids) and incubated at room temperature for 48 h. Following incubation, 5 mL of 50 mM Tris-HCl (pH 8.0) was added to each plate and cells were removed with a cell spreader. Twenty-five milliliters of cell suspensions from each strain were pelleted by centrifugation (5500×g for 10 min). Pellets were lysed using ProteaPrep bacterial cell lysis kit (Protea Biosciences, Morgantown, WV). Pellets were resuspended in 2 mL ProteaPrep wash buffer (pH 8.0), from the suspension; 1 mL was used for protein extraction, 0.5 mL for RNA extraction, and 30 μL to determine cell concentration. The 1-mL suspensions for protein extraction were pelleted by centrifugation (13,000×g for 5 min at 4°C). Pellets were resuspended in 1 mL ProteaPrep cell lysis buffer plus 100-μL protease inhibitor cocktail (Protea Biosciences). Cells in lysis buffer were placed in 2 mL microcentrifuge tubes with low protein binding 100-μm zirconium beads (OPS Diagnostics, LLC, Lebanon, NJ) and placed on ice for 30 min. During incubation, cells were disrupted using a BeadBeater agitation system (BioSpec Products, Bartlesville, OK) for 3×60 s with at least 5 min between agitations. Lysed cells were centrifuged (13,000×g for 10 min at 4°C) and supernatants were collected. Two hundred microliters of supernatant was acidified (pH 2.5) using 50 μL 10% vol/vol formic acid (FA) at room temperature for 10 min deactivating lysis buffer detergent. Acidified samples (150 μL) were neutralized (pH 8.0) by addition of 200 μL 50 mM ammonium bicarbonate; protein concentrations were measured using a BCA assay (Pierce, IL). Next, 200 μL of both preps were digested with trypsin. Samples were first reduced using 1 μL 0.5 M dithiothreitol (DTT) and incubated at 57°C for 20 min. Samples were then alkylated using 2.7 μL 0.55 M iodoacetamide and incubated at room temperature for 20 min in the dark. Finally, 1 μL 1% m/vol surfactant (ProteasMAX, Promega, Madison, WI) and 1.8 μL of 1 μg/μL trypsin (TrypsinGold, Promega) were added and digestion progressed for 12 h at 37°C. Resulting tryptic peptide samples were acidified using 4 μL 10% vol/vol FA and stored at −20°C.
Peptides separation and mass spectrometry
Tryptic peptides were injected by triplicate into a Nano-Acquity ultrapressure liquid chromatographer (UPLC) (Waters Co., Milford, MA). Samples were adjusted to a final concentration of ∼500 ng/μL using phosphorylase B digest (Waters Co.) as internal standard for quantification (concentration 200 fmol/μL). The UPLC was operated in 2-D with a reversed phase-reversed phase with dilution method. The first dimension utilized an XB ridge BEH130 C18, 5-μm (300-μm×50-mm) column (Waters Co.) with solvent A: 20 mM ammonium formate (pH=10.0) and solvent B: acetonitrile. Five μL were injected into a 1-D column running at 2 μL/m with five-step gradient methods with the following compositions: solvent A 5 min, after which the composition of solvent B increased with a linear gradient to 15 min, returning to the initial composition to a final time of 20.5 min. The solvent B composition was as follows: step 1, 10.8%; step 2, 14.0%; step 3, 16.7%; step 4, 20.4%; and step 5, 50%.
Eluting peptides from the corresponding step of the 1-D column were trapped with a Symetry C18 5-μm (180-μm×20-mm) column (Waters Co.) running a dilution method with water 0.1% FA at 20 μL/min to achieve a 10-fold dilution, adjusting the pH to the analytical condition according to the concentration of FA 0.1%. After 20.5 min of trapping, the UPLC switched to the high strength silica (HSS) T3, 1.8-μL (75-μm×150-mm) analytical column (Waters Co.) running at 500 nL/min with the following gradient: solvent C (water, 0.1% FA), 95% solvent D (acetonitrile, 0.1% FA); the concentration of solvent C increased linearly to 40% with a final time of 65 min. After completing the previous gradient, the analytical column was washed with 85% solvent D (5 min) and equilibrated to initial conditions (15 min). After the five-step methods were completed, a flushing method (no injection) was applied to both columns running 85% solvent B for 10 min for the 1-D column, and 85% solvent D for the trap and 2-D columns.
The analytical column was connected to a Q-Tof Synapt G1 mass spectrometer (Waters Co.). The Q-Tof mass spectrometer was operated in MSE acquisition mode with a NanoLock-Spray probe, with collision energy set at 6 V (for intact peptide detection) and ramped from 15 V to 40 V (for peptide fragmentation) at 1-s intervals. The reference mass-lock electrospray was pumped at 450 nL/m with an Acquity Auxiliary pump (Waters Co.) with a solution containing 300 fmol Glu-fibrinopeptide ([M+2H]+=785.8426) (water:acetonitrile [75:25] 0.1% FA), and sampled at 30-s intervals to calibrate Tof analyzer. Prior to injection of each sample set, the Tof analyzer calibration was evaluated for mass accuracy within 3 ppm with fragmented ions (30-V collision energy) of Glu-fibrinopeptide.
Data analysis, protein identification, and quantification
MSE raw data were submitted for analysis and protein identification using the IdentityE algorithm and search engine ProteinLynx Global Server (PLGS) version 2.5 (Waters Co.). Files were processed to generate charge-state-reduced, deisotoped, precursor mass list, and associated products ions. An E. coli O157 database from
RNA isolation, cDNA synthesis, and real-time PCR analysis
Total RNA was isolated from 0.5-mL cell suspensions of strains 43894OW and 43894OR (∼5×10⁹ cells each) using Ambion RiboPure™–Bacteria Kit (Ambion, Austin, TX). RNA samples were treated with DNase I (Ambion, Austin, TX) following manufacturer's instructions with the following modification: incubation time was increased to 2.5 h at 37°C to sufficiently digest the genomic DNA.
Synthesis of cDNA was accomplished using Invitrogen's SuperScript III First-Strand Synthesis SuperMix (Invitrogen, Carlsbad, CA) with random hexamers. Five hundred nanograms of DNase I–treated RNA was used for each sample. cDNA synthesis was performed on an Applied Biosystems GeneAmp®PCR System 9600. Primers for reverse transcription polymerase chain reaction (RT-PCR) analysis were designed from the sequences of E. coli EDL933 strain (GenBank accession# NC_002655) using Primer3 (v.0.4.0). Primer sequences are listed in Table 1. The housekeeping gene malate dehydrogenase (mdh) was used as internal control for real-time PCR analysis (Jandu et al., 2009). PCR was performed in 96-well plates on an Applied Biosystems 7500 Real-Time (ABI, Carlsbad, CA) PCR System, described previously (Liu et al., 2011). A reaction volume of 50 μL total containing 25 μL Power SYBR Green PCR Master Mix (ABI), 1.25 μL of each primer (10 μm), and 0.5 μL cDNA and nuclease-free water (Ambion) was used in the analysis. Thermal cycling parameters were 50°C for 2 min for one cycle, initial denaturation at 95°C for 10 min for one cycle, 35 cycles of 95°C for 15 s, and 55°C for 1 min. To determine relative gene expression, the value of the internal control gene was subtracted from samples. The ΔCt, ΔΔCt, and 2−fx values were calculated as previously described (Pfaffl, 2001).
Construction of csgD mutant
The entire csgD coding region of strain 43894OR between start and stop codons was replaced by a neomycin resistance cassette to produce 43894ORΔcsgD as previously described (Uhlich et al., 2009).
Acid-resistance assay
Single colonies of 43894OW, 43894OR, and 43894ORΔcsgD from CRI plates were grown overnight in 5 mL Luria-Bertani (LB)-NS (no salt) cultures, 28°C, 150 rpm. Overnight cultures were diluted 1:1000 into fresh LB-NS, pH 2.5 (adjusted with HCl). Acidic cultures were incubated at 37°C statically for 2 h. The 6×6 drop-plate method was used to determine the numbers of E. coli present in the initial inoculum and the numbers of bacteria that survived after 2 h in acidic conditions (Chen et al., 2003).
Results
The nonlabeled mass-spectrometry-based comparative proteomic assay identified and quantified 419 total proteins (Fig. 1); 398 were identified from 43894OW samples and 321 proteins were identified from 43894OR. Three hundred proteins were common between 43894OW and 43894OR samples. Ninety-eight proteins produced measurable spectra counts in 43894OW samples, with no corresponding spectra counts from 43894OR. Conversely, 21 proteins produced counts in 43894OR samples without corresponding counts in 43894OW.
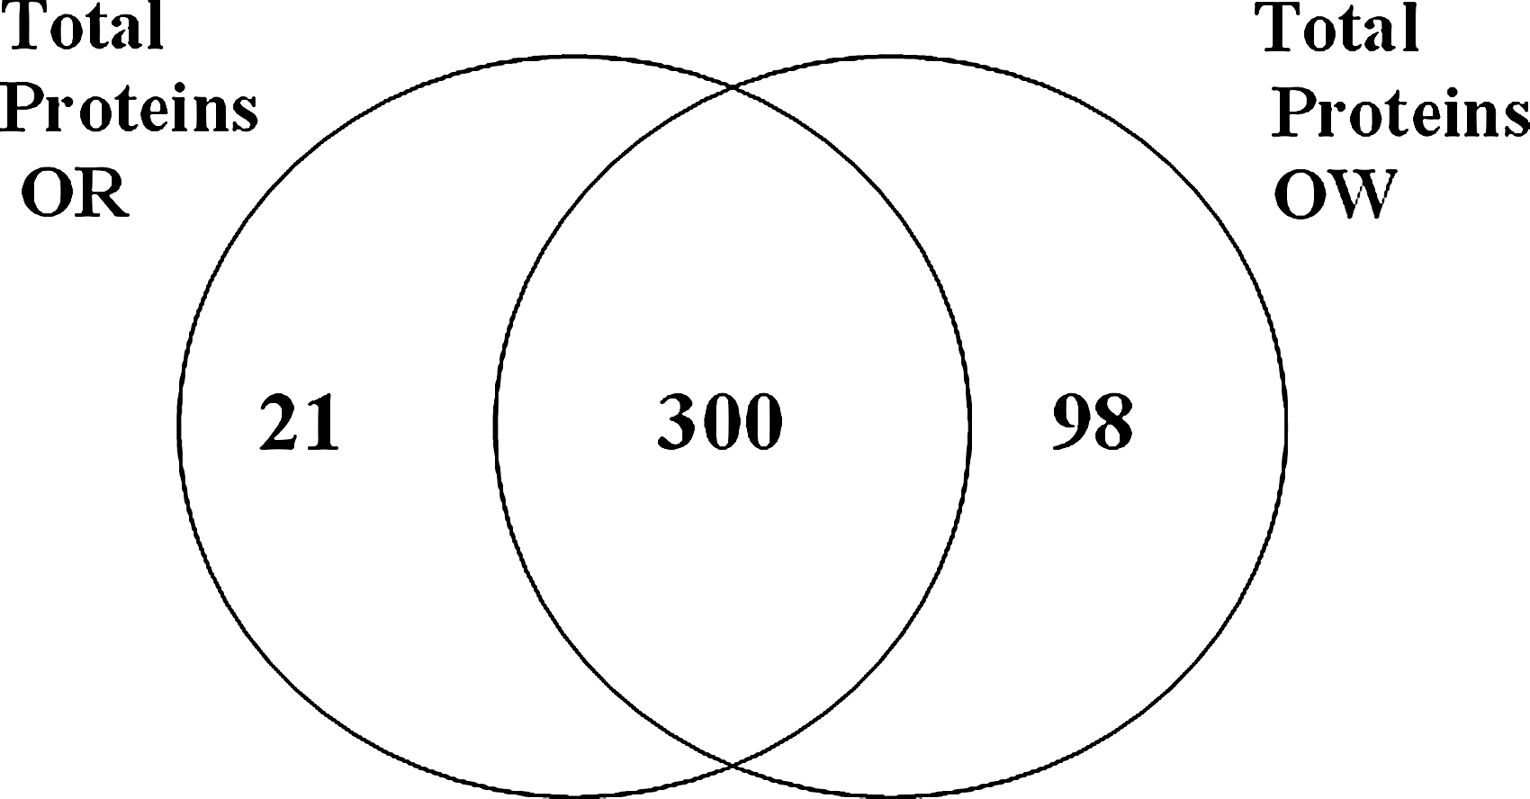
Venn diagram showing the numbers of proteins repeatedly identified over three separate experiments from strains 43894OW and 43894OR.
Quantitative data for the concentrations of individual proteins allowed for comparative analysis identifying proteins that were significantly differentially expressed in 43894OW or 43894OR (Table 2). Strain 43894OW produced 59 proteins in concentrations significantly greater than the same proteins produced by 43894OR. Conversely, 43894OR produced 14 proteins in concentrations significantly greater than the same proteins produced by 43894OW.
A selection of proteins demonstrating differential expression in the comparative proteomic assay was randomly selected for investigation with regard to their gene transcription. Differences in the average threshold cycle numbers and the resulting average fold changes in gene transcription determined which significantly differentially expressed proteins also exhibited differences in corresponding gene transcription (Table 3). The gadA, gadB, and ECs1653 (Q8X589) genes demonstrated greater transcription in 43894OW compared to 43894OR; the purC and arcC transcription results did not correlate with their protein expression results. Transcriptional values for the corresponding genes of proteins with greater expression in 43894OR compared to 43894OW were more uniform with all five genes, demonstrating greater transcription in 43894OR.
Numbers are average values from at least six independent experiments.
Fold change indicates the transcript ratios between 43894OR and 43894OW as determined by real-time PCR.
On the basis of significant differences in both protein expression and gene transcription of acid resistance proteins GadA and GadB exhibited between 43894OW and 43894OR, the strains were compared with regard to acid resistance. After a 2-h exposure to acidic conditions (pH 2.5), a significant survival difference was observed between 43894OW and 43894OR (Fig. 2). Strain 43894OW exhibited a >1 log advantage in average number of cells surviving 2 h at pH 2.5 compared to 43894OR. Additionally, the average mean number of 43894OW cells surviving after a 2-h pH 2.5 exposure did not differ significantly from the numbers of 43894OW and 43894OR cells prior to acid exposure.

The numbers of bacterial cells of strains 43894OW, 43894OR, and 43894ORΔcsgD surviving after a 2-h exposure to pH 2.5 () compared to the number of cells in the initial inoculum ( ). Cell numbers are the log colony-forming units (cfu) mean values of three separate biological replicates, with error bars representing the standard deviation of the means. A two-way analysis of variance was performed and subjected to mean separation by the Bonferroni least significant difference technique. Graph bars with different letter labels were determined to differ significantly with regard to their mean values (p<0.05).
Since 43894OR produces a constitutive fourfold increase in csgD expression compared to 43894OW, it was hypothesized that CsgD may repress expression of Gad proteins, thus explaining strain 43894OR's greater sensitivity to acid (Uhlich et al., 2001). Therefore, a csgD gene deletion in 43894OR was constructed, replacing the coding region of the gene with a neomycin gene. When the csgD gene of 43894OR was inactivated, the mutant strain, 43894ORΔcsgD, survived for 2 h at pH 2.5 in numbers statistically similar to 43894OW compared to parent strain 43894OR (Fig. 2). Compared to 43894OW and mutant 43894ORΔcsgD, an approximate 1-log decrease in mean survival was observed. Additionally, 43894ORΔcsgD grown overnight in LB-NS showed an increase in the transcription levels of gadA and gadB compared to parent strain 43894OR as determined by RT-PCR (Table 4). This observation may explain the enhanced survival of 43894ORΔcsgD at pH 2.5 compared to 43894OR.
Numbers are average values from at least four independent experiments.
Fold change indicates the transcript ratios between 43894OW or 43894OR ΔcsgD compared to 43894OR as determined by real-time PCR.
Discussion
Comparative proteomic methods such as 2-D gel electrophoresis often suffer from reproducibility problems caused by gel-to-gel variation with regard to protein separation, distribution, and quantitation (Molloy et al., 2003; Aittokallio et al., 2005). The 2-D HPLC- mass spectrometry (MS) method resulted in limited issues with reproducibility, allowing a conservative approach of considering only protein data that appeared in all three experimental replicates and required three or more component peptides for positive protein identification, establishing a false protein discovery rate of <0.01%. Even with this conservative approach, 398 and 321 proteins were identified and quantified for strains 43894OW and 43894OR, respectively. However, 419 total proteins comprise a fraction of the 4000+ proteins E. coli is capable of producing, limiting the completeness of the proteomic comparison. Ongoing research is increasing the sensitivity of MS-based proteomic methods, with the goal of being able to analyze all proteins expressed in a proteome (Iwasaki et al., 2010; Tao et al., 2011). Regardless of the current shortcomings of proteomic assays, 419 proteins provide ample targets for further investigation of these variants. This is obvious in the data presented showing that GadA and GadB proteins, which contribute to acid tolerance, and are greatly upregulated in 43894OW (Castanie-Cornet et al., 1999; De Biase et al., 1999). Additionally, the 50- and 100-fold transcription differences between the two strains for gadA and gadB, respectively, confirm that this is an important regulation event for the bacteria and should be investigated.
This led to the discovery that 43894OR was significantly more sensitive to acid stress compared to 43894OW (Fig. 2). The protein data also built upon previous knowledge about the variant strains, specifically that 43894OR constitutively overexpressed csgD (Uhlich et al., 2002). This led to the construction of a csgD gene disruption mutant in 43894OR, which suggested that CsgD had a direct or indirect repressive effect on acid resistance, since 43894ORΔcsgD had the same survival in acidic conditions as 43894OW and was significantly different from the parent strain, 43894OR. Additionally, the 43894ORΔcsgD mutant demonstrated increased expression of the gadA and gadB genes, suggesting that CsgD expression represses GadA and GadB expression, making the pathogen more sensitive to acidic conditions. Since CsgD is responsible for the expression of the curli subunit, CsgA, it is possible to hypothesize that curli may have an effect on acid resistance and Gad expression. However, other investigators showed that CsgA expression had no effect on similar E. coli variant strains' acid resistance (Carter et al., 2011). This suggested an inverse relationship between CsgD-driven curli expression and Gad-mediated acid tolerance, allowing for bacterial acid tolerance during passage through acidic stomach environments where curli adherence would be inadvisable, followed by curli-assisted colonization within more hospitable environments where expression of acid tolerance genes might be a waste of resources.
Conclusions
Comparative proteomic assay provided biologically relevant data that predicted a difference in acid resistance between variant strains. This directed additional experiments that suggest a role for CsgD in the regulation of GadA and B expression.
Footnotes
Acknowledgments
We would like to thank Jonnee Almond and Amy Ream for technical assistance and Dr. John Phillips for statistical analysis. Additionally, we would like to thank Dr. Pina Fratamico for reviewing the manuscript.
Disclosure Statement
No competing financial interests exist.