




Abstract
Antimicrobial use in food animals may increase antimicrobial resistance in their enteric bacteria that can be transferred to human microbiome. Over 70% of U.S. beef feedlots use non-ionophore in-feed antimicrobials for animal disease control, treatment, or growth promotion. The fraction of feedlots feeding chlortetracycline (CTC), mostly for disease control but also for treatment, has increased since the mid-1990s to present. Quantitative information on the antimicrobial selective pressure on the enteric bacteria of cattle fed CTC is lacking. Hence, the purpose of this study was to develop a deterministic mathematical model of the pharmacokinetics of ingested CTC in a beef steer and estimate the concentration of antimicrobially active (undegraded) CTC in the animal's large intestine. To evaluate the fit of the model to existing data, we also estimated the CTC concentrations in the central circulation, and fresh and aging manure from the steer. The model accounted for CTC abiotic degradation while in the gastrointestinal tract, absorption into the central circulation and tissues, biliary and renal excretion, and removal from the intestine by defecation. The model included an increase in the large intestine volume as the steer grew. We estimated that during CTC feeding to a 300-kg steer for growth promotion, the maximal drug concentration in the large intestine was 0.3 μg/mL; during disease control it was 1.7 μg/mL; and during treatment it was 31.5 μg/mL. The estimated CTC concentrations in the central circulation and the steer's manure agreed reasonably well with published data.
Introduction
T
Non-ionophore in-feed antimicrobials in U. S. beef cattle are used mostly on feedlots. Only 16% of cow–calf operations use these antimicrobials (USDA APHIS, 2012) whereas 73% of feedlots do (USDA APHIS, 2013a), consistently over the last 16 years (USDA APHIS, 2013b). Of those feedlots, 67% administered these antimicrobials for <7 days (corresponds to ADT), 27% for 8–30 days (ADC), and 6% for >30 days (AGP) (USDA APHIS, 2013a). Increasing from 46% in 1994 (USDA, 1995), 72% of feedlots feeding these antimicrobials in 2011 fed chlortetracycline (CTC), with 18% of their cattle receiving it (USDA APHIS, 2013c). Of those feedlots in 2011, 75% fed CTC primarily for disease control, 24% for treatment, and 1% for growth promotion (USDA APHIS, 2013c).
CTC is mixed into the cattle daily ration or top-dressed; the two routes are bioequivalent in terms of the serum drug pharmacokinetics (FDA, 2002). We could not locate data on the effects of AGP dosage (Table 1) on bovine enteric bacteria, for which Escherichia coli is proposed as an indicator microorganism to ascertain the extent of antimicrobial resistance (Sharma et al., 2008). In cattle fed CTC for disease control or treatment (Table 1) (FDA, 2002; Gadberry, 2012), the phenotypic resistance to tetracyclines in fecal E. coli increases in degree and frequency (Alexander et al., 2008; Platt et al., 2008; Sharma et al., 2008). Remarkably, given the widespread drug use, the selective pressure posed on enteric bacteria—the concentration of antimicrobially active CTC in the bovine large intestine—has not been quantified. The pharmacokinetics of ingested CTC in cattle appears largely uninvestigated, with only two published studies in English: in Holstein steers and calves (Bradley et al., 1982; Reinbold et al., 2010). Neither investigated the intestinal drug concentrations. (Although a review prepared for the Food and Agriculture Organization, FAO, indicates unpublished industry studies in cattle in the 1960s–1990s [Wells RJ, Analytical Laboratories Australian Government, 1996]). Published pharmacokinetic information is available for intravenous CTC in dairy cows (Ziv and Sulman, 1974) and calves (Bradley et al., 1982), and CTC fed to swine (Nielsen and Gyrd-Hansen, 1996), dogs (Gray et al., 1953), rats (Johansson et al., 1953), and humans (Mcvay, 1952; Welch, 1950). We designed this study to estimate the plausible concentrations of CTC in the beef steer's large intestine when fed for AGP, ADC, and ADT.
CTC is also given to grazing cattle for control of anaplasmosis (FDA, 2006), but we focused on drug usages in feedlots.
Materials and Methods
We developed a deterministic mathematical model of pharmacokinetics of ingested CTC in a feedlot steer. We accounted for the drug's chemical degradation into antimicrobially inactive compounds while passing through the gastrointestinal (GI) tract, absorption into the central circulation and distribution to and from tissues, excretion via urine and bile, and removal from the intestine by defecation (Fig. 1). The large intestine's volume increased as the steer grew. The time unit was an hour.
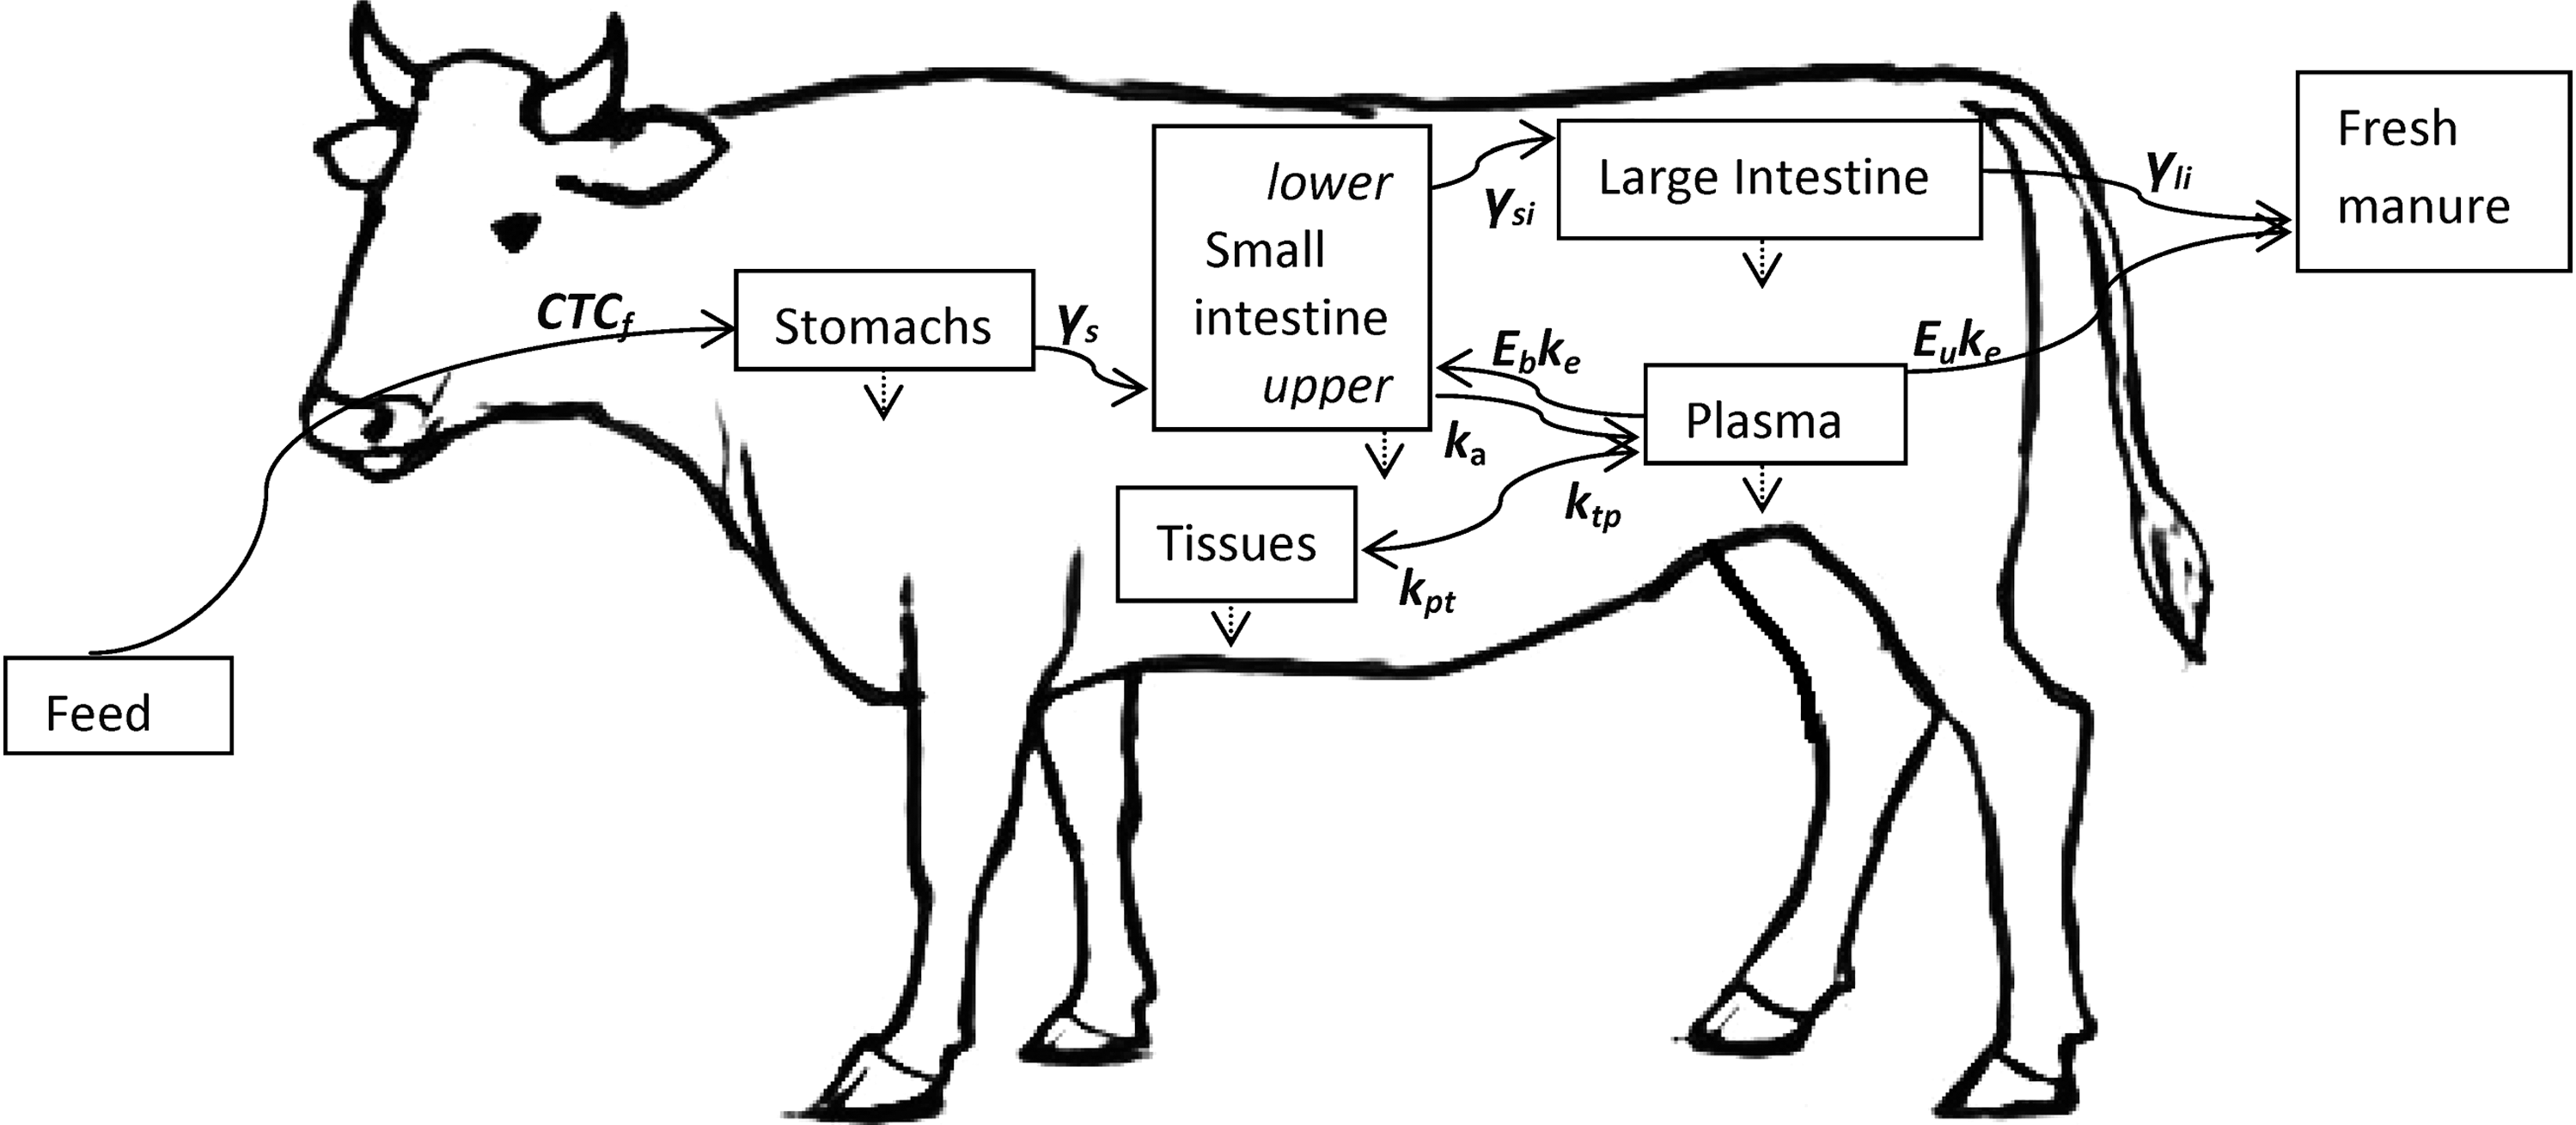
Schematic diagram of the model of pharmacokinetics of ingested chlortetracycline (CTC) in a beef steer. CTCf was the ingested CTC amount. The solid arrows show the flow of CTC between the compartments modeled, and the letters refer to the fractional flow rates. The dashed arrows represent CTC degradation that occurred at the rate δ in all the compartments.
Cattle growth
The steer grew from 12 to 18 months of age (Cattlemen's Beef Board, 2009). It entered at 300 kg (Cattlemen's Beef Board, 2009) and its body weight (bw, kg) increased according to a growth curve developed by Hassen et al. (2004), where T was the day in the feedlot:
The steer's large intestine volume, Vli
, was scaled to bw. Using a published model of how the weight of cattle GI tract increases with bw (Demment and van Soest, 1985), and assuming a weight-to-volume ratio of 1 for the luminal contents, and that the large intestine constituted 7.9% of the GI tract (Ensminger and Olentine, 1978), Vli
(L) was:
CTC feeding
We assumed CTC was mixed into the steer's daily ration and did not degrade in the feed. The daily dose was consumed in equal portions each hour during the 12-hour daytime. Top-dressing delivery was not investigated separately because of the bioequivalence of the two delivery routes (FDA, 2002). During each hour of daytime, the steer ingested CTC in the amount Cf_i specified by Equation 3 for each drug usage, i, in Table 1.
CTC degradation
The CTC pharmacokinetic parameters are listed in Table 2. The drug degrades in manure and the environment (Arikan, 2008; Arikan et al., 2009; Cessna et al., 2011; Dolliver et al., 2008; Soeborg et al., 2004). However, only a few studies have attempted to examine the degradation in an animal body (Eisner and Wulf, 1963), plasma, or animal products (Zurhelle et al., 2000). The degradation is an abiotic process: the dynamics are the same in nonsterilized and sterilized manure (Arikan et al., 2009). The drug degrades with first-order kinetics (Cessna et al., 2011; Dolliver et al., 2008) into two primary products: epi-chlortetracycline (ECTC) and iso-chlortetracycline (ICTC) (Eisner and Wulf, 1963; Halling-Sorensen et al., 2002). The latter is formed at pH 6.5–9 (Eisner and Wulf, 1963; Halling-Sorensen et al., 2002), whereas ECTC is the dominant epimer at acidic pH (Halling-Sorensen et al., 2002; Soeborg et al., 2004). The degradation is faster at pH>5 than at pH of 3–4 (Soeborg et al., 2004). The drug's chemical stability also decreases with increased temperature (Arikan et al., 2009; Halling-Sorensen et al., 2001). Both ECTC and ICTC have largely reduced antimicrobial activity compared to CTC (Halling-Sorensen et al., 2002); we assumed their antimicrobial activity was negligible. In a biological media at physiological temperature and pH>5, CTC degrades to ECTC at an estimated rate of 0.8 day−1 and minimal ICTC is found (Eisner and Wulf, 1963); such conditions are found in plasma and most of the ruminant GI tract, except the abomasum (Wheeler and Noller, 1977). This rate is within the published range for degradation in manure (Dolliver et al., 2008). Hence, the rate of CTC degradation to antimicrobially inactive compounds in the GI tract, plasma, and tissues was set at δ=0.0333 h−1.
CTC in stomachs
Concentrates, such as CTC, pass through the bovine GI tract at a speed between that of the solid and liquid phases of digesta (Shaver et al., 1986; Zebeli et al., 2007). The ingested CTC was ejected from the rumen to the small intestine at a rate γs
=0.0715 h−1 (Shaver et al., 1986; Zebeli et al., 2007). The change in CTC amount (mg) in the stomachs each hour was:
CTC in small intestine
Tetracyclines are absorbed primarily in the upper small intestine (Toutain et al., 2010). Such behavior of ingested drugs in humans has been modeled by considering the passage time and pharmacokinetic events in each part of the small intestine (Haruta et al., 2002; Kimura and Higaki, 2002). In the steer model, CTC was absorbed into plasma at a rate ka
=0.0478 h−1 (Reinbold et al., 2010) while in the upper one third part of the small intestine. CTC excreted from the central circulation in bile also entered the upper third of the small intestine in amount B (defined in Equation 8). The average CTC passage time through small intestine was 10.5 h (Martin et al., 1999). This was partitioned into passage through the upper one third at a rate γ
upper_si
=0.333 h−1, and through the rest of small intestine at a rate γ
rest_si
=0.133 h−1. The change in CTC amount (mg) in the upper third of the small intestine each hour was:
The change in CTC amount (mg) in the rest of small intestine each hour was:
CTC in circulation
CTC distributes to tissues within the mammalian body, with the largest deposition in liver, lungs, and kidney (Bradley et al., 1982; Percy and Black, 1988). In the steer model, CTC moved from plasma to tissues at rate kpt , and back into plasma at rate ktp . Two studies estimated these parameters in cows and calves (Bradley et al., 1982; Ziv and Sulman, 1974). One reported kpt>ktp (Bradley et al., 1982), whereas the other reported kpt<ktp (Ziv and Sulman, 1974). The two-compartment pharmacokinetic models of tetracycline in rabbits (Percy and Black, 1988), CTC in pigs (Kilroy et al., 1990), and oxytetracycline in newborn calves (Burrows et al., 1987) agree with kpt>ktp , which is also expectable for a liposoluble compound. We used kpt =0.750 h−1 and ktp=0.162 h−1, with the drug elimination from plasma at a rate ke =1.140 h−1 (Bradley et al., 1982).
CTC is excreted via both bile and urine (Eisner and Wulf, 1963; Agwuh and MacGowan, 2006). The fraction excreted via urine, Eu
=0.485, was estimated from the ratio of total excretion via urine and via bile (Eisner and Wulf, 1963). We assumed no delay between CTC entering the bloodstream and its elimination and excretion. The plasma volume, Vp
, was estimated assuming 57 mL of blood per kg bw (measured in 14–15-month-old cattle [Hansard et al., 1953]). The amount of CTC (milligrams) excreted via urine each hour was:
The amount of CTC excreted via bile (milligrams) each hour was:
The total change in CTC plasma concentration (mg/L) each hour was:
The serum concentration of unbound CTC was estimated from CTCp_conc assuming 81% drug binding to proteins. This was based on the average 69% CTC binding to serum proteins in dogs (Pindell et al., 1959), and that blood protein content in cattle is on average 1.17 of that in dogs (Windberger et al., 2003).
CTC in tissues
The change in CTC amount in tissues (milligrams) each hour was:
CTC in large intestine
The passage rate of CTC through large intestine was γ
li
=0.133 h−1 (Shaver et al., 1986). The change in CTC concentration (mg/L) in the large intestine each hour was:
CTC in feces, urine, and manure
The concentration of CTC in the steer's fresh feces was estimated by dividing the CTC concentration in the luminal contents at the end of passage by the feces volume produced each hour. The latter was scaled to bw assuming 0.001667 L of feces/kg bw/h (ASAE, 2005). The concentration of CTC in fresh urine was estimated by dividing the CTC amount eliminated from plasma into urine, assuming immediate excretion, by the urine volume produced each hour. The latter was scaled to bw assuming 0.00075 L of urine/kg bw/h (ASAE, 2005). The concentration of CTC in fresh manure was the weighted average of that in feces and urine. To compare the model outputs to field data, the accumulation of manure and of CTC in it over time were modeled, assuming none was present at the start. The CTC concentration in the aging manure was estimated with the CTC degradation rate in manure depending on the environmental temperature (corresponding to the conditions of field studies available for comparison).
Model implementation
Solutions of the model's ordinary differential equations were approximated numerically using the embedded fourth-order Runge-Kutta integration method implemented in Vensim® PLE (Ventana Systems, Inc., Harvard, MA). Figure 1 was prepared in Microsoft Office Word® 2007 software (Microsoft, Redmond, WA), and the other figures in SigmaPlot™ software (Systat Software, San Jose, CA).
Results
The estimated concentrations of antimicrobially active (undegraded) CTC in the beef steer's large intestine when fed for different usages are given in Figure 2, those in the steer's serum in Figure 3, and those in the fresh and accumulating manure in Figure 4.
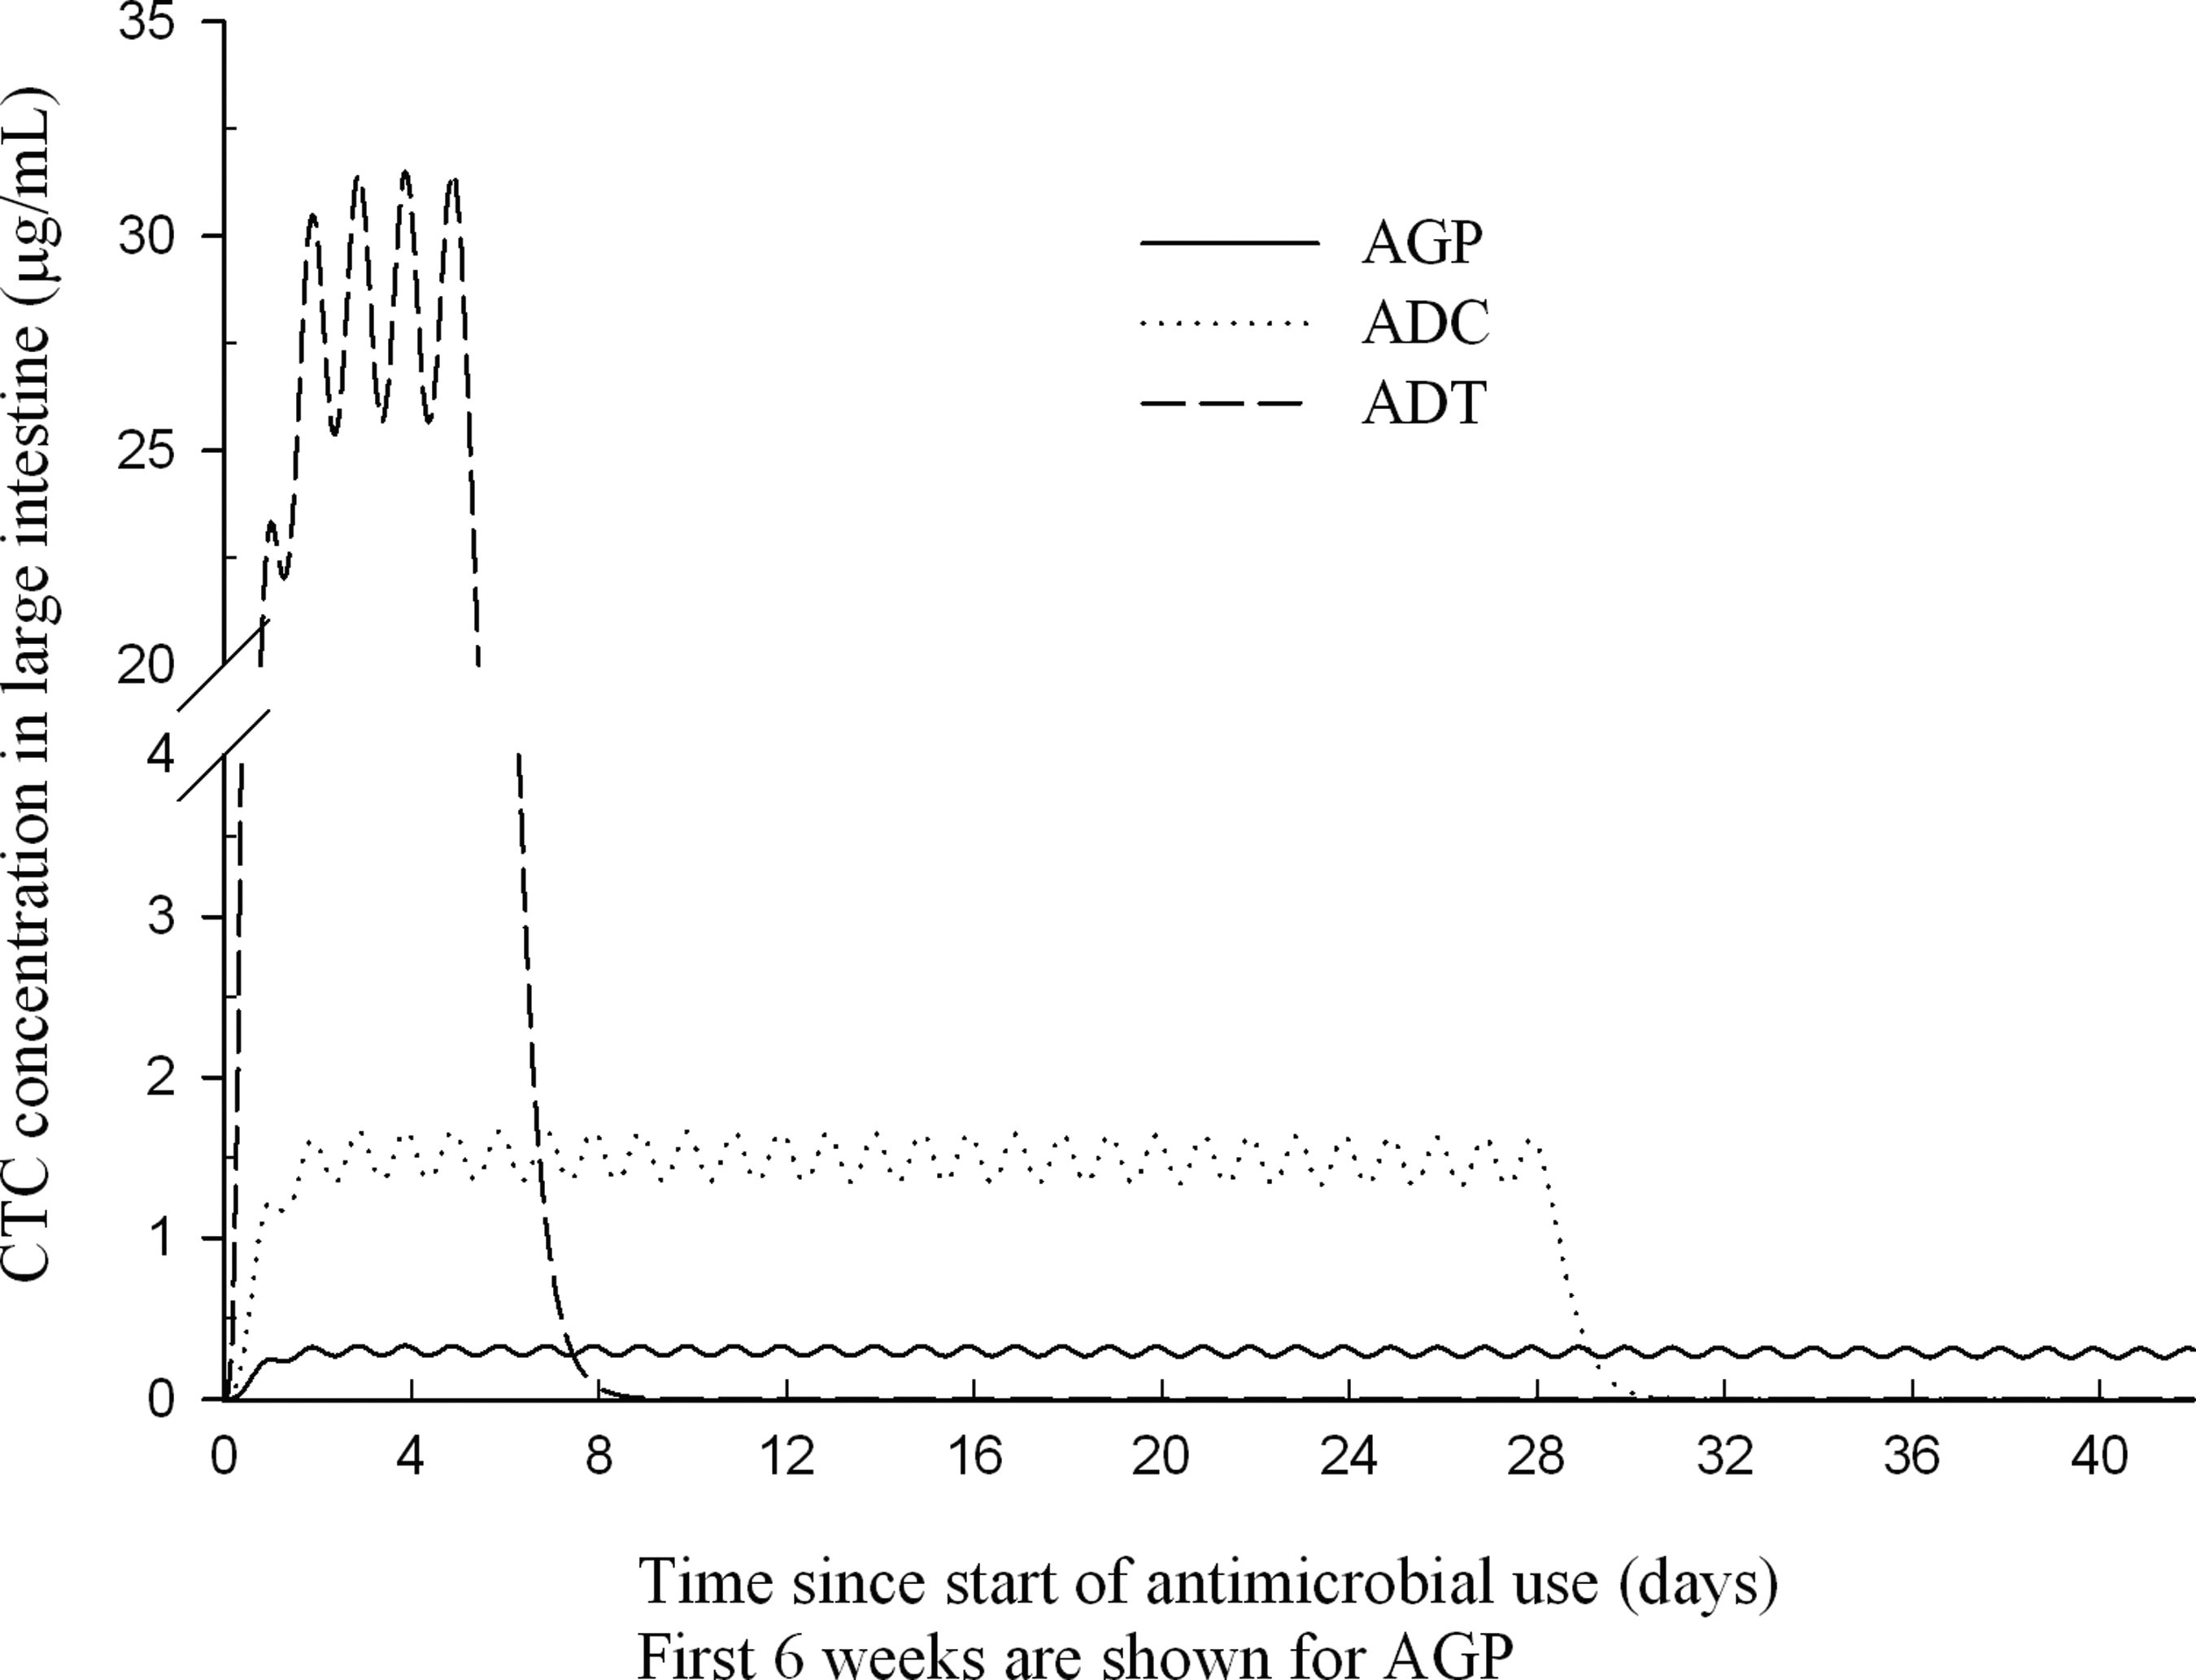
Concentration of antimicrobially active chlortetracycline (CTC) in the large intestine of a beef steer, when fed for antimicrobial growth promotion (AGP—dosage 70 mg/head/day throughout feedlot period), antimicrobial disease control (ADC—dosage 350 mg/head/day for 28 days), or antimicrobial disease treatment (ADT—dosage 22 mg/kg body weight/day for 5 days).
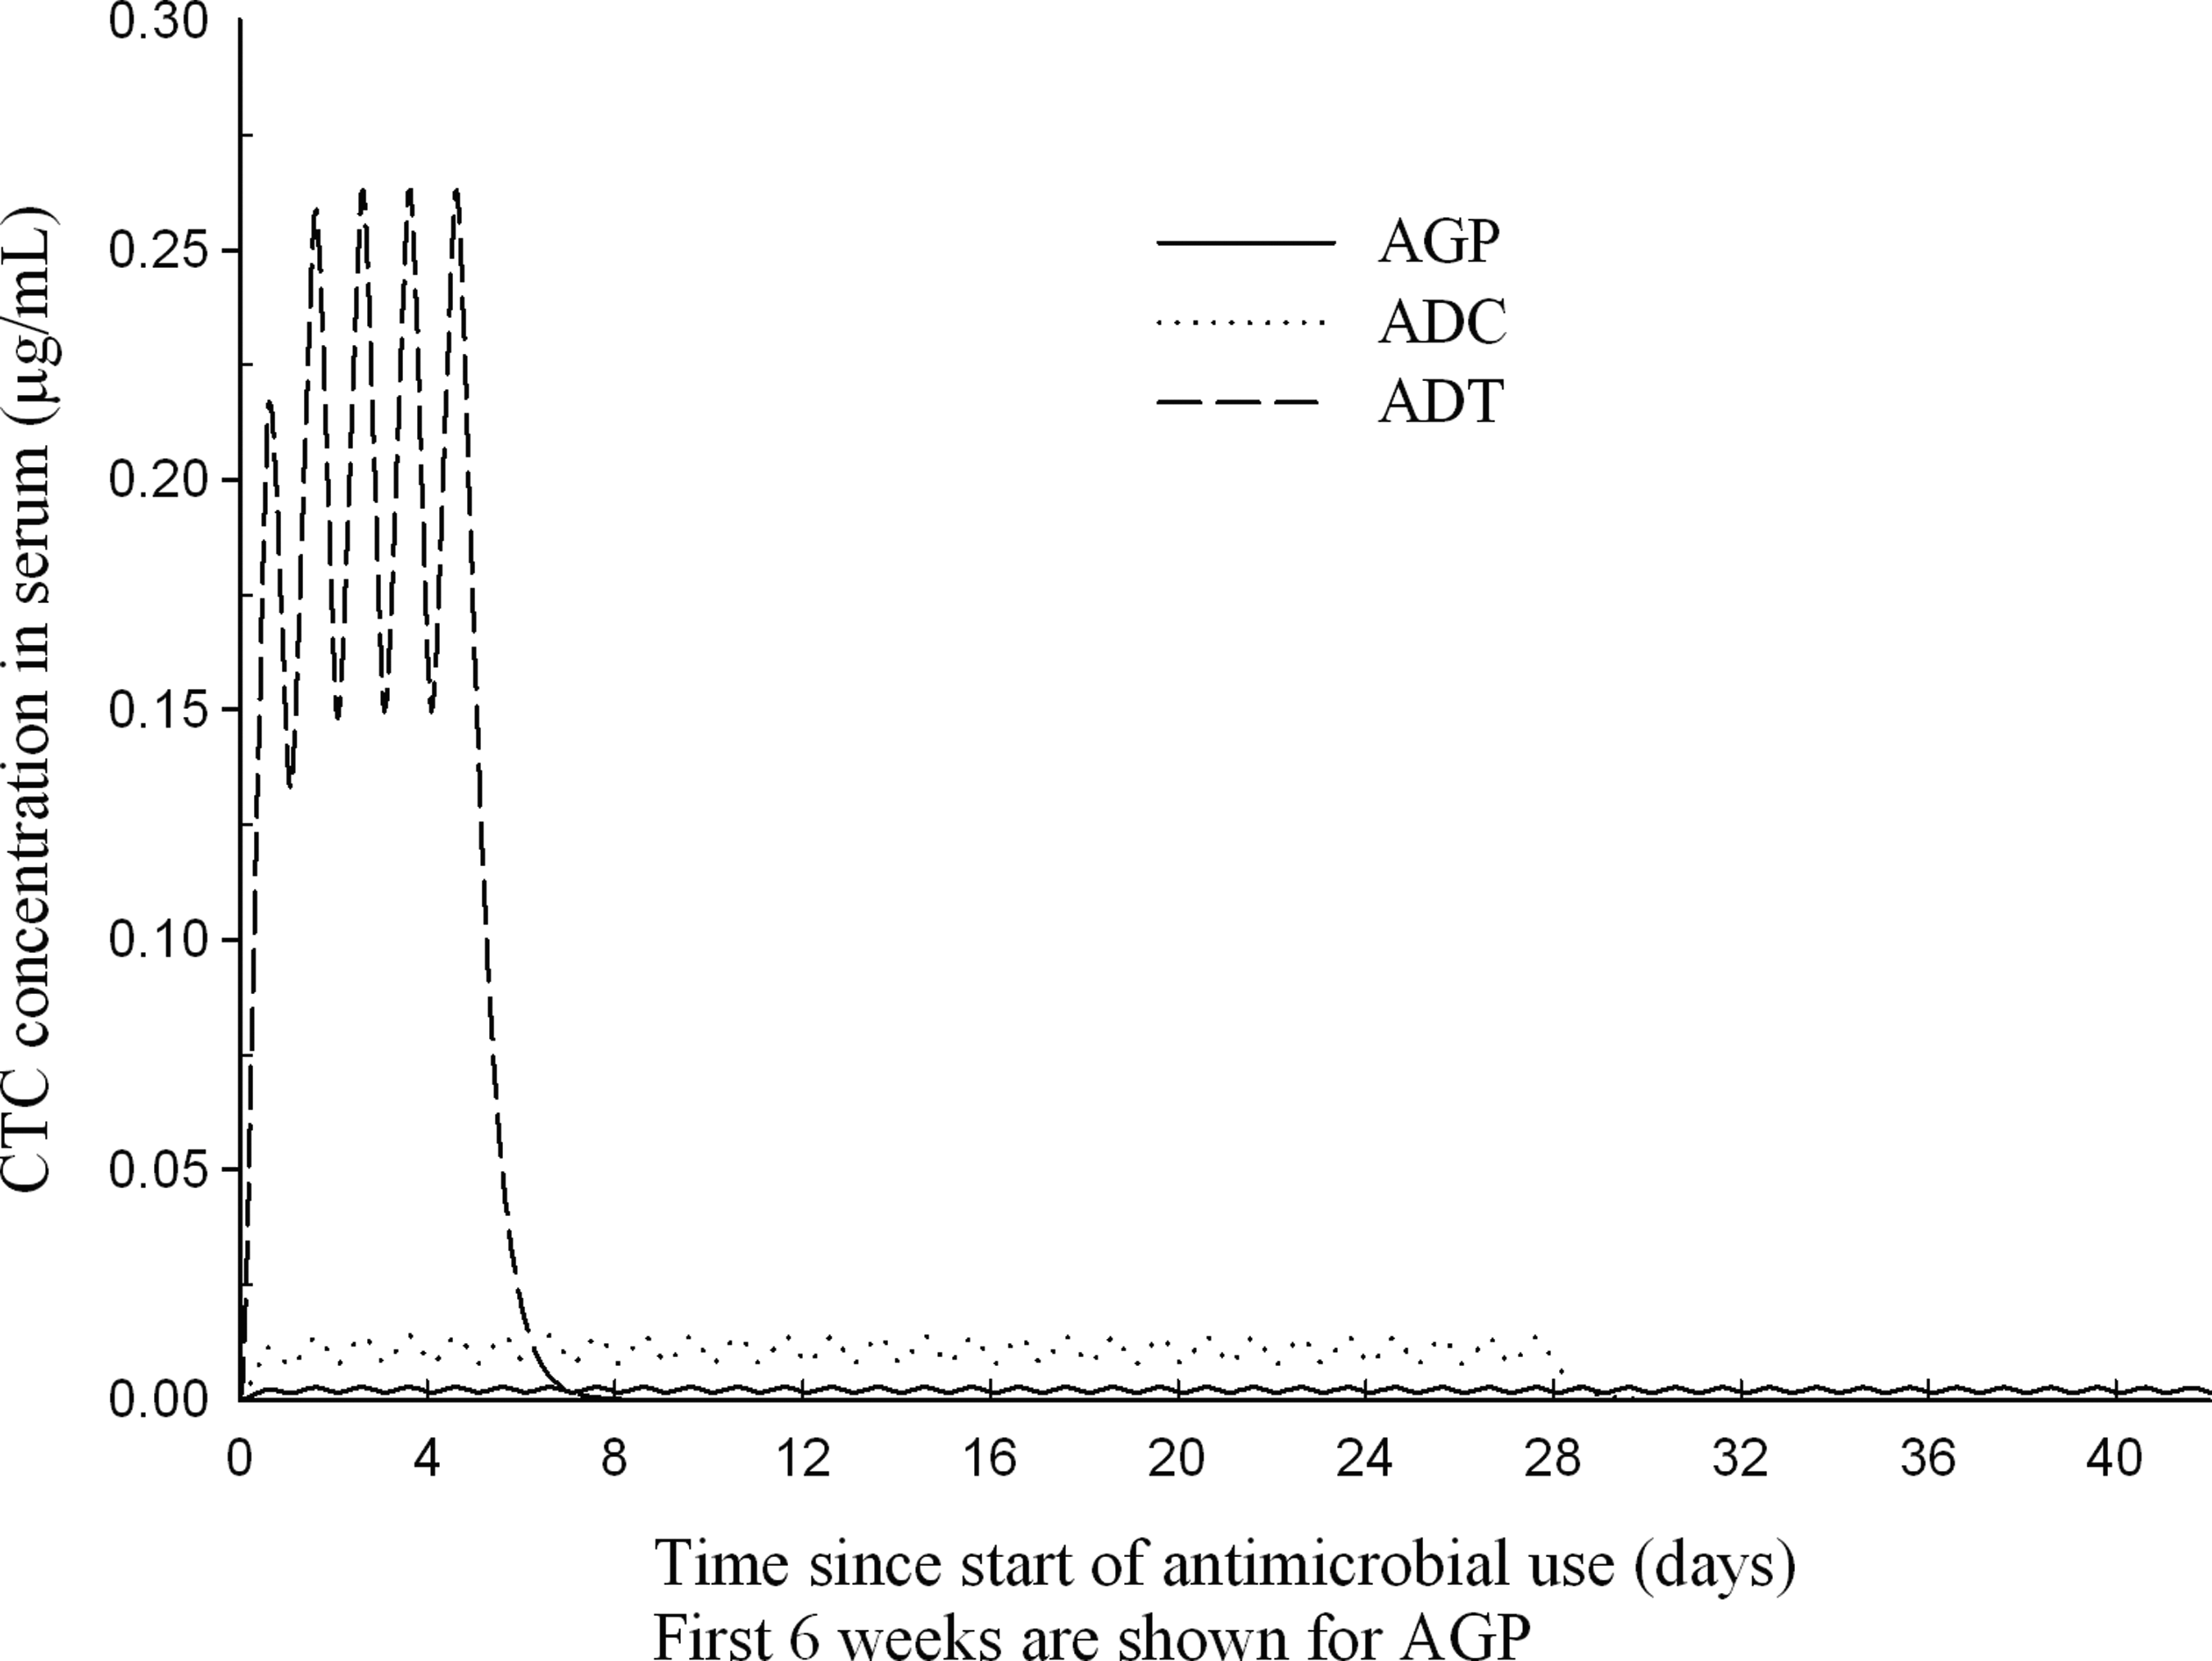
Concentration of antimicrobially active chlortetracycline in the beef steer's serum, when fed for antimicrobial growth promotion (AGP—dosage 70 mg/head/day throughout feedlot period), antimicrobial disease control (ADC—dosage 350 mg/head/day for 28 days), or antimicrobial disease treatment (ADT—dosage 22 mg/kg body weight/day for 5 days).
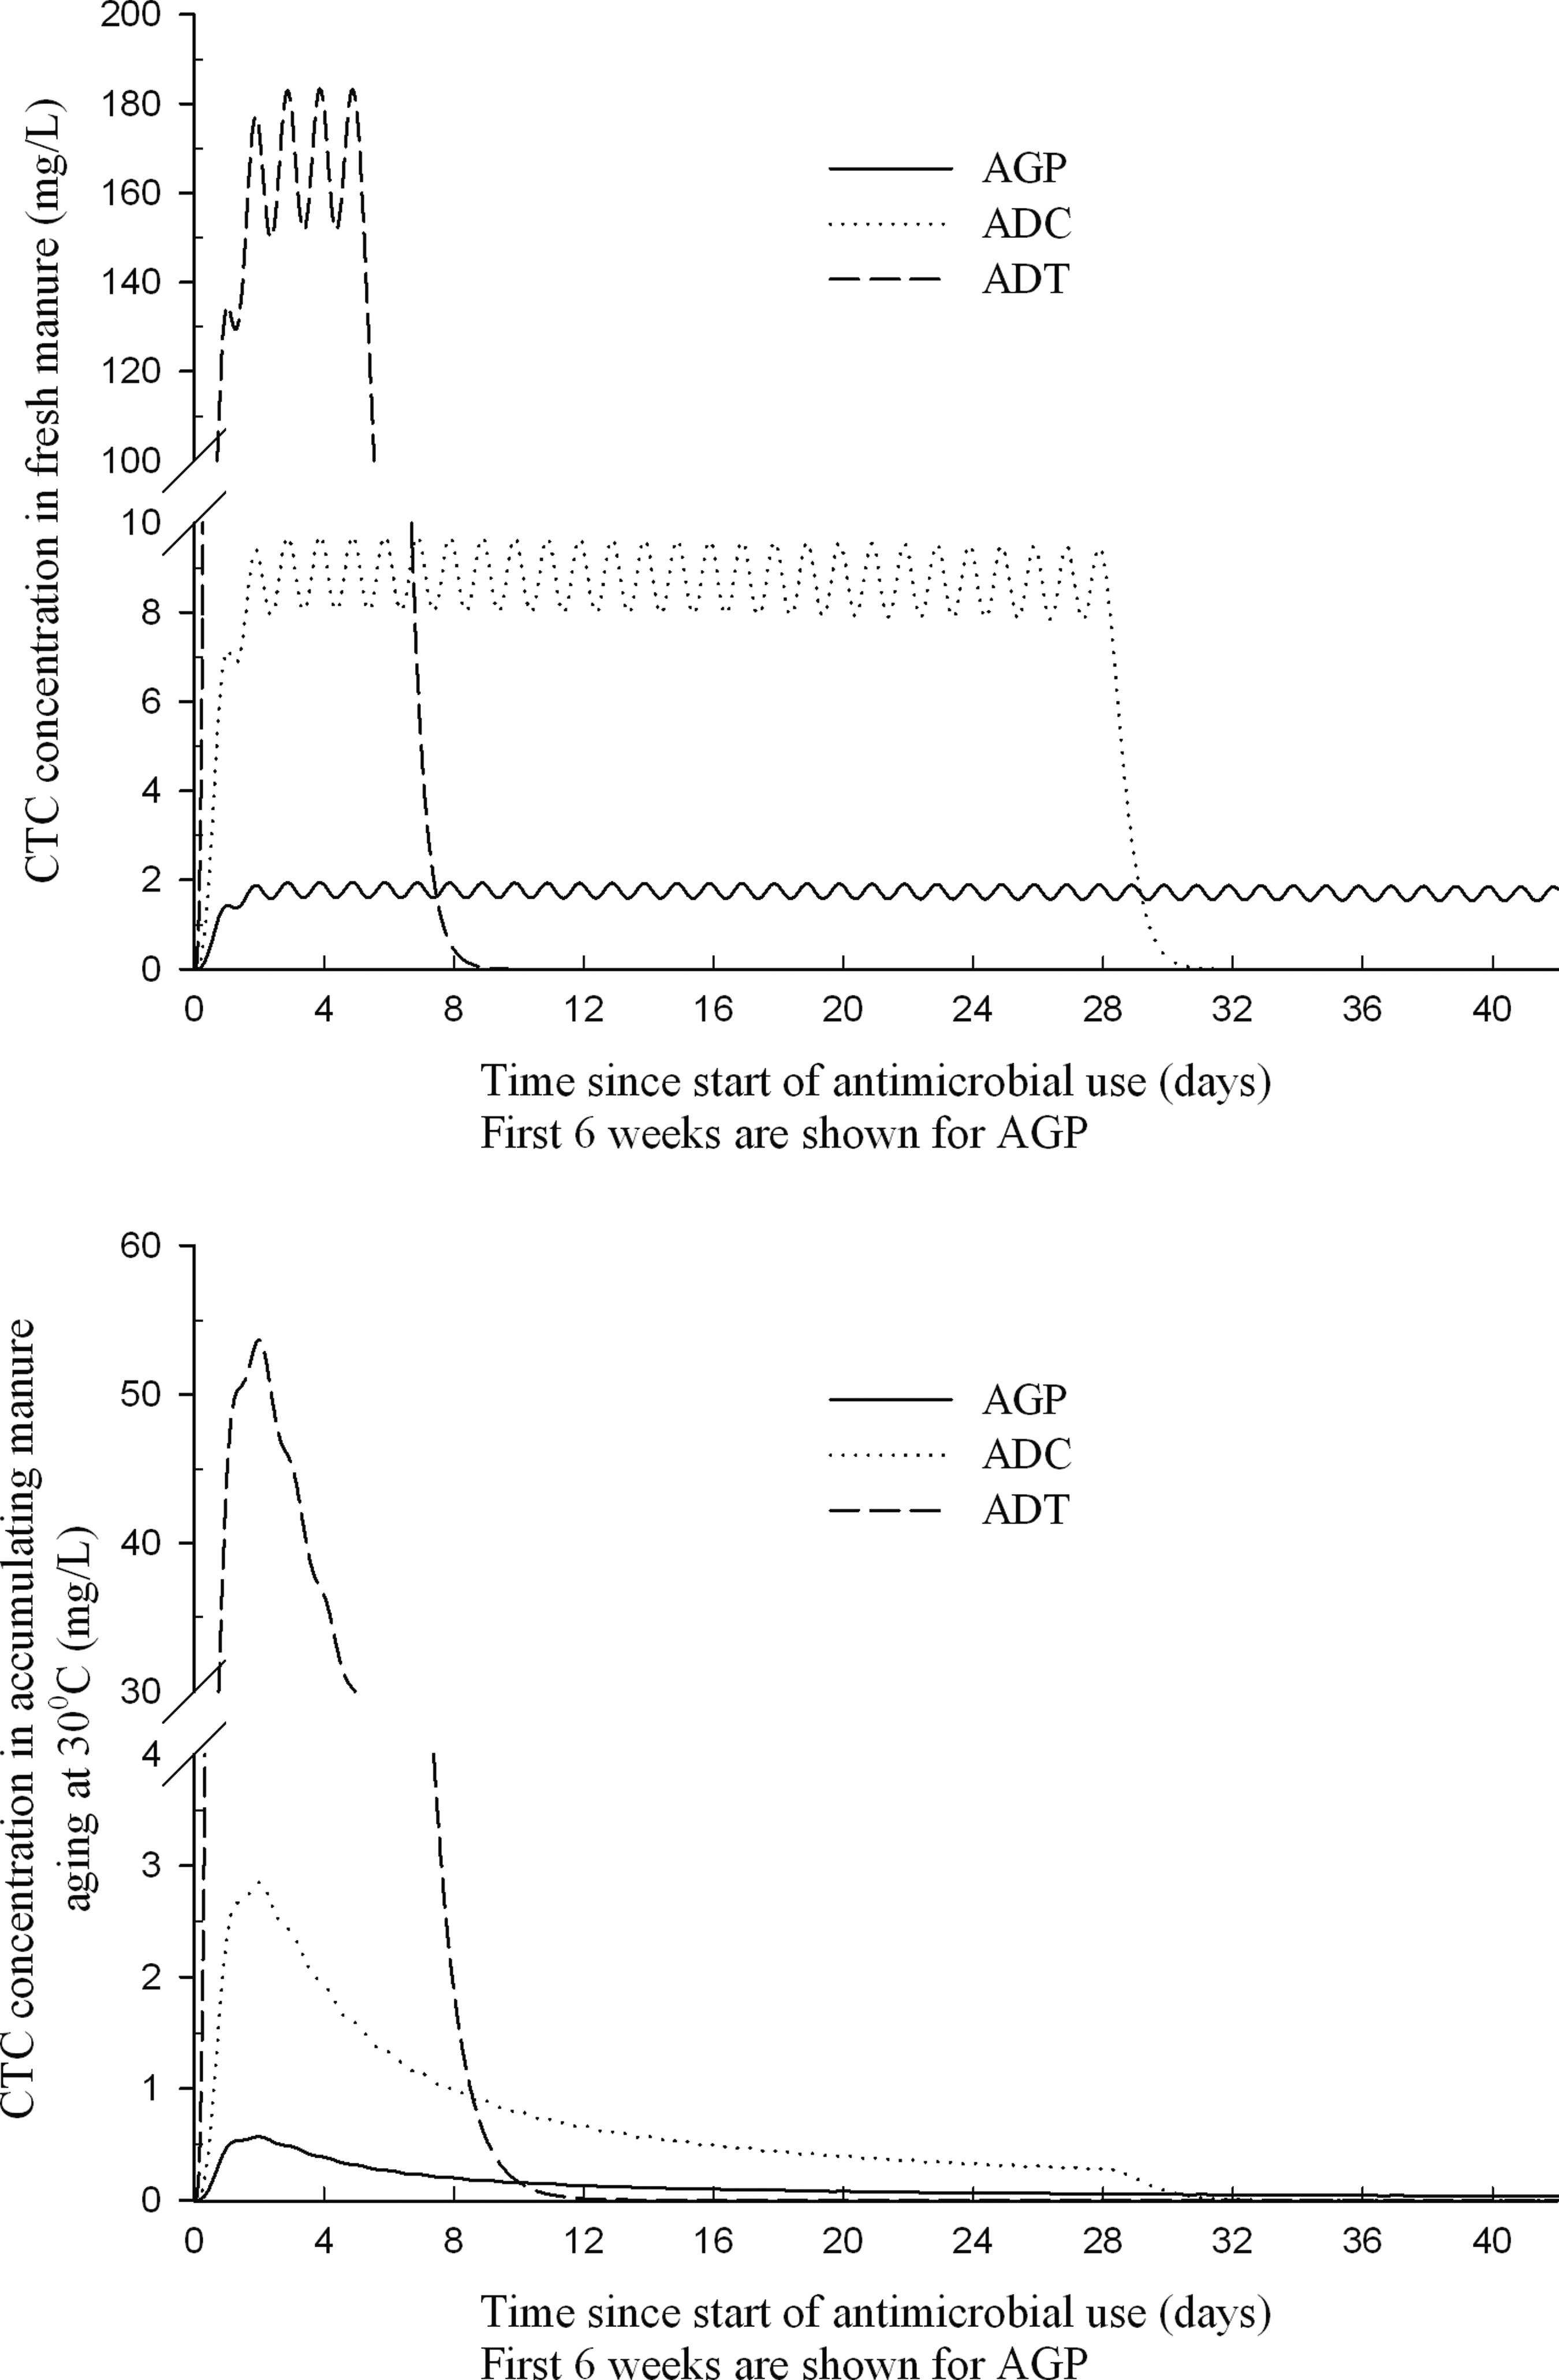
Concentration of antimicrobially active chlortetracycline (CTC) in the steer's fresh manure, and the accumulating manure aging at 30°C, when fed for antimicrobial growth promotion (AGP—dosage 70 mg/head/day throughout feedlot period), antimicrobial disease control (ADC—dosage 350 mg/head/day for 28 days), or antimicrobial disease treatment (ADT—dosage 22 mg/kg body weight/day for 5 days).
Discussion
The estimated maximal concentration of antimicrobially active (undegraded) CTC in the beef steer's large intestine when fed for ADT as 6600 mg/day (22 mg/kg bw/day, Table 1) was 31.5 μg/mL; when fed for ADC as 350 mg/day it was 1.7 μg/mL; and when fed for AGP as 70 mg/day it was 0.3 μg/mL. Since no field data were available on the CTC concentrations in the large intestine, the model outputs were validated against data for CTC concentrations in the steer's central circulation and the manure. The outputs agreed reasonably well with the data. The reported maximal concentration of unbound CTC in steer serum following the last 5th daily dose during ADT is 0.20–0.22 μg/mL within 10–11 h (FDA, 2002). The modeled concentration during the 5th day was 0.15 to 0.26 μg/mL with the maximum in 14–15 h (Fig. 3). The reported maximal total (bound and unbound) CTC plasma concentration of twice-daily measurements is 0.5 μg/mL in Holstein steers fed the ADT dosage as twice daily bolus in a feedlot setting (Reinbold et al., 2010). In our modeled continuous daytime feeding, such value between the 12th and 132nd hour of ADT ranged from 0.3 to 1.4 μg/mL. The dynamics of CTC in central circulation did not significantly affect the modeled intestinal concentrations (data not shown). This was consistent with the low CTC bioavailability in swine (Nielsen and Gyrd‐Hansen, 1996); no data were located for cattle.
The modeled CTC concentration in the aging manure from a 300-kg steer on the 5th day of ADT, with a CTC degradation rate of 0.047 h−1 as in a manure–soil mix at 30°C (Zhang and Zhang, 2010), was 31.6 mg/L (Fig. 4). This was close to 30.0 mg/L measured by drug chemical extraction from the manure–bedding mix in a study in Turkey (Arikan, 2008). Reproducing another experiment of feeding 100 mg CTC/head/day to a steer with starting bw=264 kg in the summer in Maryland, United States (Rumsey et al., 1977), using a CTC degradation rate of 0.020 h−1 that was in-between the rates at 18°C (Zhang and Zhang, 2010) and 10°C (Halling-Sorensen et al., 2001), the maximal modeled CTC concentration in the manure accumulating during the first 12 weeks of feeding was 1.3 mg/L. This was within the range of 1.1–1.8 mg/L measured by a bioassay in the field (Rumsey et al., 1977). However, during AGP with 70 mg/head/day the modeled maximal CTC concentration in fresh manure from a steer with starting bw=300 kg was 2 mg/L (Fig. 4), and 3 mg/L with bw=200 kg; this was lower than 14 mg/kg of manure measured in “yearling steers” by a bioassay (Elmund et al., 1971).
Studies in volunteers have estimated what fraction of ingested CTC appears in human feces. In one study, a bioassay detected 18–90% of the 250-mg single daily dose accumulating in the individual's feces over 72 h (Sweeney et al., 1957). In the modeled steer, 0.001% of such dose accumulated in feces. Given the degradation rate of 0.0333 h−1 in the steer's GI tract, most of the dose degraded to antimicrobially inactive compounds before being defecated. In another study, volunteers ingested 1, 2, or 3 g of CTC daily for 2 days, and the fecal drug concentration was measured from day 1 to day 5 (Mcvay, 1952). The fecal concentration was 0.3–5.1% of the daily dose. Implementing these scenarios for the steer in our model, the maximal fecal CTC concentration was 0.003–0.005% of the dose. That the fecal CTC concentration as a fraction of the once-per-day dose in the steer was low compared to humans is expected. The concentration is the ratio of the ingested CTC's active fraction reaching the large intestine to the large intestine's volume. Because of CTC abiotic degradation throughout the GI tract, a lower fraction will reach the intestine in active form in animals with a longer digesta passage time. The passage in cattle is longer compared to monogastric species, and the volume of the large intestine is larger; therefore, the concentration of active CTC in cattle feces as a fraction of ingested drug can be much lower than in monogastric species.
The accuracy of the model's estimates could be improved when several data gaps are filled. First, a more accurate estimate of the luminal content volume in the bovine large intestine is needed. Mathematical models of animal nutritional requirements consider the total GI tract capacity, but not the large intestine specifically. The growth of cattle body components is also described with allometric equations (Berg and Butterfield, 1976); however, we could not locate those for the GI tract. The closest data are allometric coefficients for the large intestine contents in lambs (Álvarez-Rodríguez et al., 2009), which produced unrealistic estimates for cattle (data not shown). Second, the CTC degradation kinetics in vivo have only been examined in rat and dog (Eisner and Wulf, 1963), and in chicken and its egg (Zurhelle et al., 2000). Having an estimate of the degradation rate in the bovine GI tract would greatly enhance the model's accuracy. Third, a fraction of the CTC reaching the large intestine may be bound to the digesta. Of tetracycline put into sterile rat feces, 11% was bioavailable (Bahl et al., 2004); no data were located for bovine feces.
The effects of exposure to low concentrations of antimicrobials in bacteria are complex (Gullberg et al., 2011; Tornqvist et al., 1990). To understand how the estimated low CTC concentrations act against the enteric microbiome, proper pharmacodynamic models need to be developed, considering a range of concentrations and durations of exposure. Our estimates can be validated in field experiments measuring CTC, and inactive epi- and iso-chlortetracyclines, in steer feces relative to the ingested CTC amounts. Animal diet and timing of CTC administration would need to be controlled. Such field studies can confirm the estimates or expose information that may be missing from the model.
Conclusions
To assess the selective pressure on enteric bacteria of beef feedlot cattle due to feeding CTC, we developed a model of the drug pharmacokinetics. When fed to a 300-kg steer for growth promotion, the estimated concentration of active (undegraded) CTC in the steer's large intestine was 0.3 μg/mL; for disease control it was 1.7 μg/mL; and for treatment it was 31.5 μg/mL.
Footnotes
Acknowledgments
This work was funded by the United States Department of Agriculture's National Institute of Food and Agriculture grant #2010-51110-21083. CLC was supported by Pfizer Inc. and Albert C. Bostwick Foundation through the Leadership Program for Veterinary Scholars at the Cornell University College of Veterinary Medicine.
Disclosure Statement
No competing financial interests exist.