
Abstract
The present article focuses on the inactivation kinetics of various disinfectants including ethanol, sodium hypochlorite, hydrogen peroxide, peracetic acid, and benzalkonium chloride against Aeromonas hydrophila biofilms and planktonic cells. Efficacy was determined by viable plate count and compared using a modified Weibull model. The removal of the biofilms matrix was determined by the crystal violet assay and was confirmed by field-emission scanning electron microscope. The results revealed that all the experimental data and calculated Weibull α (scale) and β (shape) parameters had a good fit, as the R2 values were between 0.88 and 0.99. Biofilms are more resistant to disinfectants than planktonic cells. Ethanol (70%) was the most effective in killing cells in the biofilms and significantly reduced (p<0.05) the biofilms matrix. The Weibull parameter b-value correlated (R2=0.6835) with the biofilms matrix removal. The present findings deduce that the Weibull model is suitable to determine biofilms matrix reduction as well as the effectiveness of chemical disinfectants on biofilms. The study showed that the Weibull model could successfully be used on food and food contact surfaces to determine the exact contact time for killing biofilms-forming foodborne pathogens.
Introduction
A
Biofilms are architecturally complex assemblies of microorganisms that can grow on either biotic or abiotic surfaces and interfaces. Biofilms are characterized by quorum-sensing mechanisms, with cells embedded in an extracellular polymeric matrix of microbial origin. Cells growing within the biofilms exhibit altered phenotypes with respect to growth rate and gene transcription (Bridier et al., 2011; Jahid and Ha, 2012). Like many other microorganisms, A. hydrophila also forms biofilms in the laboratory setting on stainless steel (Lynch et al., 2002), glass (Whiteley et al., 1997), and vegetables (Elhariry, 2011).
Cells within the biofilms are typically more resistant to antimicrobial agents, sanitizers, cleaning agents, and disinfectants (Bridier et al., 2011; Jahid and Ha, 2012). Bridier et al. (2011) noted that biofilms are up to 1000 times more resistant to disinfectants, depending on the species and disinfectant type. The proposed mechanisms behind the increased resistance of cells within biofilms compared to their planktonic counterparts might be due to the restricted penetration of biofilms and the distinct environmental and bacterial population heterogeneity (slow growth) (Bridier et al., 2011). Biofilms matrix might create layers that are resistant to the penetration of sanitizers and disinfectants (Toté et al., 2010; Bridier et al., 2011).
It is common to use first-order kinetics to compare the efficacy of different disinfectants due to its simplicity; however, this method is only valid when the inactivation is linear. In reality, most inactivation kinetics are nonlinear (van Boekel, 2002). Hence, many nonlinear models such as the logistic model (Cole et al., 1993), the modified Gomperts equation (Veen and Abee, 2011), the Fermi equation (Peleg, 1996), and the Weibull model (van Boekel, 2002) have been applied to understand the inactivation kinetics of different disinfectants on food and food-contact surfaces. Therefore, the aim of the present study was to assess disinfectant efficacy of commonly used chemicals such as ethanol (EtOH), sodium hypochlorite (NaOCl), hydrogen peroxide (H2O2), peracetic acid (PAA), and benzalkonium chloride (BAC) against A. hydrophila planktonic cells and biofilms using the Weibull method.
Materials and Methods
Bacterial strains and growth conditions
Four A. hydrophila strains were used in a cocktail to form biofilms and undergo disinfectant challenge. A. hydrophila KCTC 2358 (food isolate), KCTC 12487 (food isolate), KCTC 11533 (isolated from surface water), and KCCM 32586 (a clinical isolate) were the strains used. Cells were incubated at 30°C unless otherwise indicated. Unless noted, identical procedures were applied for both biofilms and planktonic cells. Prior to each experiment, the cultures were grown from−70°C freezer stocks on nutrient agar plates at 30°C overnight. A single colony from the plate was inoculated in 5 mL nutrient broth (NB) (Difco™ NB broth; Becton Dickinson, Franklin Lakes, NJ) and incubated at 30°C for 48 h without shaking.
Disinfectants and doses
Disinfectants used in the present study included EtOH (99% vol/vol, Korea ethanol Supplies Co., Seoul, Korea), NaOCl (12% vol/vol, Yakuri Pure Chemicals Co. Ltd., Kyoto, Japan), H2O2 (28% wt/vol, Duksan Pure Chemical Co. Ltd., Kyungkido, Korea), PAA (32% wt/vol, Sigma Aldrich Inc., St. Louis, MO), and BAC (50% wt/vol, Sigma). A working solution was prepared using sterile double-distilled water, and the solutions were always prepared immediately before use from the stock solutions.
Planktonic disinfectant challenge
For planktonic cells, the bacteria were incubated statically in a 50-mL Falcon tube (SPL Life Science Co., Ltd., Gyenggi-Do, Korea) containing 5 mL NB for 5 d at 30°C. A 100-μL planktonic suspension (log 6–7 colony-forming units [CFU]/mL) aliquot was exposed to 900 μL disinfectant at the specified concentrations and treatment times and held at a temperature of 25°C according to the European standard (Anonymous, 2009). After the appropriate exposure time, 100 μL of cells with disinfectants were transferred to 900 μL of selected neutralizer broth and held for 5 min.
Biofilms disinfectant challenge
The disinfectant susceptibility of biofilms grown on the wells of microtiter plates was tested by a modified version of the European surface test (Anonymous, 2009). To prepare biofilms, we used the procedure described by O'Toole (2011) with a few modifications. In brief, the four A. hydrophila strains were mixed in equal numbers based on the same optical density (OD) measured at 600 nm and biofilms were grown with the cocktail at a 1:50 dilution in 96-well microtiter plates (Becton Dickinson Labware, Becton, Dickinson and Company), with each well containing 100 μL broth. The plates were incubated at 30°C for 5 d under aerobically static conditions. The broth was then removed and washed with sterile phosphate-buffered saline (PBS; pH 7.2), and the remaining cells were then challenged with 200 μL disinfectants.
Neutralization broth
The neutralizers were used at a ratio of 9:1 to stop the antimicrobial action of the disinfectants. The neutralizing agents used for the present study were made as previously described for EtOH (Ha and Ha, 2010), for NaOCl (Møretrø et al., 2009), for BAC (Ibusquiza et al., 2011), and for H2O2 and PAA using the BAC neutralizer with 0.02% catalase (Sigma) (Hughes and Kilvington, 2001).
Swab technique and bacterial enumeration
The swab technique was performed as described previously (Luppens et al., 2002). The swab tips were then broken and placed in a test tube and vortexed to remove the cells. A 10-fold serial dilution of neutralization broth with the bacteria was made in 0.1% (wt/vol) peptone water and plated on R2A plates (Difco). Bacterial colonies were enumerated after 48 h and incubated at 30°C.
Quantification of biofilms matrix removal
Quantification of biofilms formation grown on polystyrene microtiter plates was measured as previously described with minor modifications (O'Toole, 2011) in 12-well microtiter plates (Becton Dickinson Labware), with each well containing 3 mL broth that was incubated for 5 d at 30°C. The biofilms growth medium was removed, washed with sterile PBS, and 5 mL of the appropriate disinfectant concentration were added to the wells for 5 min. Biofilms formation index (BFI) was determined using the equation normalized to planktonic growth according to Teh et al. (2010).
Field-emission scanning electron microscope (FESEM) for disinfectant efficacy
The A. hydrophila cocktail biofilms were formed as described with minor modifications (O'Toole, 2011). Briefly, the biofilms were treated with the disinfectant challenge for 5 min in 12-well microtiter plates, and FESEM was done according to the procedures described by Jahid et al. (2014).
Nonlinear regression
Survival curves were plotted by the logarithm of surviving cells versus contact time. To determine the inactivation kinetics, a modified Weibull model was used to fit the data using the following equation (van Boekel, 2002; Couvert et al., 2005):
However, several authors (Peleg, 1999; Buzrul et al., 2005) prefer to write the equation (2) in the following manner:
The b-value is analogous to D-value of first log reduction by thermal processing.
This equation (3) was used to correlate the BFI reduction and b-value.
Statistical data processing
The Weibull model was fitted in GraphPad Prism 5 (GraphPad Software Inc., San Diego, CA) by minimizing the residual sum of squares. The removal of biofilms as assessed by CV staining was analyzed by one-way analysis of variance using SAS software version 9.1 (SAS Institute Inc., Cary, NC) followed by Duncan's multiple-range test. A p-value<0.05 was considered statistically significant. Determination of the b-value and correlation with BFI reduction were performed using Microsoft Excel 2007.
Results
Inactivation kinetics of planktonic cells and biofilms susceptibility by disinfectants
The inactivation curves of both planktonic cells and biofilms were fitted with the modified Weibull model, and parameters were predicted using the equation for determining the efficacy of disinfectants. Table 1 shows the estimation of the N0, α, and β parameters with the corresponding 95% confidence limits, with the R2 indicating the goodness of the fit for A. hydrophila planktonic cells and biofilms. Our results demonstrated that planktonic cells showed higher susceptibility than biofilms for the same disinfectant concentrations (Table 1). Since the R2 values were between 0.88 and 0.99, the agreement between the experimental data and the calculated values for the Weibull model were a good fit for the biofilms and planktonic cells through the variation of α and β parameters. However, in all cases, planktonic cells were identified as having lower resistance than biofilms populations, as reflected by the lower scale (α) and higher shape (β) parameters (Table 1). EtOH (25%), H2O2 (500 ppm and 1500 ppm), and PAA (10 ppm and 25 ppm) resulted in a linear relationship and the β parameter was 1 for planktonic cells. All other concentrations of planktonic cells and biofilms showed inactivation kinetics that were concave upward (β<1.0), indicating the presence of tailing and the ability to adapt to chemical disinfectants (Fig. 1A–J). The initial level of all inoculated bacteria was approximately 6.0–7.0 log CFU/mL for planktonic cells and 5.5–6.5 log CFU/g for biofilms (Table 1). The survival curve shapes were very similar, and were characterized by an initial drop followed by a tailing due to disinfectant resistance. The microbial inactivation also increased with contact time and concentration.
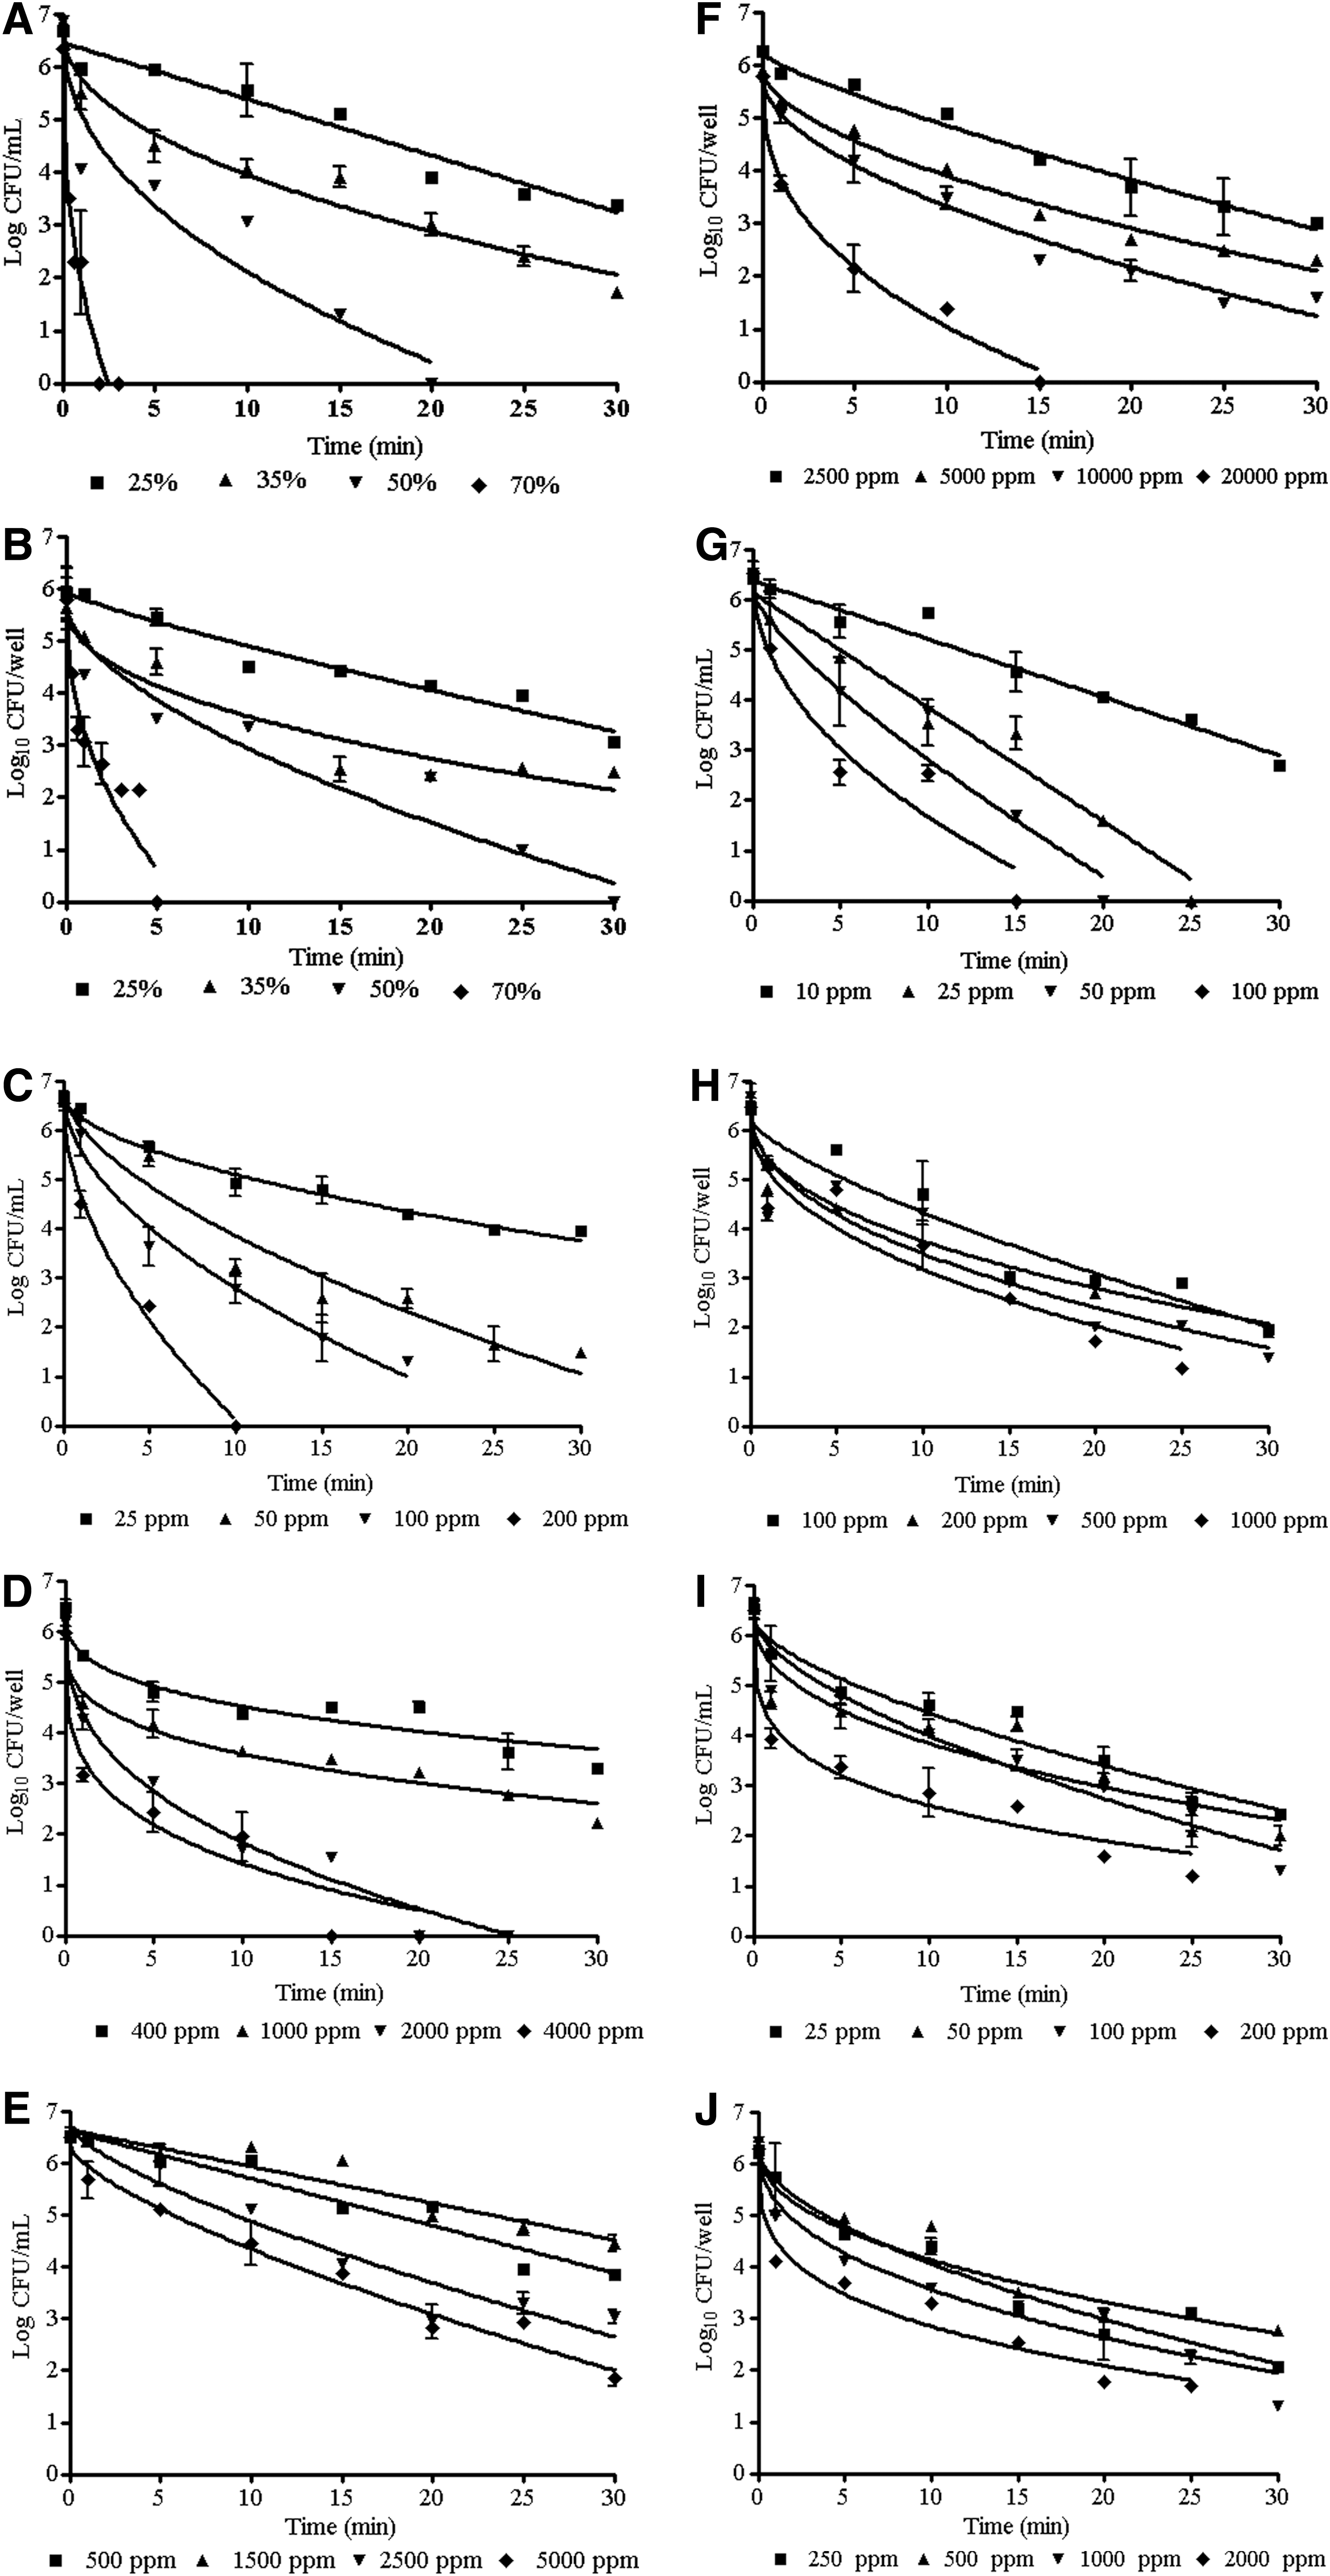
Survival curves of Aeromonas hydrophila biofilms and planktonic cells treated with different disinfectants. The figure shows the mean log values of three independent experiments fitted by the modified Weibull model.
EtOH, ethanol; NaOCl, sodium hypochlorite; H2O2, hydrogen peroxide; PAA, peracetic acid; BAC, benzalkonium chloride.
The experimental data showed that EtOH at 50% and 70% both showed a 5-log reduction in both population types (Fig. 1A and B), although the biofilms showed a significantly higher resistance to EtOH than planktonic cells (p<0.05, Table 1). The scale (α) and shape (β) parameters were significantly higher for biofilms than planktonic cells. The experimental data reveal that 50% EtOH reduced planktonic cells (Fig. 1A) and biofilms (Fig. 1B) by 5 log after 20-min and 30-min treatment, respectively. More interestingly, 70% EtOH achieved a 5-log reduction for planktonic cells and biofilms with 5.0-min and 1.0-min treatment, respectively (Fig. 1A and B). An approximately 5-log CFU/mL reduction in planktonic cells was achieved by treatment with 50, 100, and 200 ppm of NaCl for 30, 20, and 15 min, respectively (Fig. 1C). A reduction of 5 log CFU/g was obtained in biofilms by treatment with 2000 and 4000 ppm of NaCl for 20 and 15 min, respectively (Fig. 1D).
Statistical analysis indicates that both planktonic cells and biofilms were resistant to H2O2 at the same concentrations (2500 and 5000 ppm, p<0.05) (Fig. 1E and F). A 3.2, 3.6, and 4.1 log CFU/g reduction in biofilms was achieved after treatment for 30 min with 2500, 5000, and 10,000 ppm, respectively (Fig. 1F). For planktonic cells, 2500 ppm reduced cell numbers by 3.5 and 4.6 log CFU/mL for the same treatment duration (Fig. 1E). The experimental data demonstrate that as the concentration increased from 100 to 1000 ppm, 500 ppm and 1000 ppm levels induced a 5-log CFU/mL reduction in biofilms for 30 and 25 min, respectively, for biofilms (Fig. 1H), but for planktonic inactivation, 50 ppm was found to be effective to achieve a 5-log reduction within 20 min (Fig. 1G).
Not surprisingly, BAC also showed the same resistance pattern with biofilms as seen with H2O2 (Fig. 1I and J). Biofilms did not decrease with the increase in treatment time and concentration (Fig. 1J), while in planktonic cells, increases in concentration and treatment time significantly (p<0.05) decreased cell viability (Fig. 1I). The experimental data showed that 200 ppm of BAC produced a 5-log reduction of planktonic cells, while 2000 ppm was required for a similar reduction in biofilms; therefore, the biofilms are 10-fold more resistant relative to planktonic cells.
Remaining biofilms matrix
The biofilms matrix removed by different disinfectants were evaluated using a CV assay and it was demonstrated that higher concentrations of disinfectants significantly removed biofilms matrix (p<0.05, Fig. 2). The effect of different treatments on the reduction of total biofilms matrix showed that a large reduction (>35%) was achieved by treatment with ≥50% EtOH, ≥1000 ppm NaOCl, 2000 ppm BAC, and 1000 ppm PAA. H2O2 showed a lower prevention in biofilms matrix at any concentration (Fig. 2).
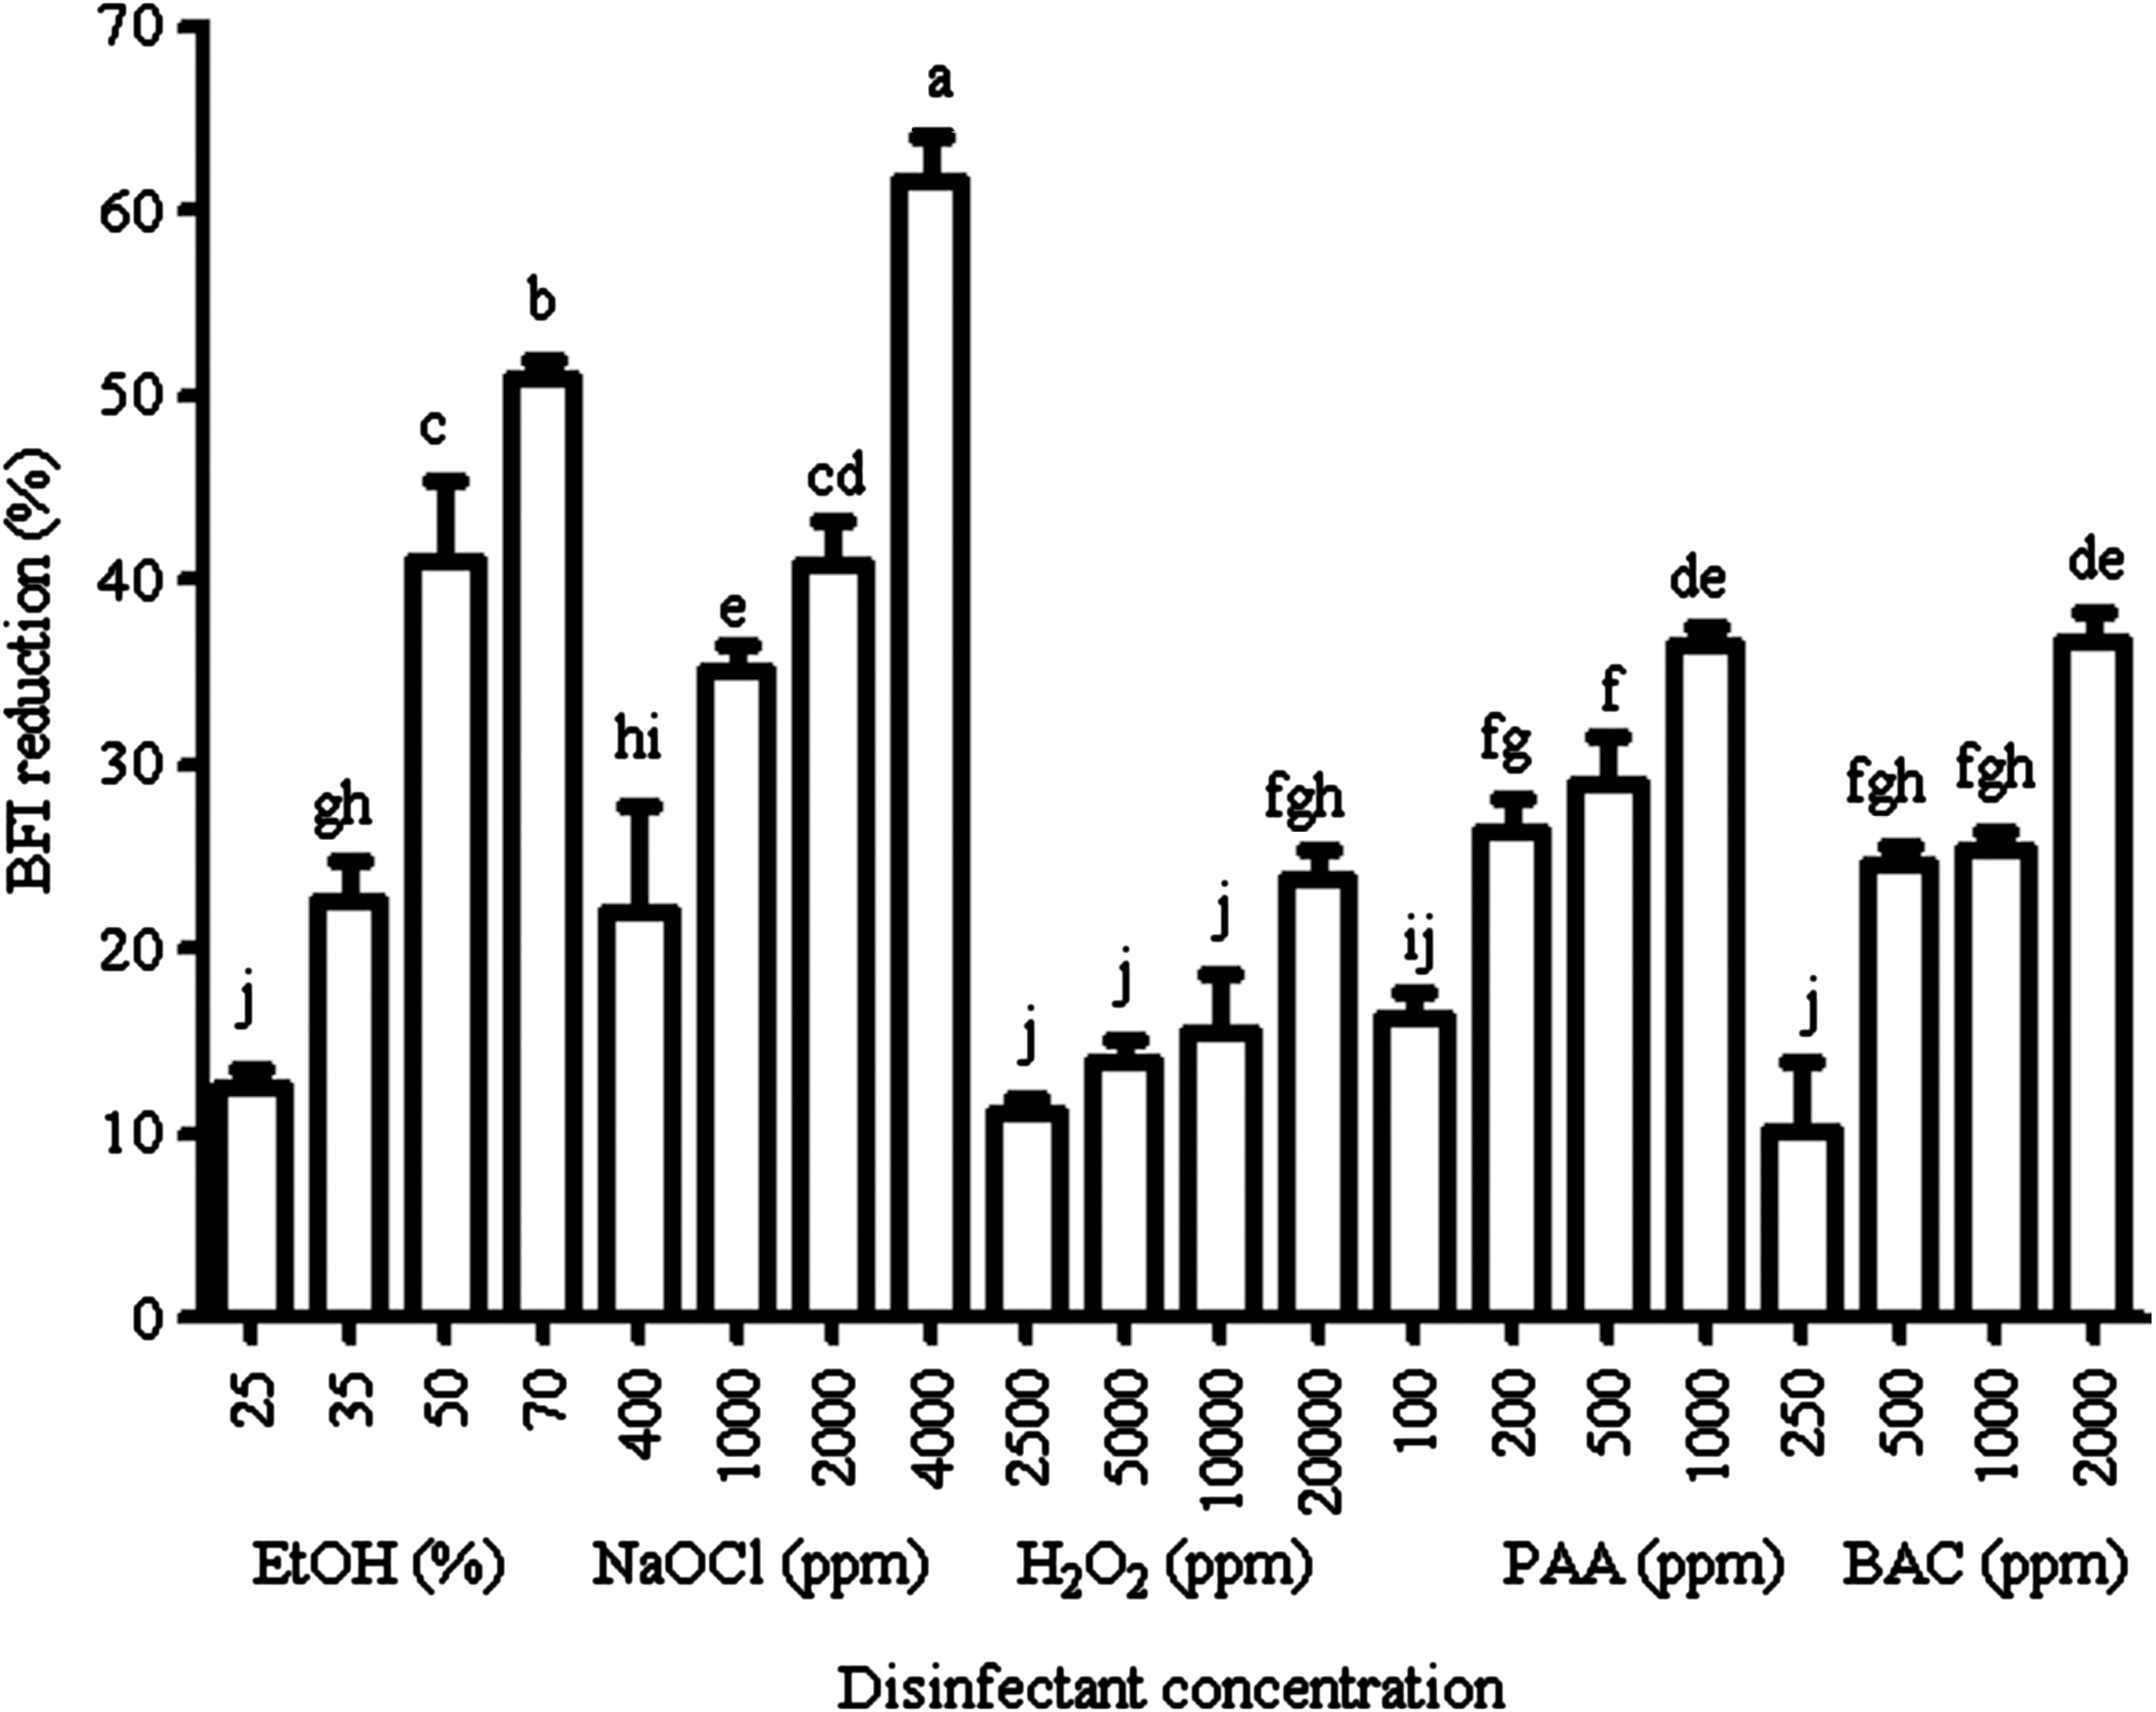
Efficacy of various disinfectant treatments on the removal of Aeromonas hydrophila biofilms matrix. The histogram values shown are the mean±standard error of mean of three independent experiments. Within each variable, values with the same letter are not significantly different according to Duncan's multiple-range test (p>0.05). BFI, biofilm formation index; EtOH, ethanol; NaOCl, sodium hypochlorite; H2O2, hydrogen peroxide; PAA, peracetic acid; BAC, benzalkonium chloride.
Relationship between b-value and BFI reduction
Figure 3 shows the relationship between b-value and BFI reduction of biofilms matrix using various disinfectants. In the range of b-values obtained by the Weibull model, a linear relationship (R2=0.6835) was found with BFI reduction. The relationship was positively correlated as shown in Figure 3. Here, we revealed a positive correlation between BFI and b-value of the linear equation as shown below:
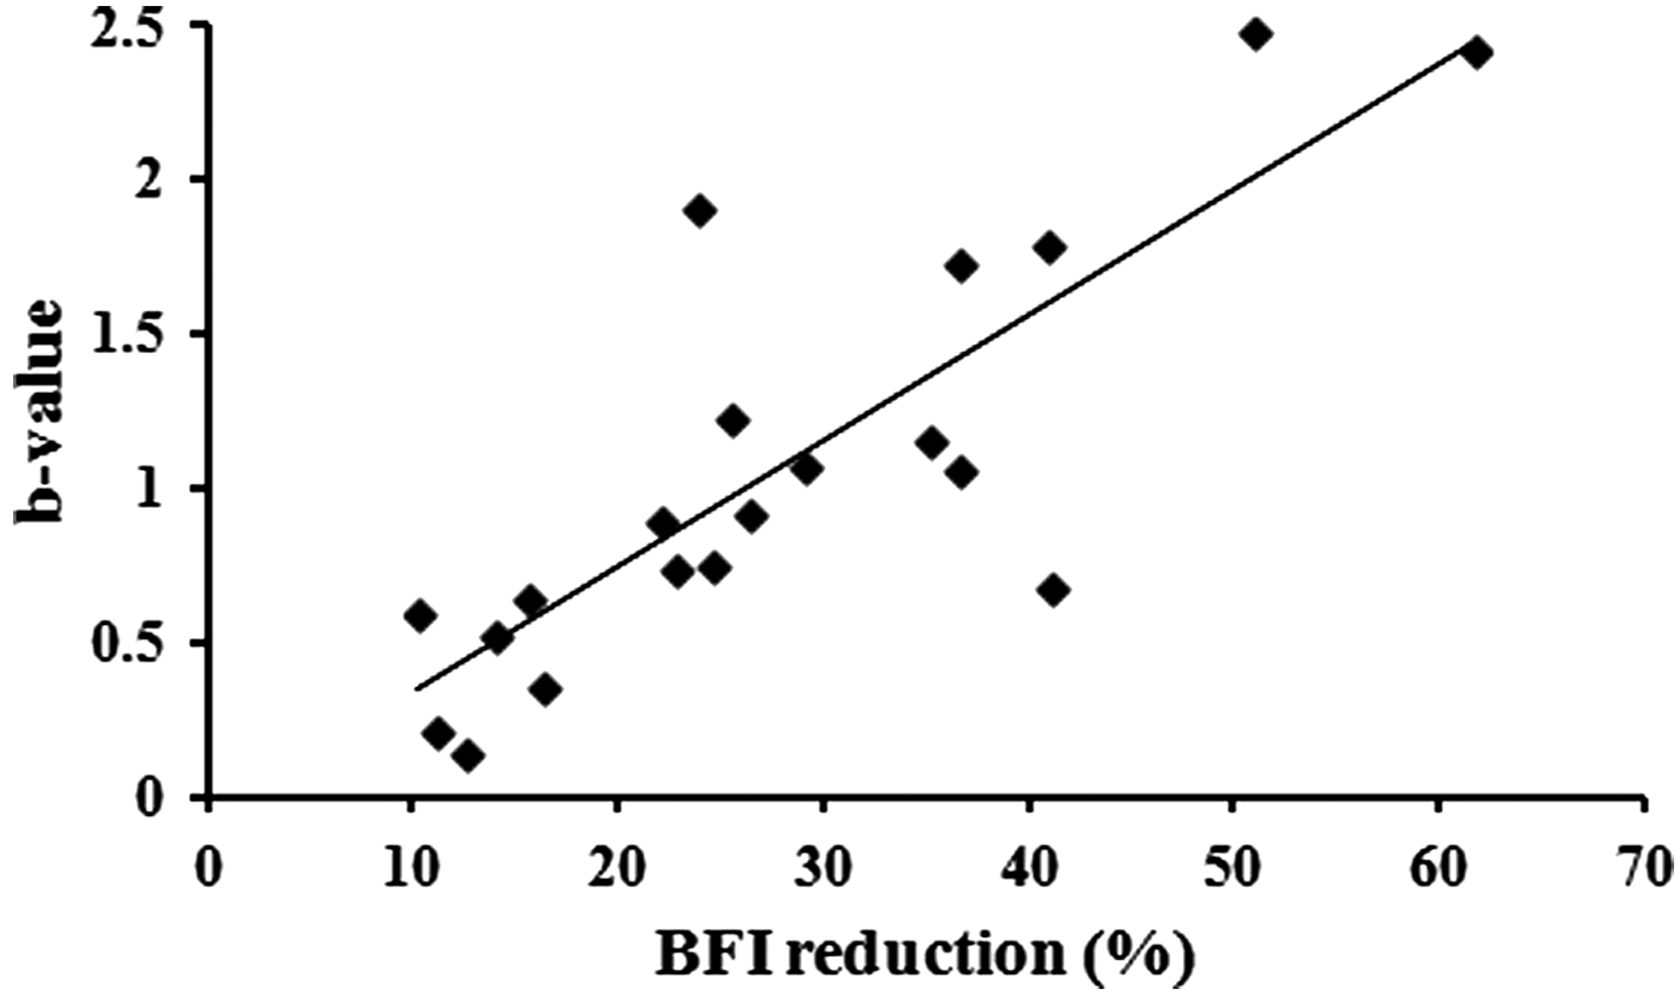
Relationship between the b-value and the biofilm formation index mean reduction.
Therefore, as the BFI was reduced, the b-value increased due to breaking of the biofilms.
FESEM for comparison of biofilms matrix removal by disinfectants
The representative FESEM images obtained from all disinfectants used to challenge 5-d-old A. hydrophila biofilms are shown in Figure 4. Images from different disinfectant treatments confirm the reduction of biofilms by crystal violet staining. Biofilms of the untreated control showed thick microcolonies surrounded by high levels of extracellular polymeric substance (EPS) matrix (Fig. 4A). The results show that EtOH at concentrations of 25% and 35% had no effect on the removal of biofilms matrix (data not shown) or the related EPS, but 50% (data not shown) and 70% disrupted the biofilms structure as well as the EPS (Fig. 4B). NaOCl showed the best activity for removing biofilms matrix and also changed the cell morphology (Fig. 4C). The SEM images of BAC and H2O2 treatment showed more cells remaining with minimum alteration of cell morphology (Fig. 4D and F). PAA removed EPS matrix but did not remove the cells (Fig. 4E).
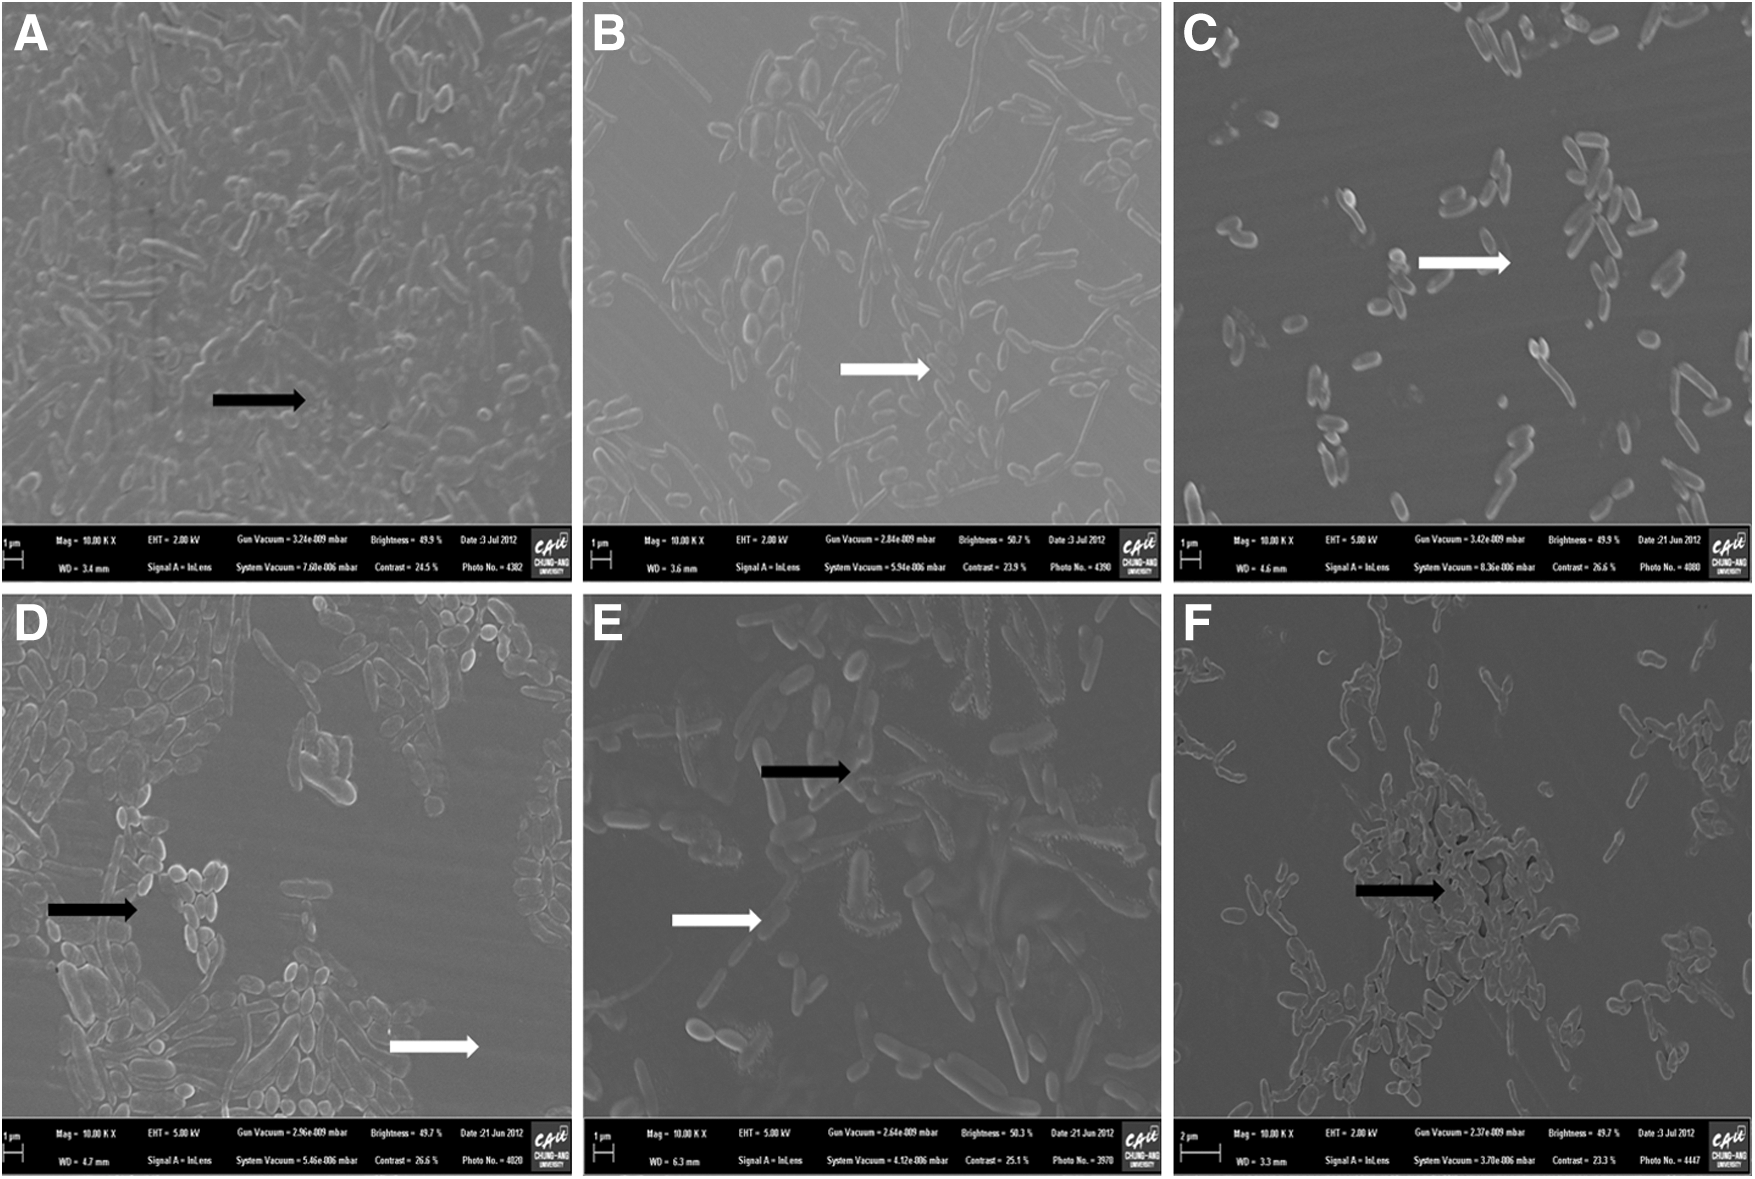
Field-emission scanning electron microscope images of Aeromonas hydrophila biofilms after treatment with different disinfectants. Black arrows indicate the presence of EPS and white arrows indicate the absence of EPS.
Discussion
Many studies have reported that biofilms need diverse genotypes and phenotypes expressing distinct metabolic pathways for stress survival in biofilms (Bridier et al., 2011; Jahid and Ha, 2012). Therefore, the mode of biofilms growth is important for food and the food industry. We prefer the Weibull model to predict disinfectant behavior as this model is more flexible and reliable over a wide range of time treatments and concentrations relative to the log-linear model. The model was fitted for both biofilms and planktonic cells reduction as the R2 values were 0.88–0.99, respectively. van Boekel (2002) reported shape (β) parameters that were >1.0 or <1.0 for the thermal inactivation of different foods. Except for a few planktonic points, our results showed all shape (β) parameters were <1.0, which also correlated with other findings regarding biofilms (Vaid et al., 2010).
Disinfectants should reduce cell numbers by 5 log in the presence of neutralizer (Anonymous, 2009). Our experimental results demonstrate that lower concentrations reduced planktonic populations by 5 log (Fig. 1), whereas higher concentrations were needed to reduce the reduction of biofilms by 5 log, except for EtOH. There have been many studies on the resistance of biofilms, including studies of Pseudomonas aeruginosa (Landry et al., 2006), Staphylococcus aureus (Kuda et al., 2008), Listeria monocytogenes (Chemielewski and Frank, 2006), and Lactobacillus plantarum (Kubota et al., 2009).
The interesting finding of the present study was that the most effective disinfectant for A. hydrophila biofilms was 70% EtOH (Fig. 1B). EtOH was active on both planktonic cells and biofilms, although significantly (p<0.05) higher resistance was found for the biofilms. It was also noted that H2O2 (Fig. 1F) and PAA (Fig. 1H) resistance in biofilms might be lower due to diffusion, catalase, and other mechanisms noted by other studies (Peeters et al., 2008).
Our results showing the resistance of biofilms to NaOCl (Fig. 1D) correlated with the findings of Sena et al. (2006). PAA was reported to be superior to chlorine in killing Listeria spp. and Pseudomonas spp. biofilms on stainless steel (Fatemi and Frank, 1999), coinciding with the results in our study. Park et al. (2012) also showed that Escherichia coli O157:H7, Salmonella Typhimurium, and L. monocytogenes biofilms formed on stainless steel showed more resistance to NaOCl compared to PAA by aerosolized sanitizing methods. Toté et al. (2010) also reported that 3000 ppm PAA killed biofilms without the removal of biofilms matrix. We also observed that PAA killed biofilms, as it had the ability to remove the EPS without complete eradication of biofilms (Fig. 4). Marin et al. (2009) reported that biofilms of Salmonella sp. were resistant to 1% H2O2, glutaraldehyde, and formaldehyde. H2O2 was unable to kill biofilms as it cannot penetrate the biofilms matrix, and this may be due to an inability to dissolve the EPS. Although 70% EtOH showed incomplete removal of biofilms matrix, it removed the EPS as determined by SEM images (Fig. 4). Bae et al. (2012) also demonstrated that alcohol-based sanitizers are potential methods for removing biofilms from stainless steel rather than chlorine-based sanitizers. Møretrø et al. (2009) noted that 70% EtOH is the best disinfectant for Salmonella spp., which coincides with our results. All these studies prove the activity of 70% EtOH as a potential disinfectant for biofilms, and this study shows it is a conceptually straightforward strategy for controlling A. hydrophila biofilms.
It is noteworthy that the influence of biofilms matrix reduction showed a positive correlation (R2=0.6835) with the Weibull model scale (α) and shape (β) parameters (Fig. 3). We therefore hypothesized that a relationship exists between biofilms matrix and the viability of biofilms, which is contradictory to the results of Peeters et al. (2008). The dissimilarity between these two studies may lie in the fact that Peeters et al. (2008) did not calculate the viability by nonlinear regression.
Conclusion
In summary, this is the first report that shows a relationship between the nonlinear Weibull model with biofilms matrix. Moreover, this article helps to explain why biofilms are more resistant to chemical disinfectants rather than planktonic cells. So, we deduced that the Weibull model is a more flexible model to fit the data for both planktonic cells and biofilms treated by disinfectants. These data, however, support the effectiveness of disinfectants against A. hydrophila biofilms in vitro. Future research is needed to elucidate the disinfectant efficacy for foods and to examine the synergistic effect of disinfectants.
Footnotes
Acknowledgments
This research was supported by Basic Science Research Program through the National Research Foundation of Korea (NRF) funded by the Ministry of Science, ICT & Future Planning (2013005051).
Disclosure Statement
No competing financial interests exist.