
Abstract
Vibrio parahaemolyticus is the leading cause of infectious illness associated with seafood consumption in the United States. Molecular fingerprinting of strains has become a valuable research tool for understanding this pathogen. However, there are many subtyping methods available and little information on how they compare to one another. For this study, a collection of 67 oyster and 77 clinical V. parahaemolyticus isolates were analyzed by three subtyping methods—intergenic spacer region (ISR-1), direct genome restriction analysis (DGREA), and pulsed-field gel electrophoresis (PFGE)—to determine the utility of these methods for discriminatory subtyping. ISR-1 analysis, run as previously described, provided the lowest discrimination of all the methods (discriminatory index [DI]=0.8665). However, using a broader analytical range than previously reported, ISR-1 clustered isolates based on origin (oyster versus clinical) and had a DI=0.9986. DGREA provided a DI=0.9993–0.9995, but did not consistently cluster the isolates by any identifiable characteristics (origin, serotype, or virulence genotype) and ∼15% of isolates were untypeable by this method. PFGE provided a DI=0.9998 when using the combined pattern analysis of both restriction enzymes, SfiI and NotI. This analysis was more discriminatory than using either enzyme pattern alone and primarily grouped isolates by serotype, regardless of strain origin (clinical or oyster) or presence of currently accepted virulence markers. These results indicate that PFGE and ISR-1 are more reliable methods for subtyping V. parahemolyticus, rather than DGREA. Additionally, ISR-1 may provide an indication of pathogenic potential; however, more detailed studies are needed. These data highlight the diversity within V. parahaemolyticus and the need for appropriate selection of subtyping methods depending on the study objectives.
Introduction
V
There are a number of subtyping methodologies for differentiation of V. parahaemolyticus isolates. Some of the most common are fingerprint based methods such as pulsed-field gel electrophoresis (PFGE), enterobacterial repetitive consensus polymerase chain reaction (ERIC-PCR), repetitive-element PCR (REP-PCR), direct genome restriction analysis (DGREA), and intergenic spacer region (ISR-1) (Staley and Harwood, 2010; Caburlotto et al., 2011). In this study, the three fingerprint methods ISR-1, DGREA, and PFGE were selected for comparison of their suitability for discriminating between a set of isolates from clinical and oyster sources. These methods were selected because of their documented utility in differentiation of isolates of the same species (Gonzalez-Escalona et al., 2006, 2007a, 2007b; Kam et al., 2008).
ISR-1 is a PCR-based subtyping method that amplifies the intergenic spacer region between the 16S and 23S rRNA gene, characteristic of each bacterial species (Maeda et al., 2000; Gonzalez-Escalona et al., 2006, 2007a). ISR-1 differentiates between Vibrio species and can subtype Vibrio isolates within the same species (Gonzalez-Escalona et al., 2006, 2007a; Hoffmann et al., 2010), including differentiation of pandemic isolates of the serotype O3:K6 from nonpandemic O3:K6 isolates (Gonzalez-Escalona et al., 2006). DGREA is based on DNA restriction, using a high-frequency cutting enzyme that produces smaller DNA fragments that can be separated by standard electrophoresis. The discriminatory capability of DGREA for V. parahaemolyticus isolates has been reported to be similar to PFGE and is less time and resource intensive (Gonzalez-Escalona et al., 2007b; Staley and Harwood, 2010). Additionally, DGREA can separate pandemic O3:K6 isolates from other V. parahaemolyticus strains (Fuenzalida et al., 2006a). PFGE uses a rare cutting restriction enzyme to digest bacterial DNA and applies pulsed-field electrophoresis to separate the large DNA fragments (Clark et al., 1988; Lai et al., 1989). PFGE can discriminate among serotypes of V. parahaemolyticus and is widely used for subtyping of this organism (Staley and Harwood, 2010).
The objective of this study was to evaluate the suitability of ISR-1, DGREA, and PFGE for subtyping V. parahaemolyticus using a group of well-characterized oyster and clinical isolates from North America (Jones et al., 2012).
Materials and Methods
Bacterial strains
Sixty-seven oyster and 77 clinical isolates previously examined for their serotype, virulence genes, and biochemical profiles (Jones et al., 2012) were employed in this study. Dr. Cheryl Bopp from the Centers for Disease Control and Prevention (CDC) kindly provided clinical isolates.
Intergenic Spacer Region 1 (ISR-1)
Each isolate was inoculated into Luria-Bertani broth plus 1% NaCl (LB+1% NaCl) and incubated with shaking overnight at 35°C. One milliliter of the overnight culture was removed, heated to 100°C for 10 min, and plunged into ice for 5 min. The samples were stored at −20°C until used as a PCR template.
The primers used for this study were G1F (5′-GAAGTCGTAACAAGG-3′) and L1R (5′-CAAGGCATCCACCGT-3′). The PCR conditions conformed to previous publications (Jensen et al., 1993; Gonzalez-Escalona et al., 2006). Each reaction mixture had a final volume of 30 μL and consisted of: 1X buffer with MgCl2 (Qiagen, Valencia, CA), 0.125 mM dNTPs (Qiaqen), 0.5 μM each primer (Integrated DNA Technologies; IDT, Coralville, IA), 1 U Taq polymerase (Qiagen), and 4 μL boiled template. The PCR program started with an initial denaturation at 95°C for 1 min, followed by 30 cycles of denaturation at 95°C for 1 min, elongation at 58°C for 1 min, and annealing at 72°C for 1 min. A final annealing step at 72°C for 10 min completed the temperature program. The PCR products were subjected to a heteroduplex resolution reaction, which consisted of: 1X buffer with MgCl2 (Qiagen), 0.2 mM dNTPs (Qiagen), 2.0 mM MgCl2 (Qiagen), 0.4 μM each primer (IDT), 0.05 U Taq polymerase (Qiagen), and 15 μL of a 1:5 dilution of the PCR products as a template. The PCR program for heteroduplex resolution was the same as for the initial amplification, except only one cycle was conducted. For the PCR amplification and heteroduplex resolution, a PEQstar thermocycler (Peqlab, Wilmington, DE) was used.
DGREA
Each isolate was inoculated in tryptic soy broth plus 1% NaCl and incubated with shaking overnight at 35°C. Two milliliters of the culture were used for DNA extraction with the Promega Wizard® Genomic DNA Purification Kit (Madison, WI). Manufacturer's recommendations were followed, except the DNA was suspended in 50-μL elution buffer. DNA concentration of extracts was determined using a NanoDrop 1000 (Thermo Scientific, Wilmington, DE).
DGREA was performed as described previously (Fuenzalida et al., 2006b; Gonzalez-Escalona et al., 2007b). Briefly, 10 μg of DNA were digested with 10 U of NaeI (Promega, Madison, WI) in a 20-μL reaction for 2 h at 37°C. Each reaction mixture was then treated with 0.0020 μg/μL Proteinase K (Invitrogen, Grand Island, NY) for 1 h at 37°C. Resultant digest products (10 μL) were separated using an 8% nondenaturating polyacrylamide gel and electrophoresed for 3 h at 100 V. Bands were visualized by silver staining (Gonzalez-Escalona et al., 2006).
PFGE
The isolates were inoculated on tryptic soy agar plus 1% NaCl (TSA+1% NaCl) or plus 5% sheep blood (TSA+5% sheep blood) and incubated overnight at 35°C. Isolates were subcultured on the same medium overnight at 35°C. Plug preparation and PFGE were performed as described in the CDC PulseNet protocol for V. parahaemolyticus (Parsons et al., 2007; CDC, 2009).
Fingerprint analysis
The ISR-1 and DGREA fingerprints were analyzed with BioNumerics software 6.6 (Applied Maths, Austin, TX). The dendrograms were formed using the Dice correlation with 0.5% optimization and 1% tolerance as recommended in previous publications (Gonzalez-Escalona et al., 2006, 2007b). PFGE fingerprints were analyzed with BioNumerics software 5.1 (Applied Maths) using standard band calling methods (Parsons et al., 2007; CDC, 2009). The dendrograms were constructed using the Dice correlation with 1.5% optimization and 1.5% tolerance. Dendrograms containing SfiI and NotI combined comparisons were constructed using the average from experiments (SfiI and NotI) and the unweighted-pair group method using arithmetic averages. All PFGE analysis parameters were as recommended by CDC PulseNet standard procedures (Parsons et al., 2007; CDC, 2009). Identification of clusters within a dendrogram was based on a 76% similarity (Chen et al., 2012).
Statistical analysis
Determination of the discriminatory power of each method was performed as previously described (Hunter and Gaston, 1988) using the online discriminatory power calculator (Bikandi and San Millan, 2012).
Results
ISR-1
A representative gel from ISR-1 analysis is shown in Figure 1. These fingerprints were analyzed using bands between 300 and 800 bp as described previously (Gonzalez-Escalona et al., 2006). All isolates produced useable patterns with ISR-1, resulting in 23 patterns, and a discriminatory index of 0.8665 (Table 1). The 144 V. parahaemolyticus isolates clustered into four clusters (Supplementary Fig. S1 [Supplementary Data are available online at
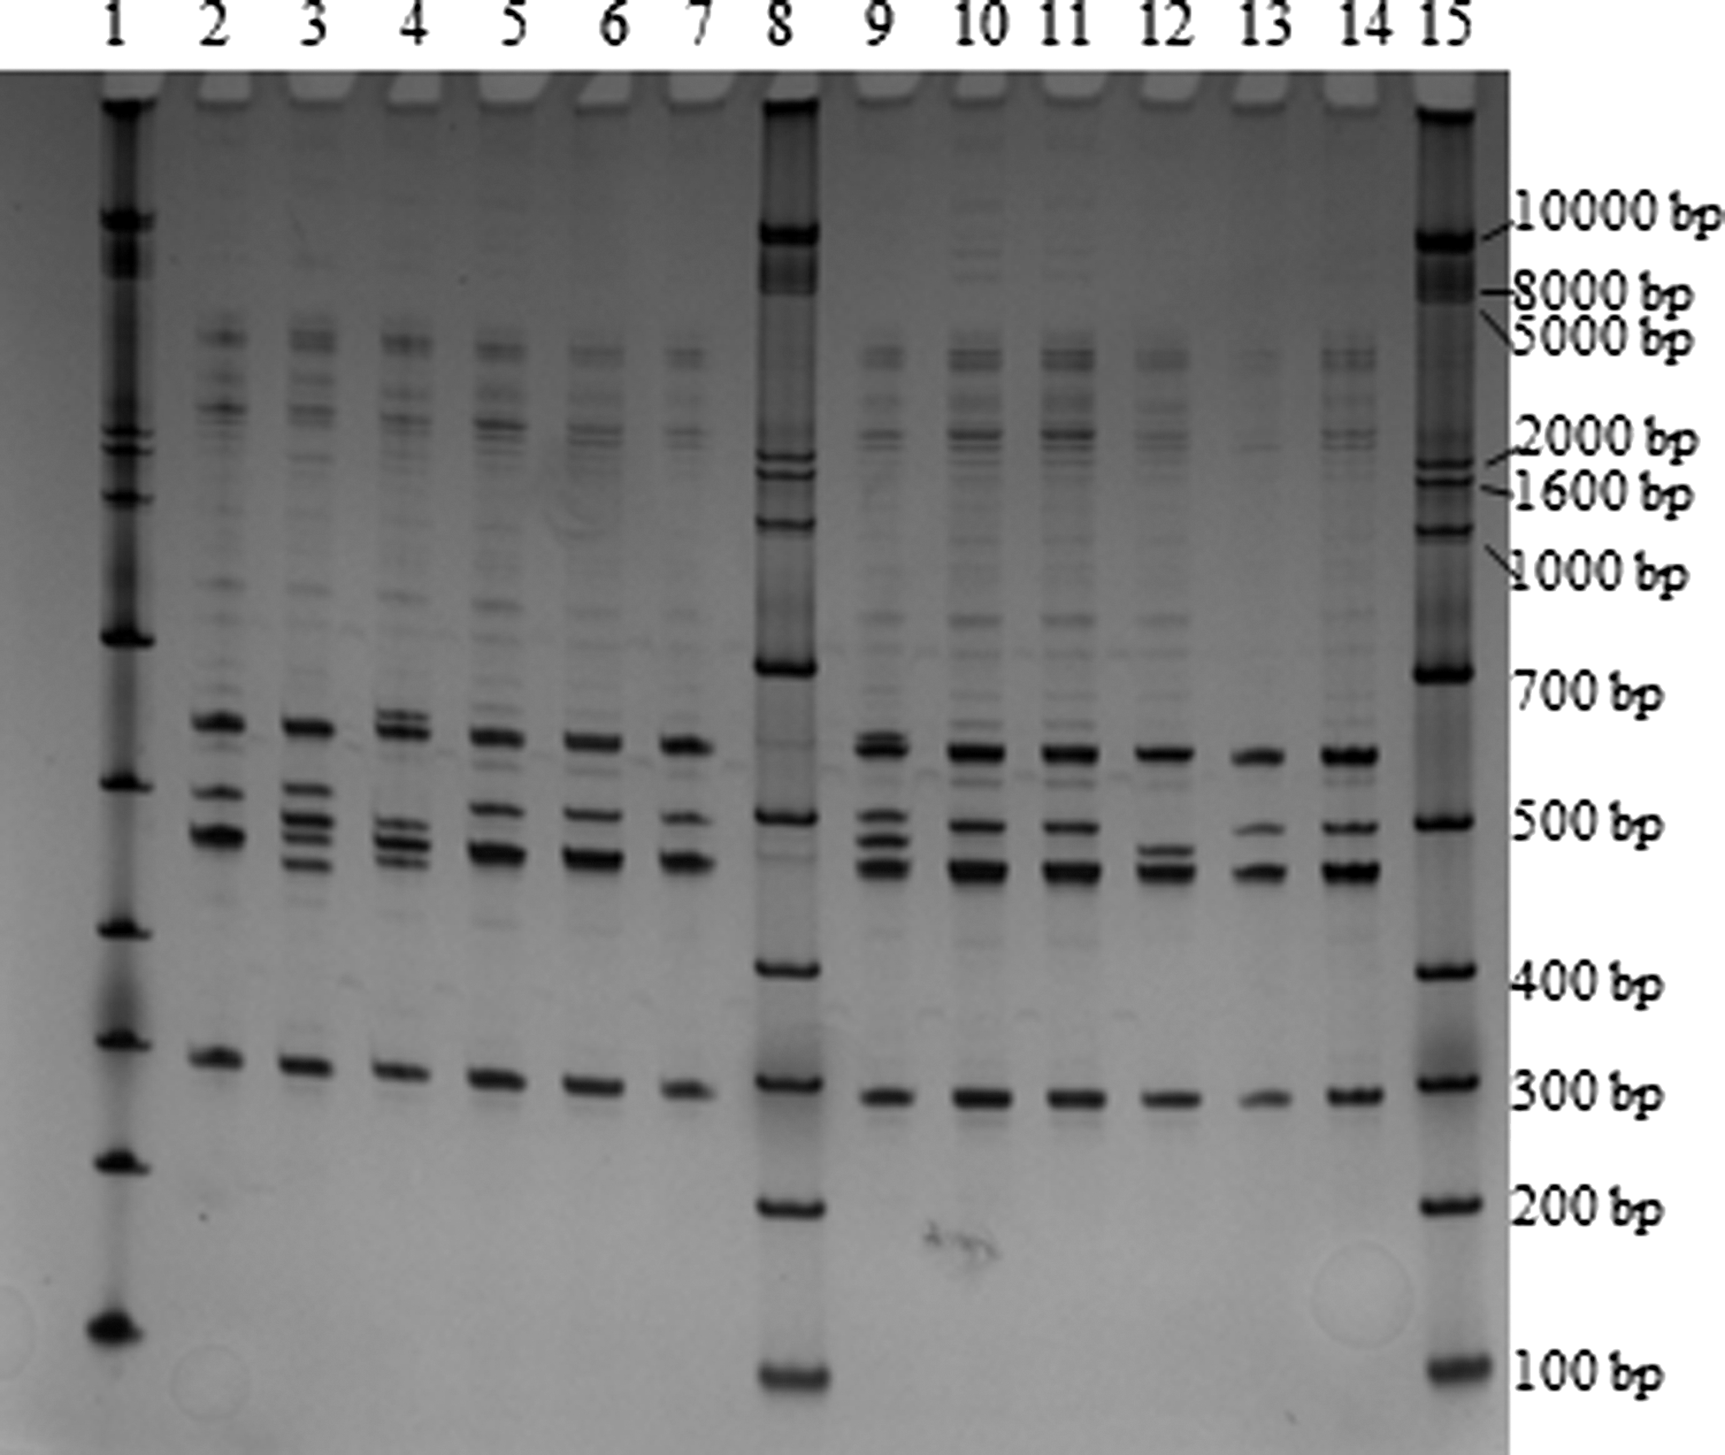
Representative gel image of intergenic spacer region-1 analysis after heteroduplex resolution. Lane 1, ladder; lane 2, CDC_K5328; lane 3, CDC_K5330; lane 4, CDC_K5331; lane 5, CDC_K5345_1; lane 6, CDC_K5345_2; lane 7, CDC_K5346, lane 8, ladder; lane 9, CDC_K5428; lane 10, CDC_K5429; lane 11, CDC_K5433; lane 12, CDC_K5435; lane 13, CDC_K5436; lane 14, CDC_K5437; lane 15, ladder.
ISR, intergenic spacer region; DGREA, direct genome restriction analysis; PFGE, pulsed-field gel electrophoresis.
Due to a large number of products outside of the previously described analysis scale, bands between 50 and 2500 bp were analyzed. In this analysis scale, 130 patterns were acquired (Supplementary Fig. S2), providing a discriminatory index of 0.9986 (Table 1). The isolates formed 11 clusters (Table 2). Remarkably, clusters 1 and 2 contained mostly (39/40; 97.5%) oyster isolates, while clusters 5–11 harbored mostly (29/34; 85.3%) clinical isolates, regardless of serotype or virulence genotype. The largest cluster, 3, contained a mix of oyster (n=21) and clinical (n=41) isolates, with strains subclustering based on oyster versus clinical origin.
DGREA
A representative gel from DGREA is shown in Figure 2. These fingerprints were analyzed using bands between 50 and 1500 bp, as previously described (Gonzalez-Escalona et al., 2007b). Any isolate producing a pattern of fewer than four products was omitted from this analysis. Of the 144 isolates examined, 58 of 67 (86.6%) oyster and 61 of 77 (79.2%) clinical isolates produced a usable pattern (Supplementary Fig. S3). DGREA produced 116 unique patterns from the 119 typeable strains, resulting in a discriminatory index of 0.9993 (Table 1). DGREA cluster analysis showed 44 individual clusters, 18 of which contained only a single isolate (Table 2). Cluster 28 contained only trh+ oyster isolates with the serotype O3:K5. Clusters 42 and 43 contained eight tdh+/trh+ clinical isolates of serotypes O4:K12, O4:K13, and O4:Kut. Although no other clusters contained only one serotype or virulence genotype (other than the single isolate clusters), most strains of the same serotype were in the same cluster.
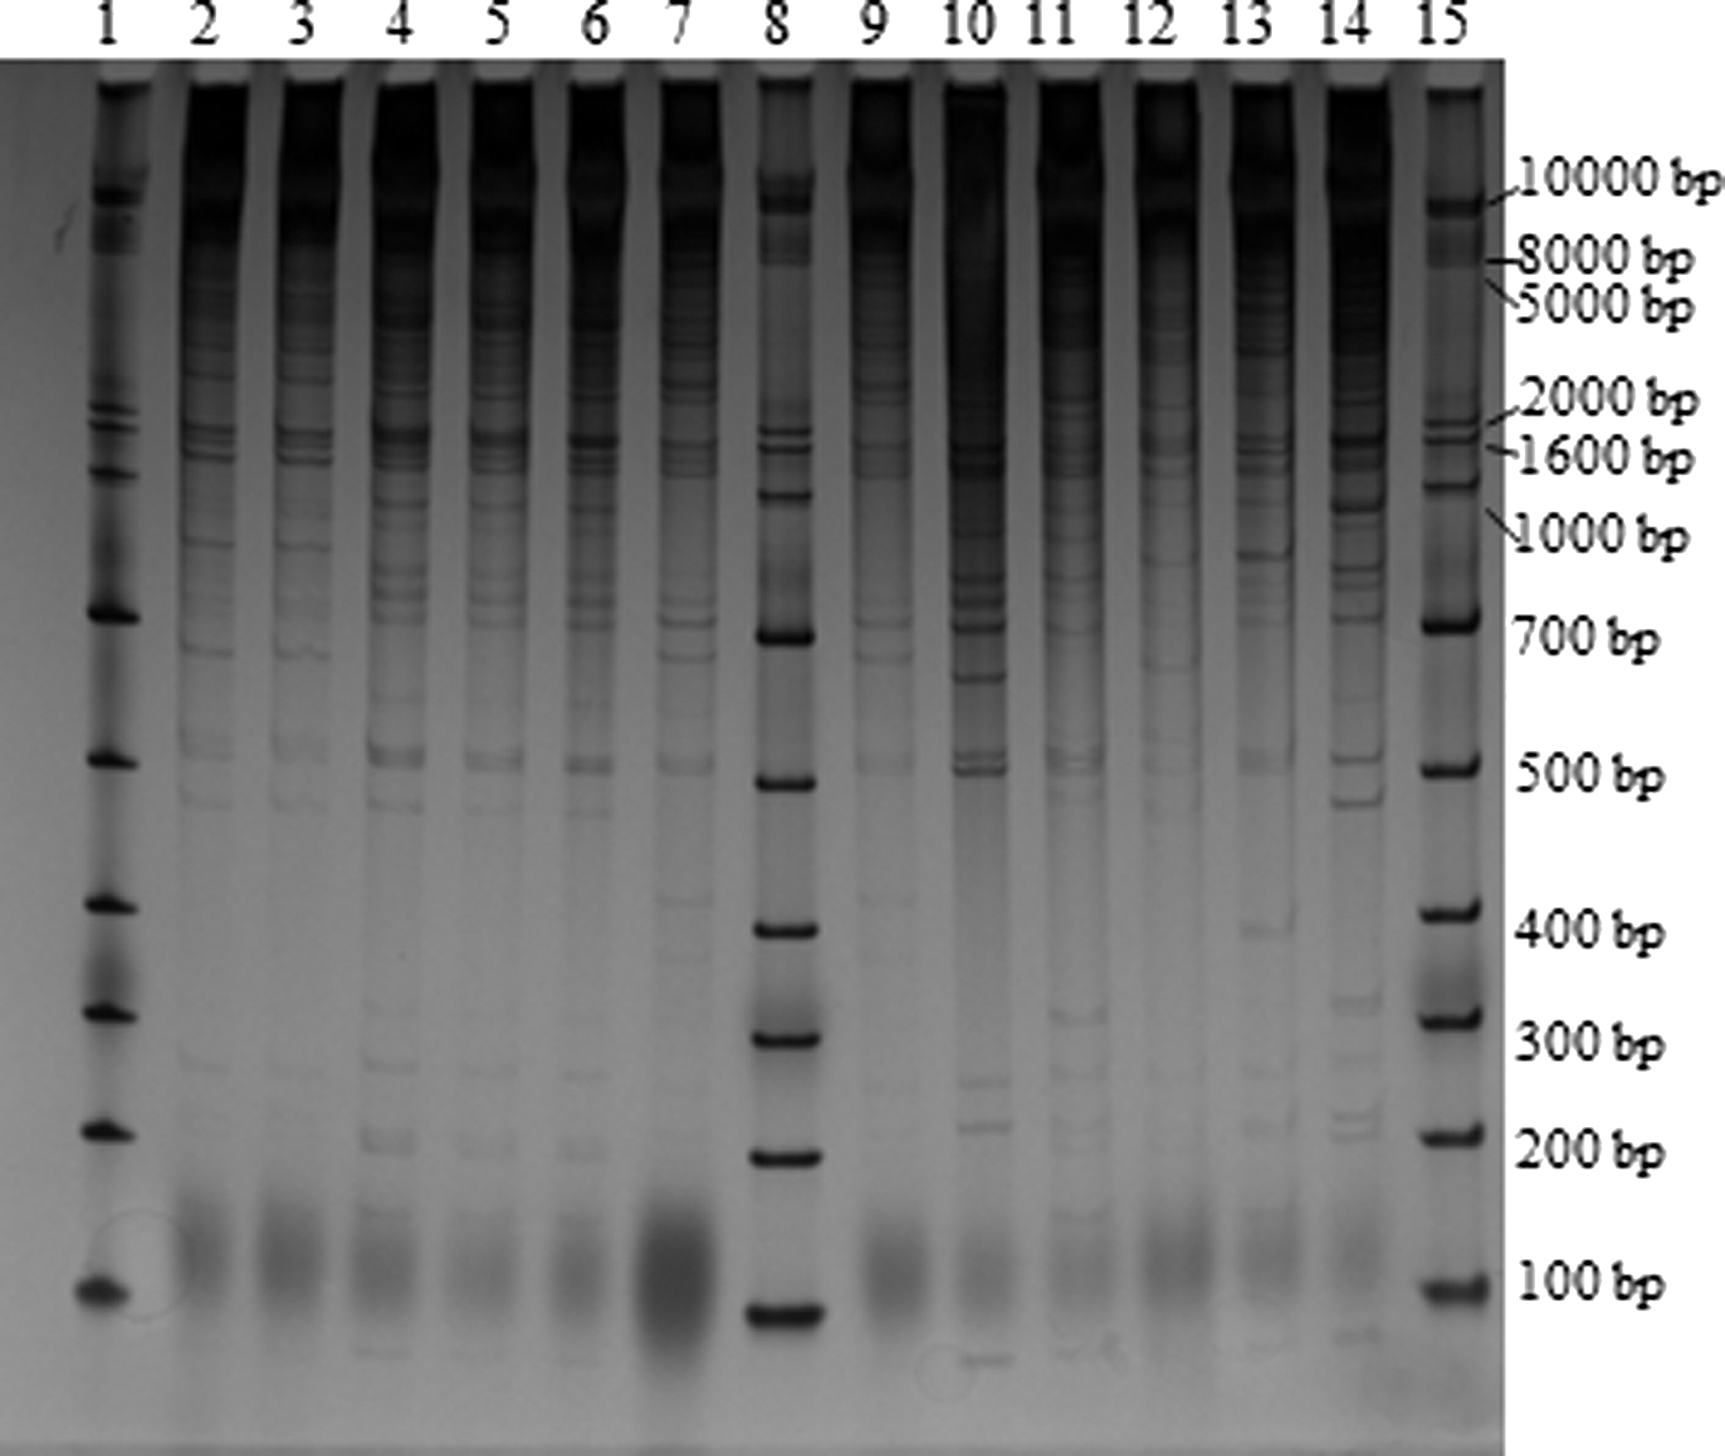
Representative gel image of direct genome restriction analysis product separation. Lane 1, ladder; lane 2, CDC_K5009_1; lane 3, CDC_K5009_2; lane 4, CDC_K5010_1; lane 5, CDC_K5010_2; lane 6, CDC_K5058_2; lane 7, CDC_K5059_1, lane 8, ladder; lane 9, CDC_K5059_2; lane 10, CDC_K5067; lane 11, CDC_K5073; lane 12, CDC_K5125; lane 13, CDC_K5126; lane 14, CDC_K5276; lane 15, ladder.
Similar to the ISR analysis, a second analysis range of bands between 50 and 2500 bp was used. Sixty-one (91.0%) oyster and 64 (83.1%) clinical isolates produced acceptable fingerprint patterns in this analysis range, producing 122 unique patterns from 125 isolates (Supplementary Fig. S4). This resulted in a discriminatory index of 0.9995 (Table 1). The resultant dendrogram revealed 50 clusters (Table 2; Supplementary Fig. S4). Clusters 48, 49, and 50 harbored only tdh+/trh+ clinical isolates of serotypes O4:K12, O4:K13, or O4:Kut. Additionally, cluster 25 contained three tdh-/trh+ O1:Kut clinical isolates. Remaining clusters contained a mix of clinical and oyster isolates with different serotypes and virulence genotypes.
Only two sets of isolates shared a common pattern, regardless of the analysis range (Table 2; Supplementary Figs. S3 and S4): two tdh+/trh+ oyster isolates with serotype O5:Kut, and three tdh+/trh+ clinical isolates with serotype, O4:K12.
PFGE
A representative gel from PFGE is shown in Figure 3. The DNA from the 144 V. parahaemolyticus isolates was successfully digested using both enzymes; however, DNA from isolate FDA_R129 (recovered from oysters) was uncut with SfiI due to the restriction site being absent or inaccessible. All bands generated were used to determine the fingerprint pattern of that isolate, including the single band pattern produced by R129. The 144 isolates produced 93 patterns when digested with SfiI and 99 patterns with NotI digestion (Supplementary Figs. S5 and S6). PFGE using SfiI and NotI alone provided discriminatory powers of 0.9894 and 0.9910, respectively (Table 1). Combined analysis of both restriction patterns resulted in 142 unique pattern combinations (Supplementary Fig. S7), providing a discriminatory index of 0.9998 (Table 1).
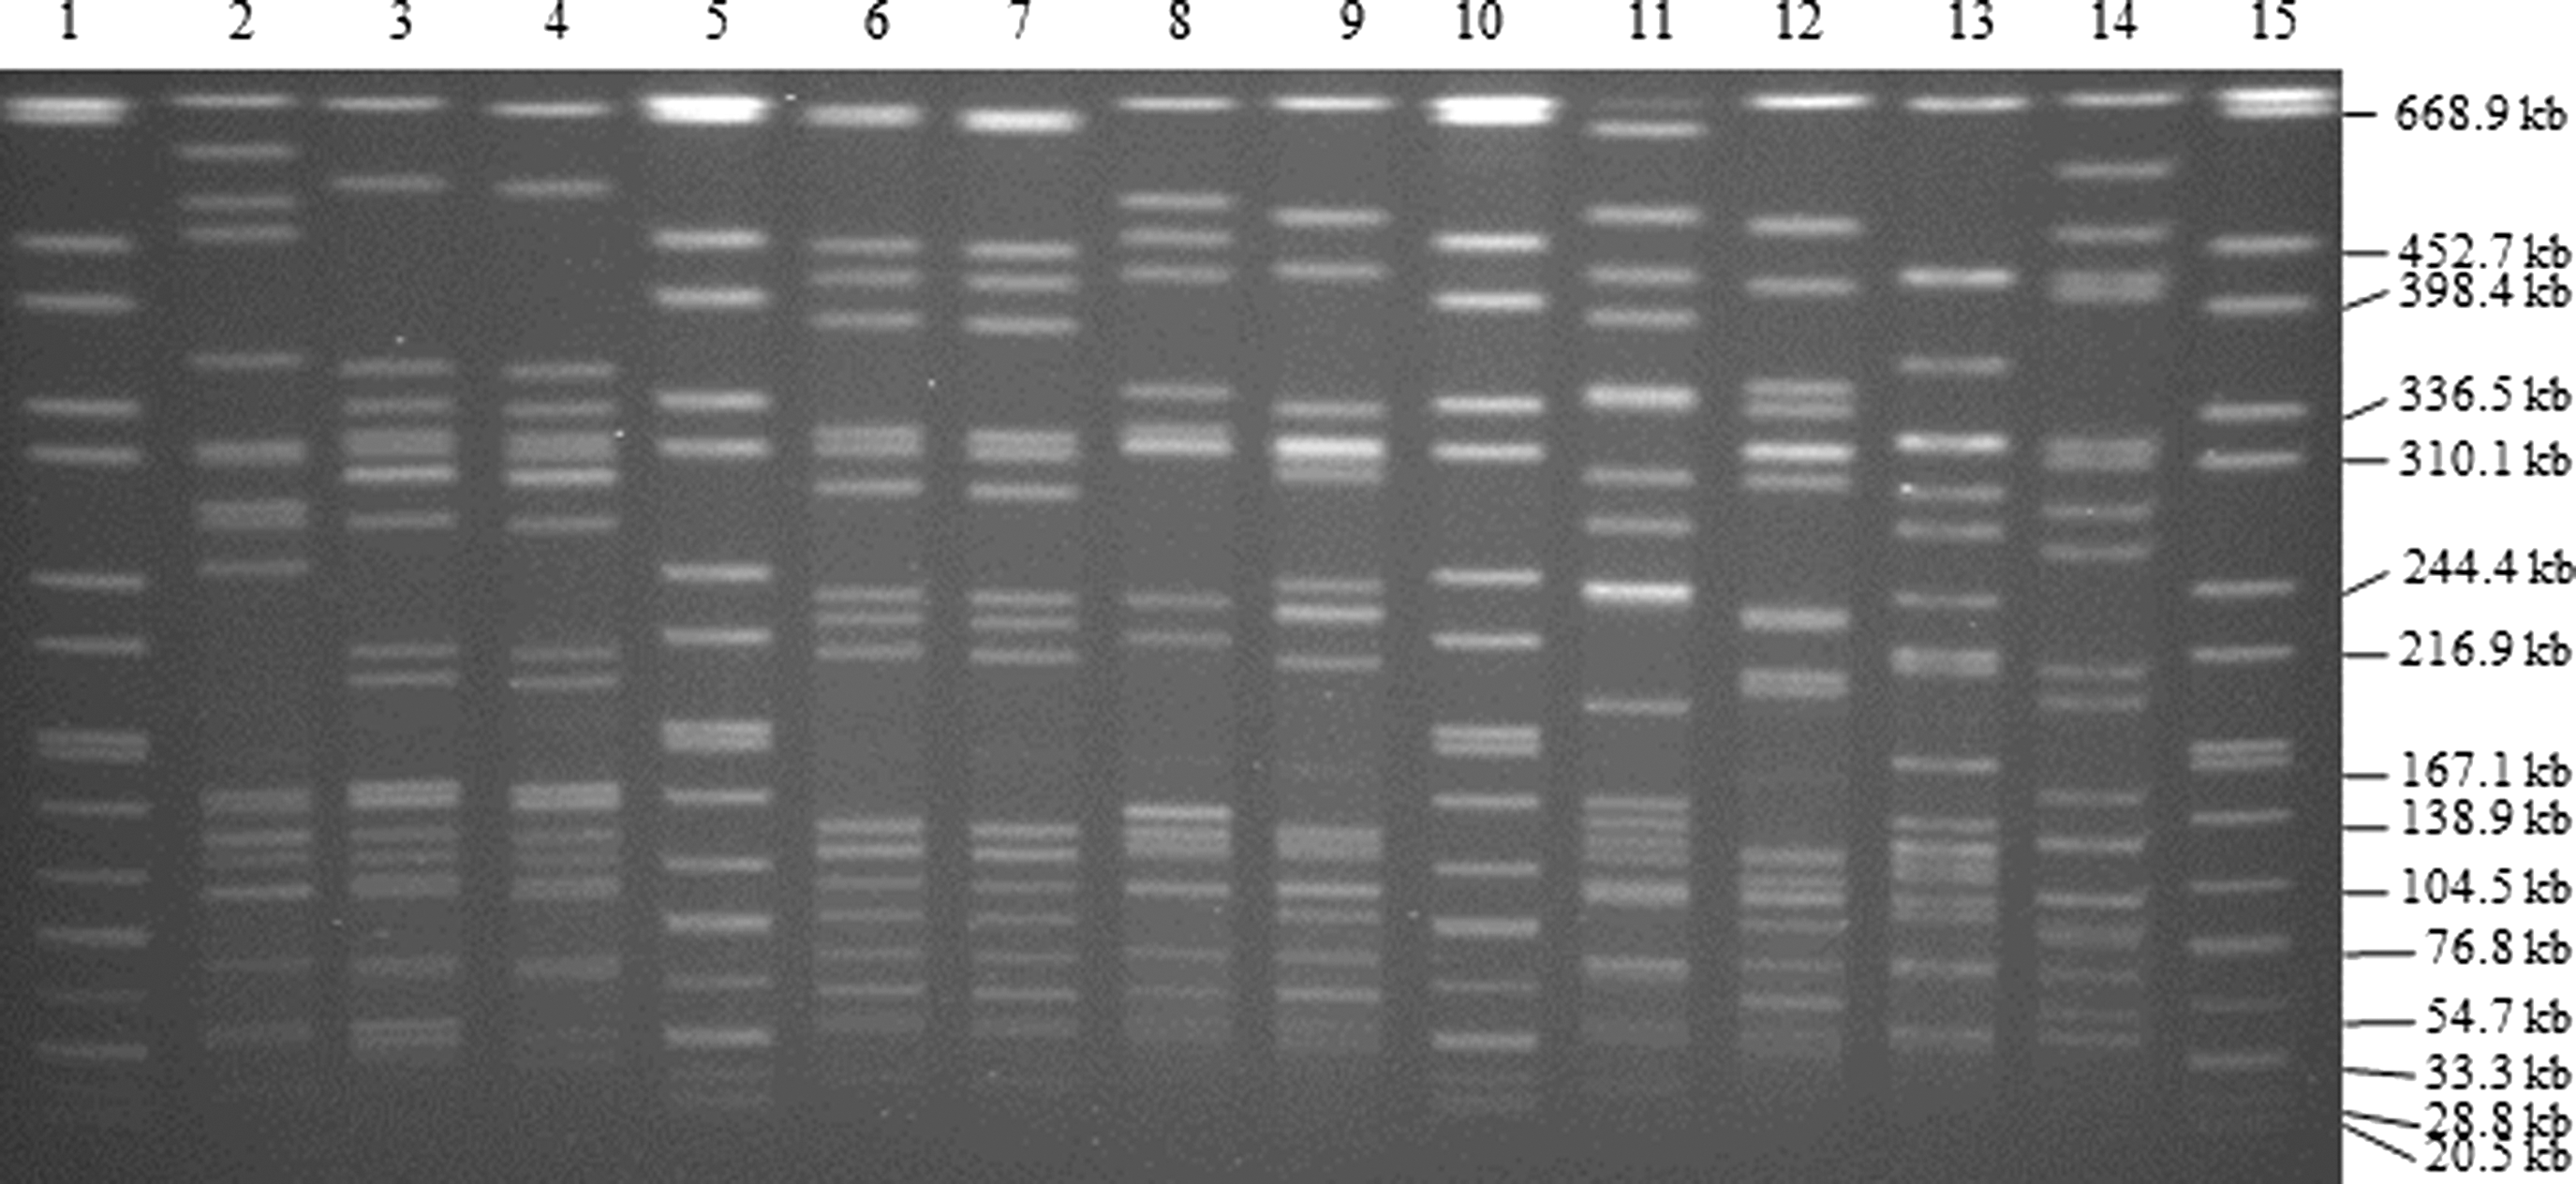
Representative gel image of pulsed-field gel electrophoresis product separation after digestion with SfiI. Lane 1, Salmonella Braenderup size standard; lane 2, FDA_R2; lane 3, FDA_R5; lane 4, FDA_R6; lane 5, Salmonella Braenderup; lane 6, FDA_R7; lane 7, FDA_R8, lane 8, FDA_R10; lane 9, FDA_R12; lane 10, Salmonella Braenderup; lane 11, FDA_R13; lane 12, FDA_R16; lane 13, FDA_R17; lane 14, FDA_R21; lane 15, Salmonella Braenderup.
Looking individually at patterns produced by each enzyme (SfiI and NotI), isolates generally clustered based on serotypes (Table 2; Supplementary Figs. S5 and S6). When both enzyme patterns were analyzed together, the 144 isolates clustered into 83 groups (Supplementary Fig. S7), also primarily by serotype (Table 2). Cluster 8 was the largest and contained 6 clinical O4:Kut (100%) and 9 of the 11 (81.8%) O4:K12 strains possessing both tdh and trh. Similarly, cluster 15 was comprised of eight of the nine (88.9%) tdh-/trh+ oyster isolates of the serotype O3:K5. The remaining clusters contained strains of multiple serotypes, virulence genotypes, and origins; however, isolates with the same serotypes grouped together within each cluster. Only two pairs of environmental isolates (FDA_R108/FDA_R99 and FDA_R76/FDA_R77) possessed indistinguishable patterns using combined enzyme analysis, and each pair was derived from a common oyster sample.
Discussion
This study analyzed a set of 144 V. parahaemolyticus isolates with PFGE, DGREA, and ISR-1 to identify which subtyping method(s) are most suitable for discrimination of V. parahaemolyticus. Although the three methods tested have similarly high discriminatory indices, the methods did not tend to cluster the strain in similar manners, with the notable exception of the isolates of serotypes O4:K12 and O3:K5, which clustered together in each analysis.
In a previous report, the ISR-1 patterns for the analysis range of 300–800 bp created four subgroups (I, II, II, IV). In the current study, not only were more subgroups identified, but also a different frequency of previously identified subgroups was observed. In the previous study, Gonzalez-Escalona pattern II was the most frequently observed (Gonzalez-Escalona et al., 2006), whereas pattern III was the most common in this study, of those patterns previously reported. This is likely due to the diverse origin of the strains examined in our study, compared to the mainly pandemic isolates with the serotypes O3:K6 and O4:K68 in the Gonzalez-Escalona study. The isolates with pandemic serotypes (O3:K6, O4:K68, and O1:K25) in this strain collection produced the earlier-described pattern II or a highly similar pattern.
Using the expanded 50–2500-bp analysis for ISR-1, cluster analysis generally separated oyster and clinical isolates, indicating a potential relatedness to virulence potential. As expected, a few oyster isolates are located in the clusters, which are primarily composed of clinical isolates (higher virulence potential). Conversely, some clinical isolates were grouped in the clusters primarily composed of oyster isolates, indicating a lower virulence potential. These clinical isolates may be more opportunistic (rather than true pathogens) or have been isolated from immunocompromised individuals. The largest cluster contained a nearly equal mix of clinical and oyster isolates, potentially indicating strains of moderate virulence potential. These results indicate that ISR-1 may be suited to screen for differential virulence when using the broader analysis scale, but does not provide informative clustering in the smaller analysis range.
Overall, DGREA patterns did not demonstrate a clear differentiation among serotypes, or any other characteristic. As mentioned above, with the exception of a few serogroups, DGREA did not cluster isolates similarly as the other methods employed in this study. In contrast, a previous study demonstrated that DGREA and PFGE clustered V. parahaemolyticus isolates similarly (Fuenzalida et al., 2006a), but mostly pandemic O3:K6 isolates were examined. The isolates in this study with pandemic serotypes did not show any close clustering by DGREA. Our findings indicate that DGREA is not a reliable method due to the relatively high frequency of untypeable isolates. However, the high discriminatory power of the method may be useful in phylogenetic studies among strains that are typeable.
For PFGE, the composite data set of both enzyme restrictions showed better discrimination than the analyses of individual restriction patterns. A validation study of the PFGE protocol for V. parahaemolyticus recommended the primary use of the enzyme SfiI (Kam et al., 2008); however, studies have found that a combination of SfiI and NotI can be used for enhanced discrimination (Swaminathan et al., 2001; Cooper et al., 2006) as the current results suggest. The only strains that shared indistinguishable two-enzyme fingerprints were oyster isolates from the same sample. In contrast, previous studies reported that only 16%–35% of isolates produced unique patterns (Wong et al., 2007; Dauros et al., 2011). The current observations are more similar to a previous report of 94% diverse isolates producing unique pattern combinations as well as indistinguishable isolates sharing a common serotype when analyzing data from both restriction enzymes (Kam et al., 2008). In this study, PFGE analysis also tended to cluster isolates by serotype, including clustering of strains with the pandemic serotypes O3:K6 and O4:K68. These observations support the utility of PFGE in epidemiologic and phylogenetic investigations, as unrelated strains are clearly differentiated by this method.
Conclusions
This represents the first study conducted to compare ISR-1, DGREA, and PFGE for subtyping a diverse panel of V. parahaemolyticus isolates. Although DGREA is more rapid than PFGE, cluster analysis did not correlate with any associated metadata. Additionally, PFGE represented the more reliable subtyping method with this strain collection, based on the higher percentage of typeable strains and its ability to cluster isolates by serotype. The ISR-1 method was less discriminatory than PFGE or DGREA, but analysis using a larger product size range provided a similar level of discrimination and was the only analysis to differentially cluster clinical and oyster isolates. This may provide a rapid subtyping tool for indication of virulence potential; however, further investigation is needed.
Footnotes
Acknowledgments
This project was supported by an appointment to the Research Fellowship Program for the Center for Food Safety and Applied Nutrition administered by the Oak Ridge Associated Universities through a contract with the FDA.
Disclosure Statement
No competing financial interests exist.
References
Supplementary Material
Please find the following supplemental material available below.
For Open Access articles published under a Creative Commons License, all supplemental material carries the same license as the article it is associated with.
For non-Open Access articles published, all supplemental material carries a non-exclusive license, and permission requests for re-use of supplemental material or any part of supplemental material shall be sent directly to the copyright owner as specified in the copyright notice associated with the article.