
Abstract
From July 2006 to June 2008, a total of 3876 Escherichia coli strains were collected from 1014 porcine intestinal contents to investigate antimicrobial resistance and related gene patterns. Average resistance rates of porcine E. coli isolates were 93.2% for tetracycline, 65.3% for ampicillin, 60.4% for chloramphenicol, 57.7% for streptomycin, 35.8% for nalidixic acid, 23.6% for gentamicin, 10.8% for ciprofloxacin, 10.0% for norfloxacin, 4.5% for cephalothin, 1.0% for cefoxitin, and 0.4% for cefazolin. The number of isolates resistant to more than 3 different classes of antimicrobials was 2537. Among these, 92 isolates were resistant to 5 or more classes of antimicrobials, and 69 isolates among 92 multidrug-resistant (MDR) isolates were integrase positive. Among 69 integrase-positive MDR isolates, only class I integron was detected in 19 isolates (20.7%). The class-1-integron-positive isolates had different sizes and gene contents (i.e., 1.0 kb containing aadA1 and 1.5 kb containing aadA1-dfrA1 and aadA1-aadB), and showed 15 distinct types by pulsed-field gel electrophoresis (PFGE) analysis, with 80% cut-off band pattern similarity. PFGE typing of four groups of isolates with identical antimicrobial resistance gene profiles showed two heterogeneous groups, while one group had very similar PFGE patterns; the fourth group was not typeable due to DNA degradation. In conjugation experiments, class I integron-harboring isolates transferred resistance to ampicillin, norfloxacin, gentamicin, and chloramphenicol to the recipient strain. This study showed that antimicrobial resistance rates and corresponding genes in porcine E. coli isolates are different from those in human isolates described by previous studies, and that transfer of antimicrobial-resistant genes from animal to human occurred. These data can be used as a baseline to evaluate the effect of antimicrobial use after implementation of the animal antimicrobial ban for prophylactic and growth promotion except for therapeutic use in 2012 in Korea.
Introduction
E
Antimicrobial resistance can be attained through intrinsic or acquired mechanisms (Fitzgerald et al., 2008). Intrinsic mechanisms are those specified by naturally occurring genes found on the host's chromosome, such as chromosomal AmpC β-lactamase of several Gram-negative bacteria and many multidrug-resistant (MDR) efflux systems (Alekshun and Levy, 2007).
Acquired mechanisms involve mutations in genes targeted by antimicrobials and the transfer of resistance determinants on plasmids, bacteriophages, transposons, or other mobile genetic elements (Alekshun and Levy, 2007; Jiang et al., 2011; Glenn et al., 2012). There are many observations that strongly indicate that resistance genes among bacteria from food animals primarily emerged because of use of antimicrobials (Aarestrup and Wegener, 1999; Van den Bogaard et al., 2000; Fitzgerald et al., 2008; Glenn et al., 2012). For this reason, many countries have banned various antimicrobials in animal husbandry. Korea has totally banned the use of antimicrobials in animal husbandry since 2011 except for therapy on prescription by veterinarians (
In this study, E. coli were isolated from porcine intestines at a slaughterhouse during 3 years from 2006 to 2008. The aim of this study is to obtain better knowledge of the prevalence and degree of antimicrobial resistance in pigs, trends in MDR character, and investigate the possibility of transmission of resistance genes.
Materials and Methods
Collection of samples
From July 2006 to June 2008, a total of 1014 samples were collected from porcine intestinal contents at a slaughterhouse receiving animals from different regions in the Kyung-gi and Kang-won provinces in Korea. Porcine intestinal contents were obtained using cotton swabs and then placed into transport media (Yuhan Lab Tech, Seoul, Korea). Samples were kept in an insulated container and immediately transported to the laboratory within 1 h of travel time.
Isolation and identification of E. coli
On arrival at the laboratory, samples were streaked onto MacConkey agar (BBL Becton Dickinson, Sparks, MD) immediately. After overnight incubation at 37°C, up to three pink colonies with a phenotypic appearance consistent with E. coli that appeared on one Petri dish were subcultured to MacConkey agar and incubated at 37°C overnight. Isolated single pink colonies were examined by the standard biochemical test and API 20E kit (API-bioMérieux SA, Marcy l'Etoile, France) for identification. Isolates were stored at −70°C for further study and deposited at the Culture Collection of Antimicrobial Resistant Microbes (CCARM, Seoul, Korea).
Minimal inhibitory concentration test
Minimal inhibitory concentrations (MICs) were measured on Mueller–Hinton (MH) agar (BBL Becton Dickinson) plates in accordance with the recommendation of the Clinical Laboratory Standards Institute (CLSI, formerly NCCLS, 2000). The following 13 antimicrobials were tested: ampicillin, cefazolin, cephalothin, cefoxitin, cefotaxime, ceftazidime, gentamicin, tetracycline, ciprofloxacin, norfloxacin, nalidixic acid, chloramphenicol, and streptomycin. All were purchased from Sigma (St. Louis, MO) except for streptomycin (United States Biochemical, Cleveland, OH). A suspension containing each isolate (104 colony-forming units/mL) was inoculated on MH agar containing various concentrations of each antimicrobial ranging from 0.25 to 128 μg/mL. E. coli ATCC 25922 was included in each batch of the agar dilution test, and CLSI-approved MIC quality-control limits for E. coli ATCC 25922 were used for the control of agar dilution performance. MIC was determined following the criteria of Enterobactericeae by CLSI (CLSI, 2009). Resistance to five or more different classes of antimicrobials was considered as MDR in this study. MICs were determined up to 1024 μg/mL for MDR isolates.
DNA extraction and detection of resistance genes
E. coli was incubated on MH agar overnight at 37°C. Bacterial cells were suspended in sterile saline and then harvested by centrifugation at 14,000× g for 10 min. Genomic DNA was extracted using a G-spin genomic extraction kit (Intron Biotechnology, Seoul, Korea) in 30 μL Tris-EDTA buffer and stored at −20°C until analysis. A total of 17 genes responsible for antimicrobial resistance, ant(2″)-Ia, aac(3)-IIa, aph(3′)-Ia, aph(3′)-IIa, ant(3″)-I, aac(3)-IV, tet(A), tet(B), tet(C), cat I, cat II;, dfr, floR, bla
TEM, bla
SHV, bla
OXA, and qnr, were detected with polymerase chain reaction (PCR) using a primer set for each gene. Primer sequences for each gene, sizes of PCR products, and PCR conditions are presented in Table 1. The amplification reaction was performed in a Perkin-Elmer GeneAmp 9700 thermocycler (Applied Biosystems, Foster City, CA). The reaction mixture (a final volume of 50 μL) contained 1× buffer, 2.5 mM MgCl2, 200 μM deoxynucleoside triphosphates, 1 μM each primer, 1.25 U Taq polymerase (Takarabio, Otsu, Shiga, Japan), and 100 ng genomic DNA prepared as described. Positive control strains except for dfr and qnr were provided from CCARM. In case of dfr and qnr, PCR products were purified using QIAquick PCR purification kit (Qiagen, Hilden, Germany). Sequencing was performed by Bionics (Seoul, Korea). DNA sequences were compared against a database by using the online BLAST algorithm at the National Center for Biotechnology Information web server (
Sequencing of amplified integrase genes
Integrase genes (int; class I, II, and III) were amplified with a primer set for each gene as described in Table 1, and PCR products were purified and sequenced as described above.
Transference of aadA1 gene by conjugation
Conjugation experiments were performed by a filter mating technique with E. coli J53 Azir (resistant to sodium azide) as the recipient as described previously but with a minor modification (Wang et al., 2004; Tamang et al., 2008). E. coli CCARM IB788, E. coli CCARM 1D449, and E. coli CCARM 1E408 were isolated in 2006, 2007, and 2008, respectively, and used as donors. Single colonies of the donor and the recipient strain grown in brain-heart infusion (BHI, BBL Becton Dickinson) broth were mixed at a ratio of 1:10. The mixture was filtered through a nitrocellulose membrane filter (0.45 μm; Millipore, Bedford, MA) and the membrane was placed on MacConkey agar and incubated at 37°C for 20 h. After incubation, bacteria grown on the membrane were detached in 1 mL BHI broth with shaking. An aliquot was inoculated onto MacConkey agar supplemented with ampicillin (100 μg/mL) and sodium azide (150 μg/mL) to select transconjugants. After overnight incubation at 37°C, PCR was performed with DNA extracted from transconjugants to detect aadA1. MIC was determined by agar dilution as described previously.
Pulsed-field gel electrophoresis
PFGE was performed according to the protocol of PulseNet with a minor modification (Swaminathan et al., 2001; Lee et al., 2008). DNA fragments digested with 30 U XbaI (MBI Fermentas, Hanover, MD) were separated in CHEF MAPPER (Bio-Rad Laboratories, Hercules, CA) and analyzed with GelCompar II (Applied Maths, Kortrijk, Belgium). PFGE gel images were normalized and PFGE profiles were grouped together by using the Jaccard coefficient and unweighted-pair group method with arithmetic mean clustering with the GelCompar II (Applied Maths) clustering with a 0.89% band position tolerance window and 0.87% optimization.
Results
Isolation and identification of E. coli
A total of 3876 E. coli isolates were obtained from porcine intestinal contents.
MICs of E. coli isolates
MICs of E. coli for 11 antimicrobials of 6 different classes are shown in Table 2. Average resistance rates for 3 years were 93.2% for tetracycline, 65.3% for ampicillin, 60.4% for chloramphenicol, 57.7% for streptomycin, 35.8% for nalidixic acid, 23.6% for gentamicin, 10.8% for ciprofloxacin, 10.0% for norfloxacin, 4.5% for cephalothin, 1.0% for cefoxitin, and 0.4% for cefazolin. All isolates were susceptible to cefotaxime and ceftazidime. MIC values of two kinds of fluoroquinolone were different for each year. Resistance rates of norfloxacin and ciprofloxacin for isolates from 2007 were 16.2% and 17.4%; from 2006 were 8% and 8.1%; and from 2008 were 7.1% and 8.4%, respectively. A total of 2537 isolates were resistant to more than 3 different classes of antimicrobials. Among these, 92 isolates were resistant to 5 or more different classes of antimicrobials. Detection rates of these MDR were 2.2% in 2006, 2.8% in 2007, and 2.3% in 2008. Both MIC50 and MIC90 values of 92 MDR E. coli were higher than the resistance criteria, except cephalosporin class antimicrobials.
Criteria limit for resistance according to the Clinical Laboratory Standards Institute (CLSI).
MIC, minimal inhibitory concentration.
Detection of resistance genes in MDR E. coli by PCR
Seventeen antimicrobial resistance genes and 4 integron genes in 92 MDR E. coli were detected by PCR with a primer set specific to each gene. The most frequently detected gene was ant(3″)-I (90 isolates; 97.8%), which was responsible for streptomycin resistance. The next frequently detected genes were aph(3′)-Ia (79 isolates; 85.9%) responsible for gentamicin resistance and aac(3)-IV (53 isolates; 57.6%) responsible for kanamycin resistance. The ant(2″)-Ia, aac(3)-IIa, and aph(3′)-IIa genes were detected at low frequencies (Table 3). A total of 84 MDR isolates (91.3%) had tet(A) or tet(B), but not both genes at the same time, whereas no isolate had tet(C). In the case of genes for phenicol resistance, floR, cat(I), and cat(II) were detected in 69 isolates (75%), 25 isolates (27.2%), and 2 isolates (2.2%), respectively (Table 3). Only two ß-lactamase genes were detected: blaTEM in 83 isolates (90.2%) and blaOXA in only one isolate in 2007. The quinolone resistance gene, qnr, was not detected at all and the integrase gene was detected in 69 isolates (75%).
Detection and sequencing of integron
Among 69 integrase-positive MDR isolates, only class I integrons with different sizes and gene contents were detected in 19 isolates (20.7%), whereas class II or III integrons were not detected (Table 3). Class I integrons with a size of 1000 bp contained the aadA1 gene cassette, which encodes streptomycin-modifying and spectinomycin-modifying enzymes. Class I integrons with a size of 1500 bp contained aadA1-dfrA1, aadA1-unknown open reading frame, and aadB-aadA1 (Table 4).
ORF, open reading frame.
Transference of aadA1 gene by conjugation
Transconjugants acquired resistance to ampicillin, norfloxacin, gentamicin, tetracycline, and chloramphenicol, which were transferred from donors. MICs for sodium azide of transconjugants were higher than 256 μg/mL, which is similar to the MIC of the recipient E. coli J53 Azir (Table 5). PCR results confirmed aadA1 genes in both transconjugants, indicating the transfer of resistance genes from each donor to the recipient strain.
Resistant antibiogram; AmNoCiNaGmStChTe, resistant gene profile; tet(B), flo(R), blaTEM, aph(3′)-Ia, ant(3″)-I, aac(3)-IV, int, classI.
Resistant antibiogram; AmNoCiNaGmStChTe, resistant gene profile; tet(A), flo(R), blaTEM, ,aph(3′)-Ia, ant(3″)-I, aac(3)-IV, int, classI.
AMP, ampicillin; NOR, norfloxacin; GEN, gentamicin; TET, tetracycline; CHL, chloramphenicol; SA, sodium azide; E. coli, Escherichia coli; CCARM, Culture Collection of Antimicrobial Resistant Microbes.
Analysis of PFGE
The genetic relationship among MDR E. coli isolates harboring integrons and the most frequently found genotypes (Table 6) based on their XbaI-digested DNA fragment are shown in Figures 1 and 2. In Figure 1, XbaI-digested DNA fragments of MDR E. coli isolates showed various profiles when 10–29 DNA fragments from 19 isolates were analyzed by the Jaccard method; an 80% cut-off band pattern similarity resulted in 15 clusters, and a 40% cut-off band pattern similarity resulted in 6 clusters with little similarity to one another. In cases of CCARM 1C798 and 1C950, CCARM 1C916 and 1C847, and CCARM 1D566 and 1D587, they had the same antimicrobial resistance pattern, the same resistance gene profile, and high band pattern similarity on PFGE (>80%). On the other hand, CCARM 1F020 and 1E187 had the same antimicrobial resistance pattern and gene profile (tet[A], cat I, flo[R], blaTEM , aph[3′]-Ia, ant[3″]-I, aac[3]-IV int, class I) with low band pattern similarity (<40%). In Figure 2, PFGE profiles of the most frequently found genotypes resulted in 10 patterns with an 80% cut-off band pattern similarity. Strains belonging to group A showed similarities to each other. However, strains belonging to groups B and C yielded nine different PFGE profiles (Table 6). Some strains could not be analyzed repetitively by PFGE because of degradation of the DNA. All of these strains unable to be typed by PFGE belong to group D, which corresponds to genotypes tet(B), cat I, flo(R), blaTEM , dfr1, aph(3′)-Ia, ant(3′″)-I, aac(3)-IV, and int.
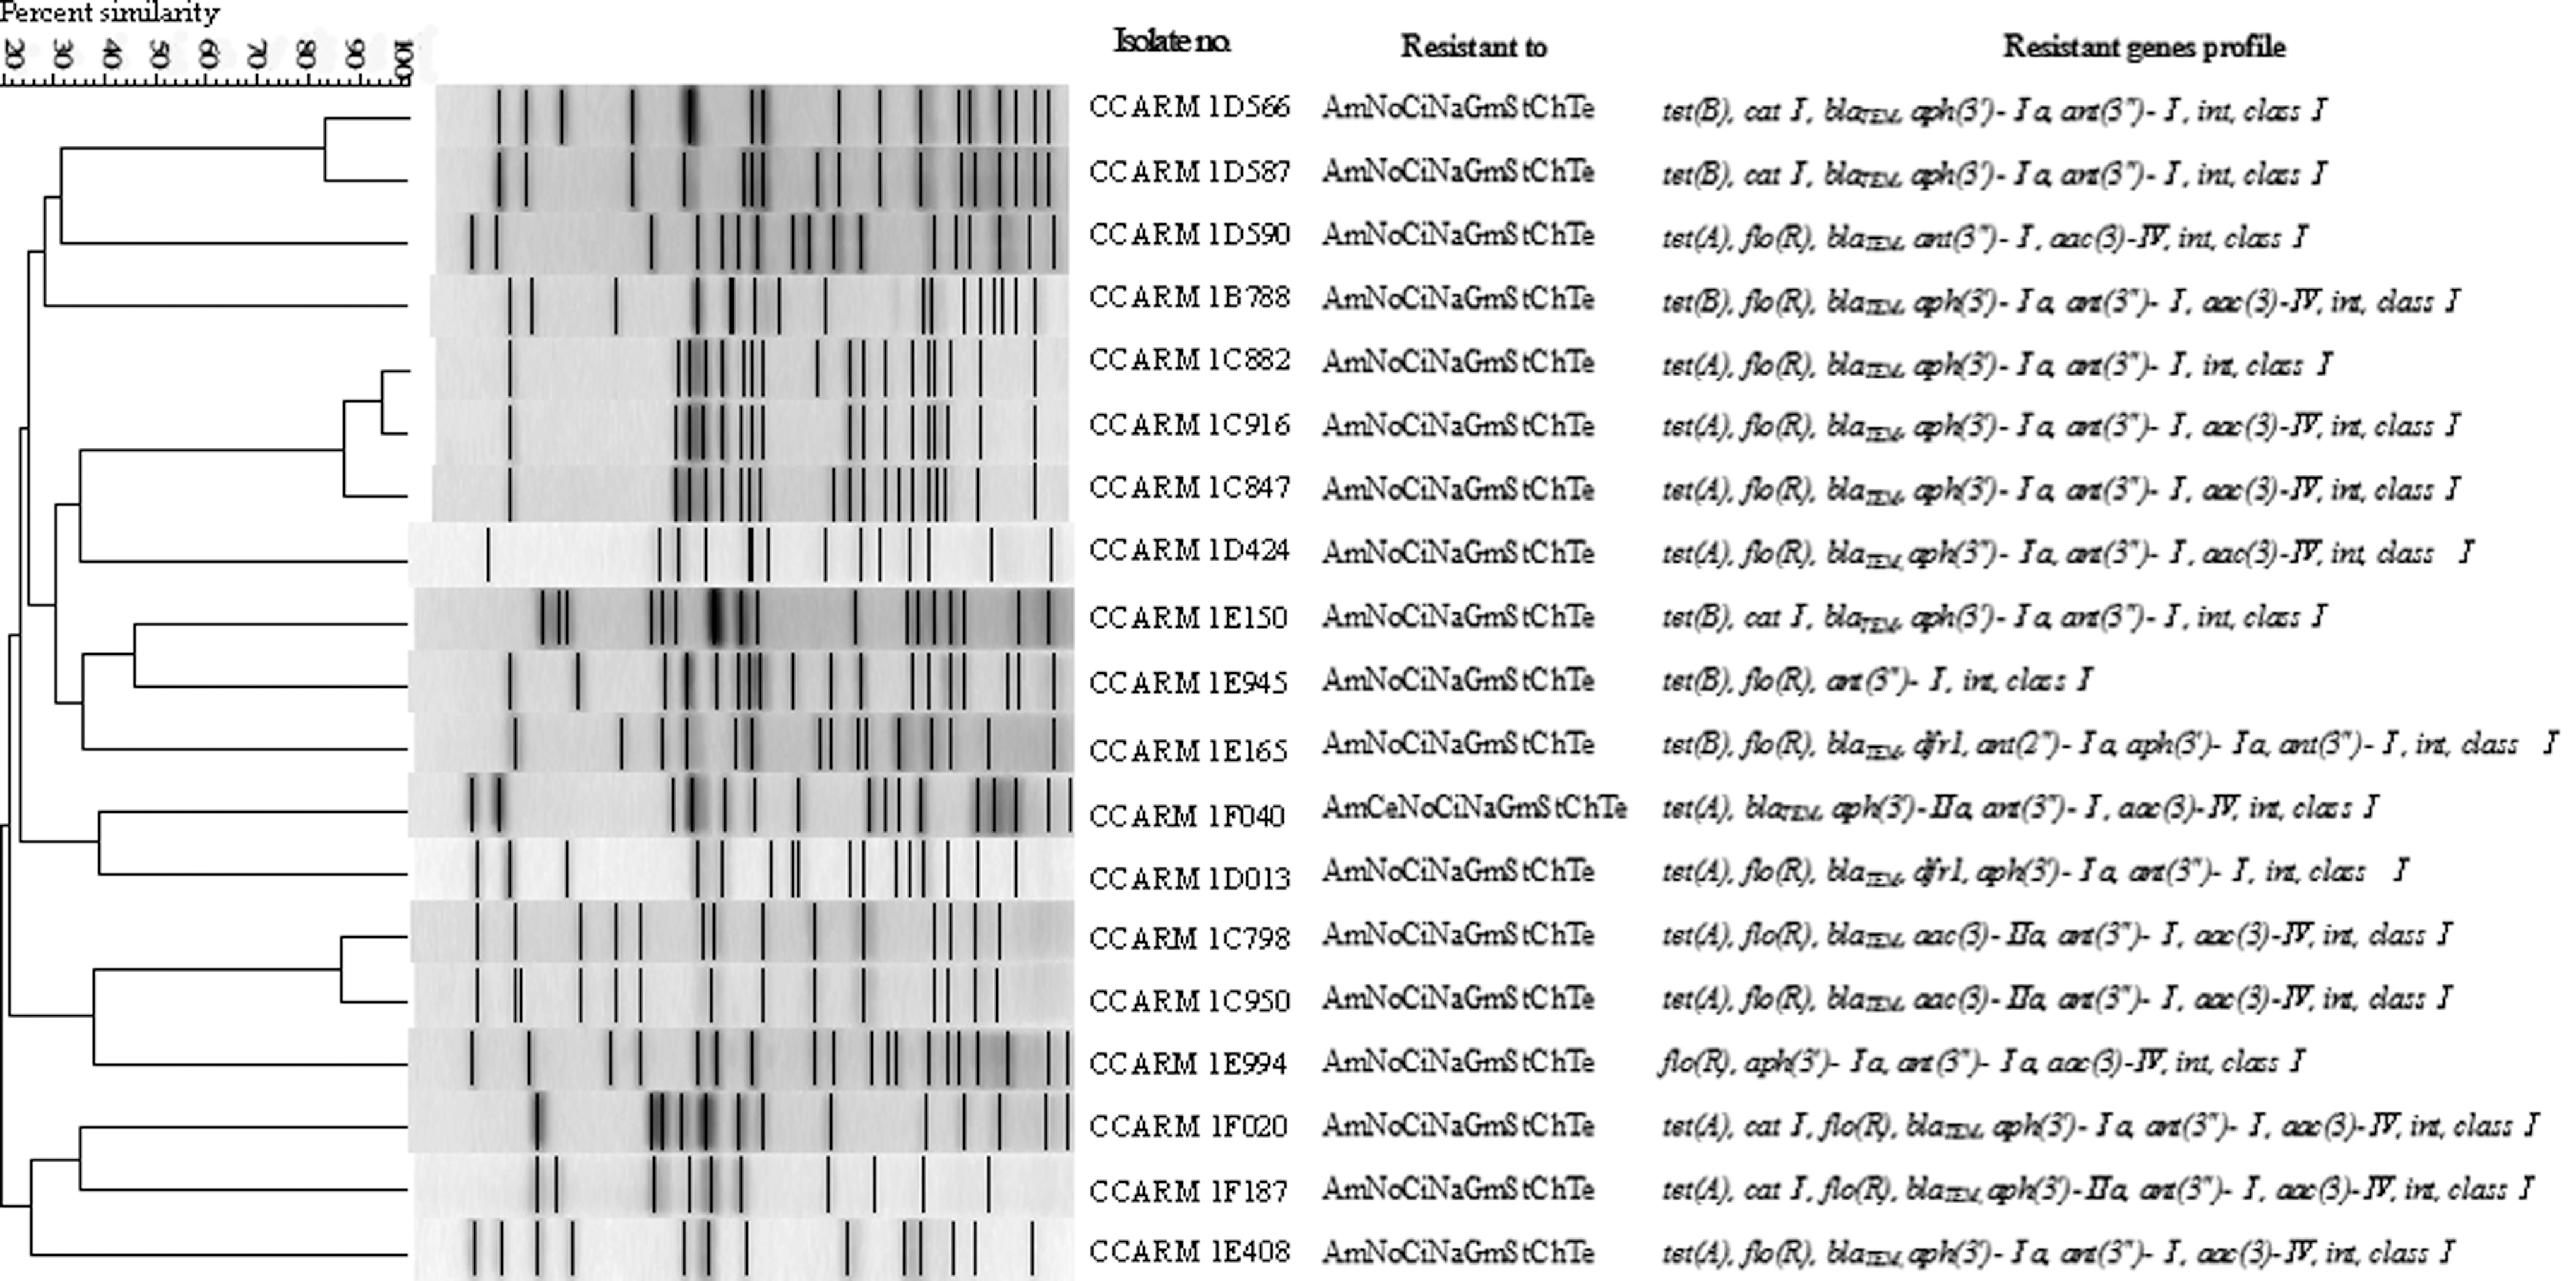
Pulsed-field gel electrophoresis of XbaI-digested DNA of porcine multidrug-resistant Escherichia coli isolates containing class I integrons. The dendrogram was produced with Jaccard analysis.
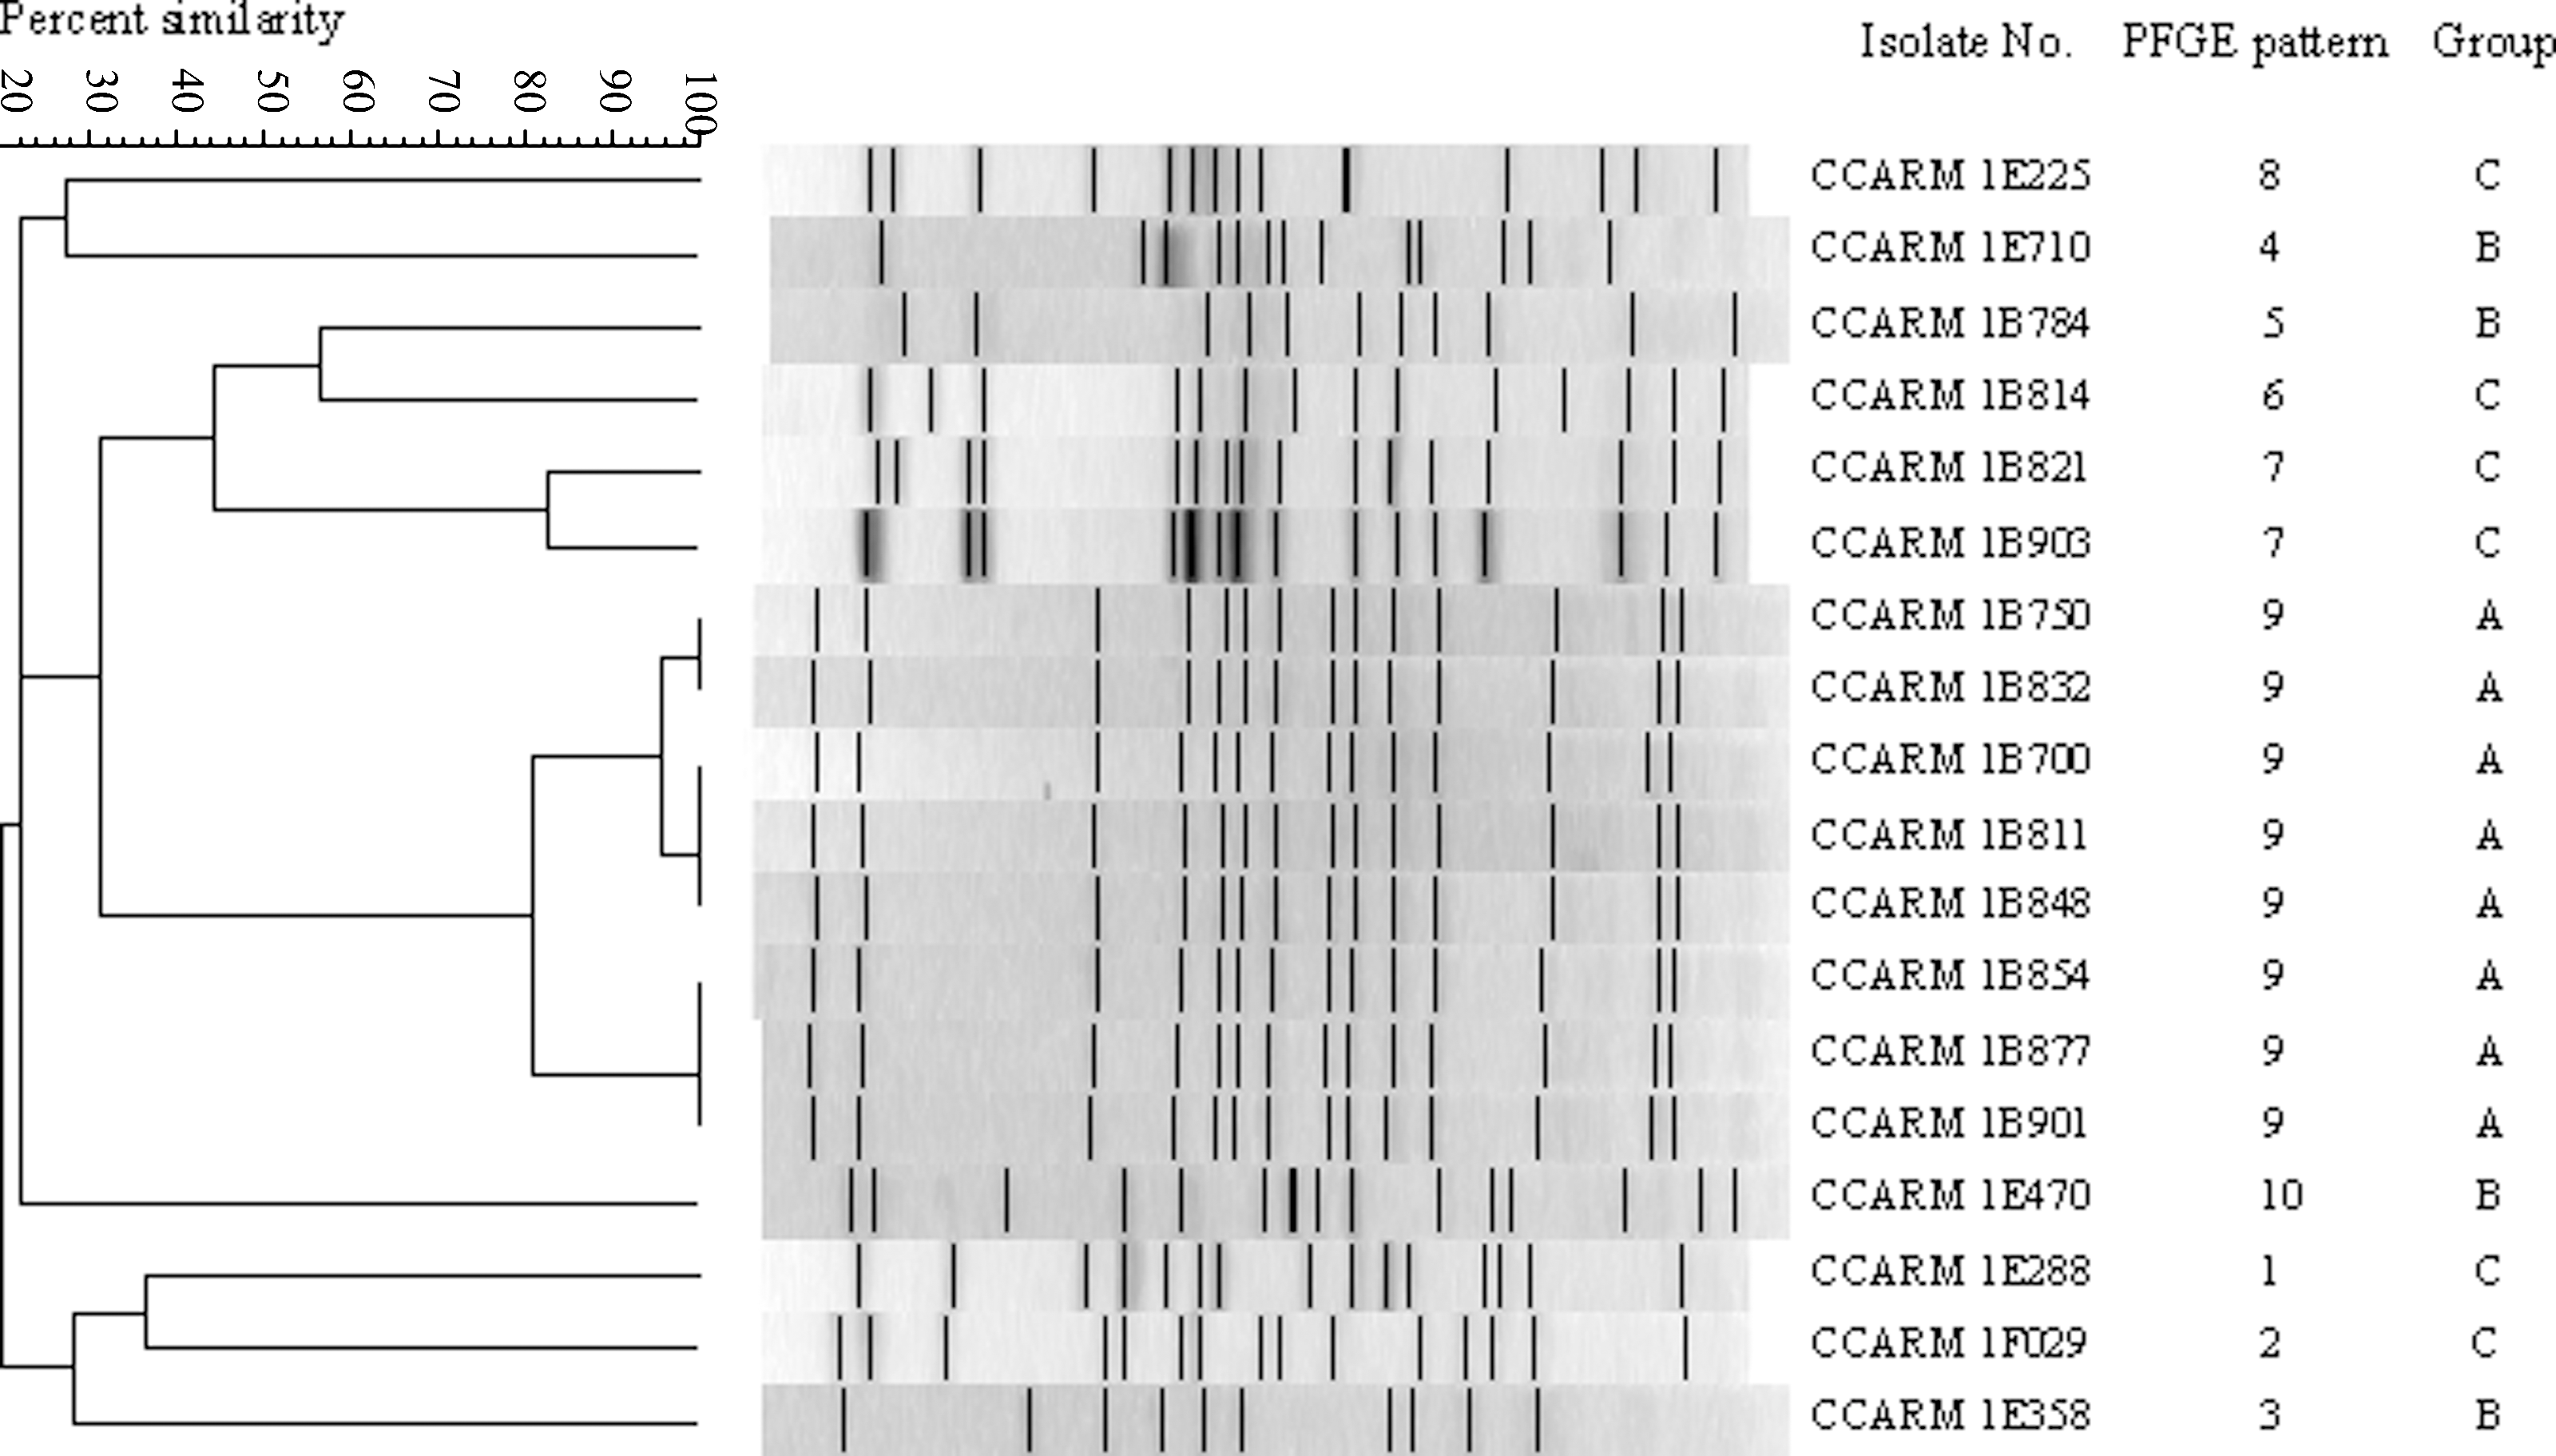
Pulsed-field gel electrophoresis (PFGE) of XbaI-digested DNA of the most frequently found genotypes among 92 porcine multidrug-resistant Escherichia coli isolates. The dendrogram was produced with Jaccard analysis.
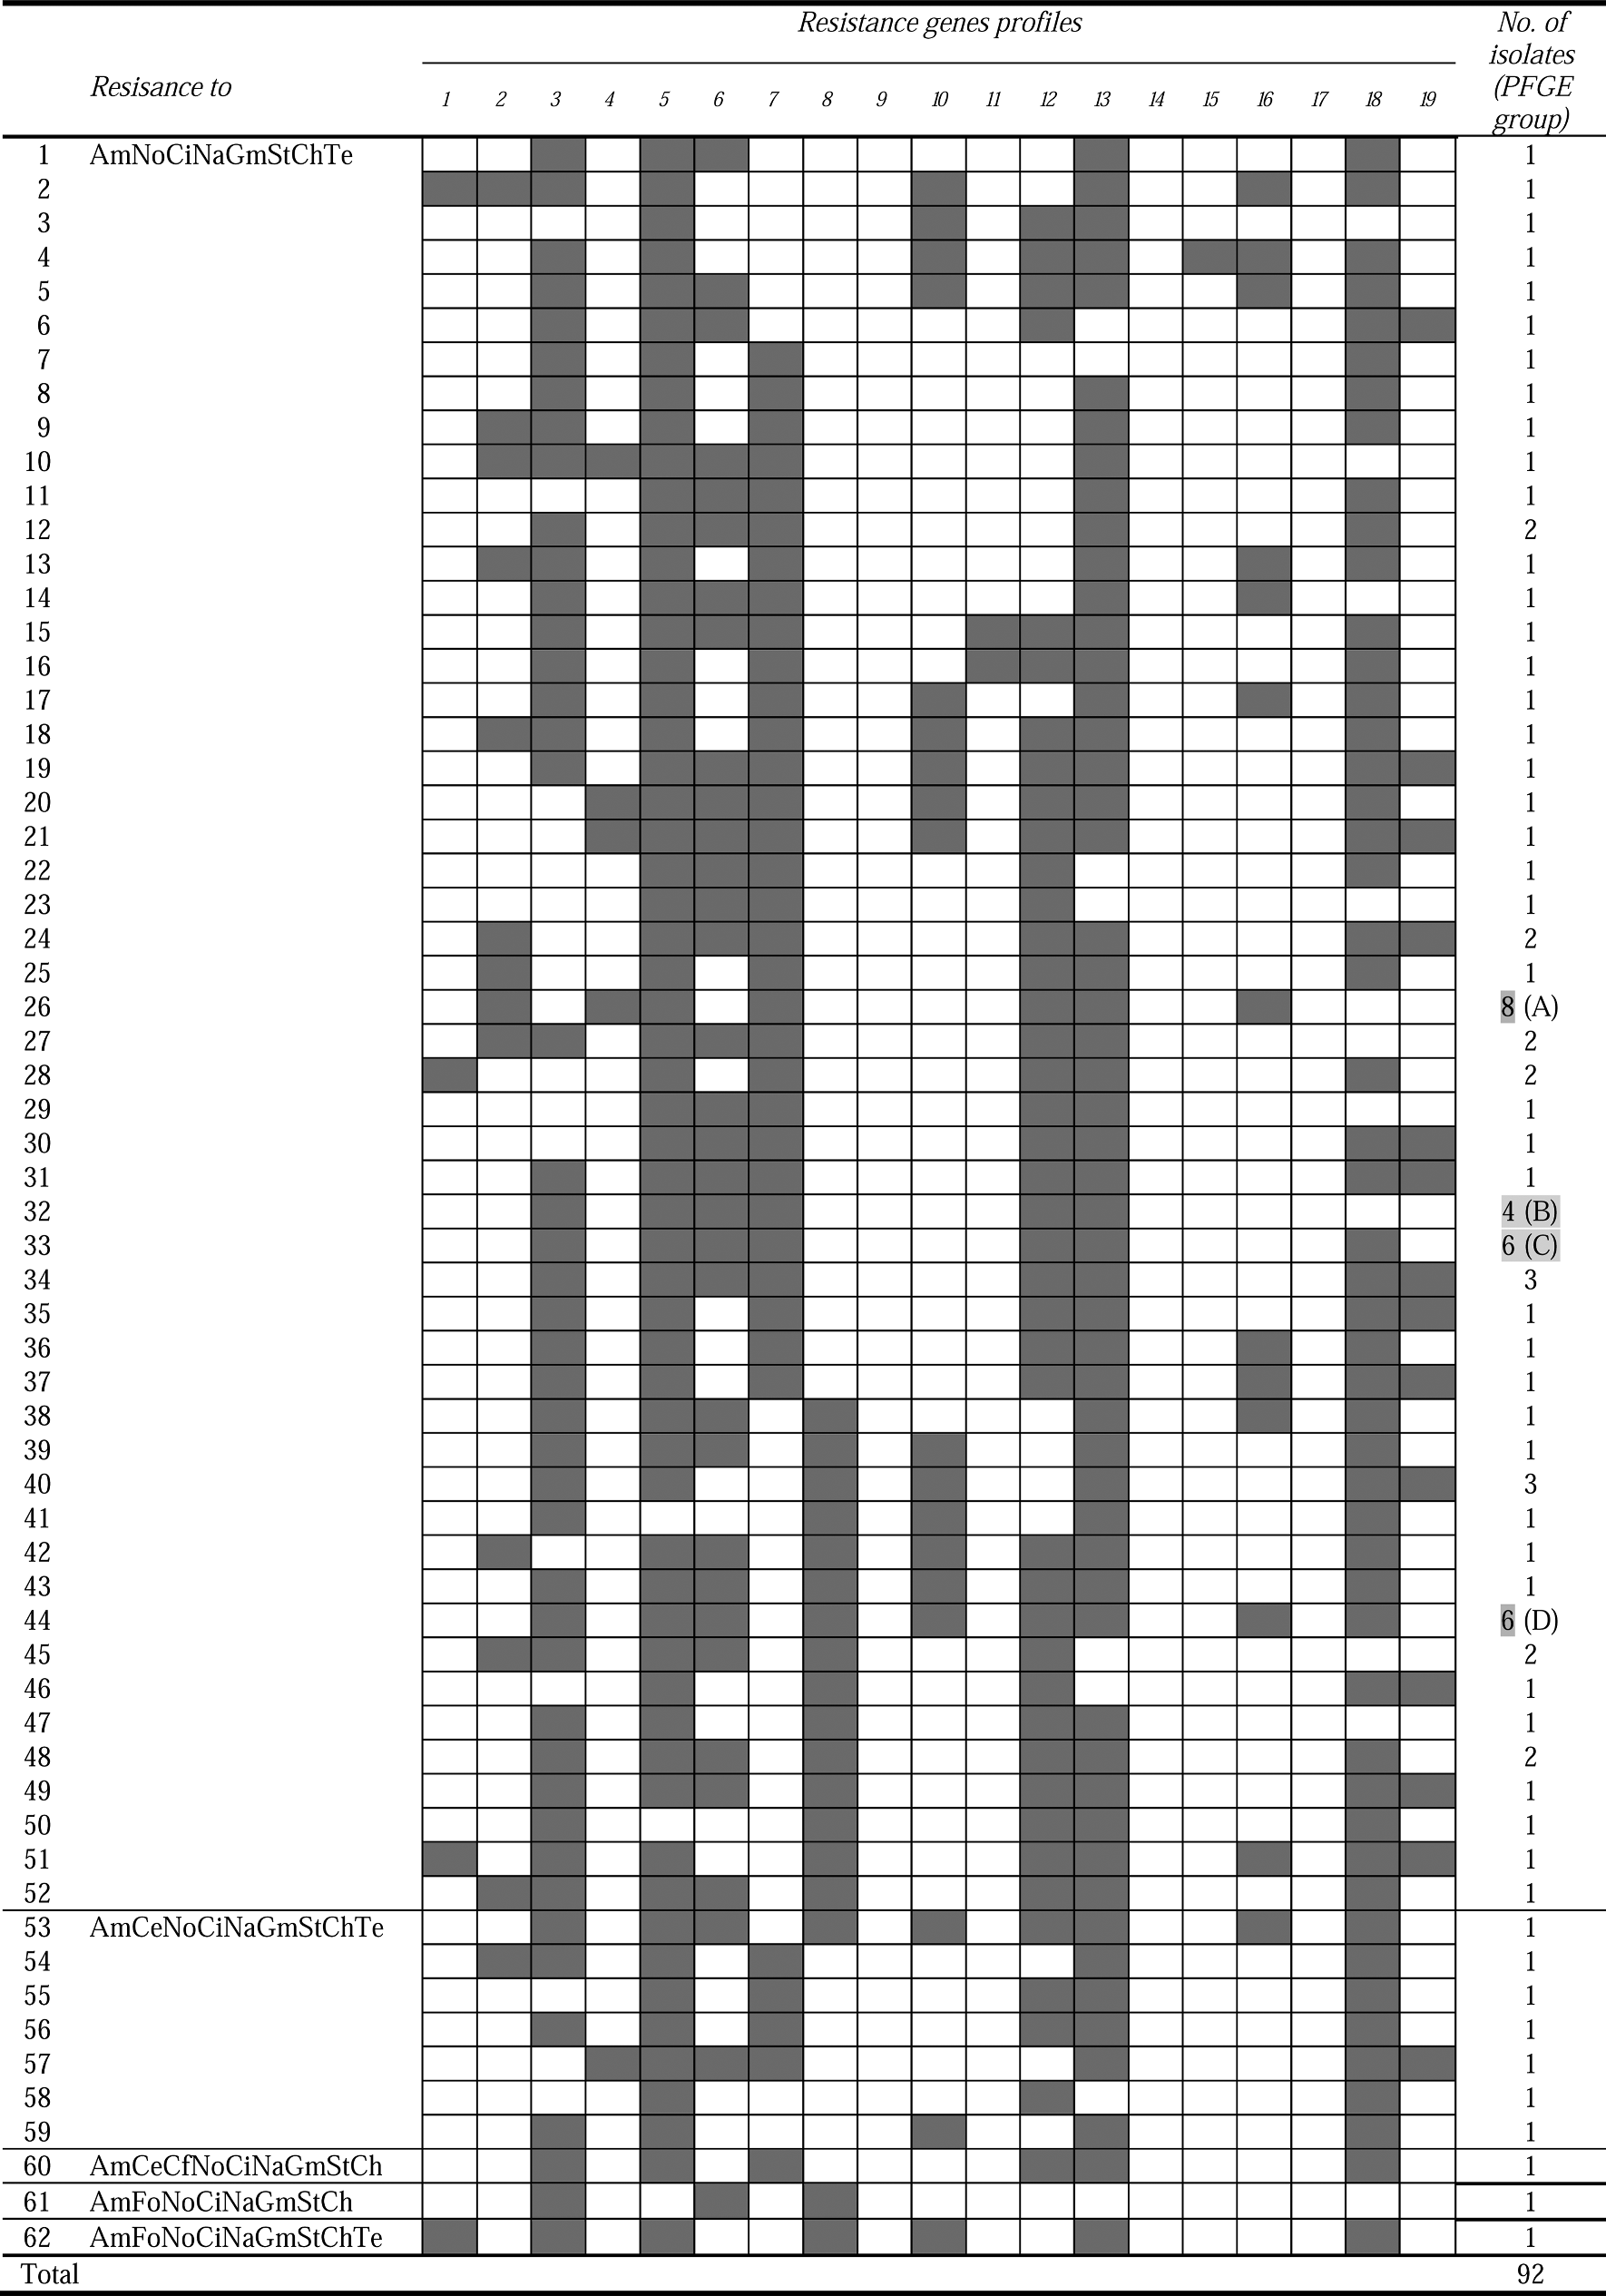
PFGE, pulsed-field gel electrophoresis; Am, ampicillin; No, norfloxacin; Ci, ciprofloxacin; Na, nalidixic acid; Gm, gentamicin; St, streptomycin; Ch, chloramphenicol; Te, tetracycline; Ce, cephalothin; Cf, cephazolin; Fo, cefoxitin. Shading indicates the most frequently found genotypes among 92 MDR isolates. 1, ant(2″)-Ia; 2, aac(3)-Ia; 3, aph(3′)-Ia; 4, aph(3′)-Ia; 5, ant(3″)-I; 6, aac(3)IV; 7, tet(A); 8, tet(B); 9, tet(C); 10, cat I; 11, catII; 12, floR; 13, blaTEM ; 14, blaSHV ; 15, blaOXA ; 16, dfrI; 17, qnr; 18, int; 19, class integron.
Discussion
Antimicrobial resistance in humans as well as in animal husbandry has become a worldwide problem (Murray, 1992). Normal gut microflora of humans and warm-blooded animals such as E. coli and enterococci may contaminate the carcasses of animals during slaughter and may enter the human alimentary tract via food (Aarestrup and Wegner, 1999). There have been many concerns about transmission of antimicrobial resistance and resistant genes of animal origin to humans under the selective pressure of antimicrobials (Marshall and Levy, 2011). For this reason, many countries have banned various antimicrobial agents in animal husbandry. Since 2005, Korea has been gradually reducing the use of antimicrobials in animals. At present, the use of antimicrobials in animal husbandry has been totally banned except for therapy with the prescription of a veterinarian (Pharmaceutical affairs act, Chapter VIII supplementary provisions, Article 85; Special cases concerning animal drugs, etc.,
Rates of resistance to the various antimicrobial agents in pigs are different from those in humans. For instance, resistance rates of ampicillin, gentamicin, and tetracycline of E. coli human isolates in 2005 were 43.7%, 1.8%, and 39.5%, respectively (Kang et al., 2005), which were lower than those of porcine isolates in 2003 and 2004 (i.e., 66.1% for ampicillin, 66.8% for streptomycin, and 96.3% for tetracycline) (Lim et al., 2007) and lower than those in this study. In Canada, resistance rates of food animal isolates in 2009 were 22% for ampicillin, 38% for streptomycin, 83% for chloramphenicol, and 10% for tetracycline (Kozak et al., 2009). The resistance rate of tetracycline is lower than that in our study and in other previous reports (Kang et al., 2005; Lim et al., 2007), which seemed to be directly linked to the high use of tetracycline. In the case of cephalosporin-class antimicrobials, resistance rates were comparably low. We suggest low resistance rates to be attributable to the use of cephalosporin class antimicrobials only as therapeutic antimicrobials. Even though a previous work (Animal and plant quarantine agency,
In this study, tet(A) was detected twice as often as tet(B) in MDR E. coli, while previous studies (Tuckman et al., 2007; Rosengren et al., 2009) reported various percentages of different tetracycline resistance genes with more frequent detection of tet(B) than tet(A). Regional enzyme distribution for aminoglycoside resistance was found to be different from country to country (Magnet et al., 2003). For instance, in neighboring China, the dominant type of aminoglycoside-modifying enzyme of gentamicin-resistant E. coli clinical isolates was aac(3)-II (84.8%) (Xiao and Hu, 2012). In Spain, the first and second frequently detected genes in aminoglycoside-resistant clinical Enterobacteriaceae were aph(3′)-Ib (65.4%) and ant(3″)-I (37.5%). (Miró et al., 2013). In Canada, aminoglycoside-resistant E. coli animal isolates yielded 100% of aph(3′)-Ia; on the contrary, ant(2″)-Ia, aac(3)-IV, and aph(3′)-IIa were not found (Maynard et al., 2004). In this study, the most frequently found gene responsible for aminoglycoside resistance was ant(3″)-I (97.8%), followed by aph(3′)-Ia (85.9%) and aac(3)-IV (57.6%). On the contrary, ant(2″)-Ia, aac(3)-IIa, and aph(3′)-IIa genes were found at low frequencies. From a total 41 MDR isolates, ant(3″)-I, aph(3′)-Ia, and aac(3)-IV were detected concurrently, as shown in Table 6.
In this study, the qnr gene was not detected in any porcine isolates. Plasmid-mediated quinolone resistance has been found rarely in E. coli isolated from other areas of the world, and prevalence of the qnr gene in Korea and the United States was as low as <1% of resistant E. coli clinical isolates (Wang et al., 2004; Jeong et al., 2005). The most frequently detected ß-lactamase was blaTEM , comprising 90.2% of MDR isolates, which is consistent with other studies (Pai et al., 1999; Costa et al., 2008).
Comparisons with the results from studies performed in China and Germany revealed that E. coli porcine isolates carried a somewhat different range of gene cassette arrays in class I and class II integrons (Yang et al., 2004; Kadlec and Schwarz, 2008). Cassette array consisting of aadA1-dfrA1 within class I integron was the most prevalent one, while the next prevalent was aadA1 in both countries. According to a report by other Korean researchers who covered a different period during 2001–2003, class I integron carrying aadA1 was the most prevalent one as observed this study (Kang et al., 2005).
According to PFGE, the majority of isolates were genetically diverse while some isolates exhibited a clonal relationship. For instance, CCARM 1C798 and 1C950 had the same antimicrobial resistance pattern, the same genes profile, and high genetic similarity (>80%) with each other, whereas CCARM 1F020 and 1E408 had the same antimicrobial resistance pattern, the same gene profile, and low genetic similarity (<40%). In the conjugation experiment, the transconjugants acquired resistance to ampicillin, norfloxacin, gentamicin, tetracycline, and chloramphenicol and addI was detected in transconjugants. This result showed that E. coli from animal origin may enter into the food chain, making them a possible transmitter of resistance genes.
This study indicates that the degree of antimicrobial resistance and corresponding genes in E. coli porcine isolates are not identical to those of human origin described by previous studies. This may be attributable to different kinds of antimicrobials and the extent of antimicrobial use in animal husbandry and the clinical environment. Various PFGE profiles suggested various origins of these isolates, not one or two origins. Since the high prevalence of antimicrobial resistance in E. coli isolates from pigs is extremely concerning, this needs to be studied further with human and animal isolates after ban of antimicrobials in animal husbandry in Korea. Although the possibilities of transfer and origin of antimicrobial resistance genes from animal to human and vice versa are still controversial, this study provides further support regarding the emergence of the MDR strains in animals.
Footnotes
Acknowledgments
This work was supported by a special grant from Seoul Women's University (2014).
Disclosure Statement
No competing financial interests exist.