
Abstract
Background:
Estimates of the incidence of foodborne illness are increasingly used at national and international levels to quantify the burden of disease and advocate for improvements in food safety. The calculation of such estimates involves multiple datasets and several disease multipliers, applied to dozens of pathogens. Unsurprisingly, this process often produces wide interval estimates.
Materials and Methods:
Using a model of foodborne gastroenteritis in Australia, we calculate the contribution of both data and multipliers to the width of the interval. We then compare pathogen-specific estimates of the proportion of gastroenteritis that is foodborne from national-level studies conducted in Canada, Greece, France, the Netherlands, New Zealand, the United Kingdom, and the United States.
Results:
Overall, we estimate that 74% (range 63–92%) of the interval width for foodborne gastroenteritis in Australia is a result of uncertainty in the proportion of gastroenteritis that is due to contaminated food. Across national studies, we find considerable variability in point estimates and the width of interval estimates for the foodborne proportion for relatively common pathogens such as Salmonella spp., Campylobacter spp., and norovirus.
Conclusions:
While some uncertainty in estimates of gastroenteritis incidence is inevitable, an understanding of the drivers of this uncertainty can help to focus further research. In particular, this work highlights the value of studies quantifying the routes of transmission for common pathogens.
Introduction
F
These studies of foodborne incidence typically rely on many datasets, with data quality varying by pathogen. Incidence estimates require multipliers to adjust for underreporting to surveillance systems, travel-associated cases, and to take account of underdiagnosis. A key multiplier is the proportion of incident cases that are due to foodborne transmission. This multiplier is commonly estimated for each pathogen using expert opinion, and imputed for all gastroenteritis based on the estimates for known pathogens. Estimates of the proportion of all gastroenteritis that is foodborne range from around 20% in Canada (Thomas et al., 2013), 25–26% in Australia, the United States, and the United Kingdom (Adak et al., 2002; Scallan et al., 2011a, b; Ford et al., 2014; Kirk et al., 2014), to 39% in the Netherlands (Havelaar et al., 2012), with differences partly driven by selection of pathogens in these studies.
When reporting estimates of foodborne incidence, it is crucial that uncertainty in both data and multipliers be acknowledged. A common approach is to define probability distributions for inputs, and use simulation techniques to produce interval estimates for all outcomes. While the resulting interval estimates reflect the many sources of uncertainty in data and multipliers, it is often unclear which components are most responsible for uncertainty in the final estimates. In this article, we apply models of gastroenteritis for Australia to identify the contribution of the various multipliers towards overall uncertainty in incidence for individual pathogens and for total incidence. We then focus in particular on the foodborne multiplier, and compare estimates for key pathogens from an additional eight national-level studies.
Materials and Methods
Full details of the approach used to estimate the incidence of gastroenteritis and its sequelae in Australia are given elsewhere (Ford et al., 2014; Kirk et al., 2014). Briefly, estimates of incidence were made either using a “top-down” approach using cohort study data, or a “bottom-up” approach using either laboratory-based or other surveillance data. Box 1 provides a summary of the approaches used to calculate incidence by data source. All calculations were made using a simulation technique in @Risk version 6 (
Here, we are concerned not with estimates of foodborne incidence, but with the impact of yearly variation in data, and uncertainty in multipliers on the width of this interval estimate. For simplicity, we will refer to each component that contributes to uncertainty as a “factor.” From Box 1, we see that there are 4 factors contributing to the interval estimate for non-typhoidal Salmonella: yearly variation in case numbers, the underreporting multiplier, the domestically acquired multiplier, and the foodborne multiplier (see Box 1 for full definitions of these factors). We quantify the percentage of uncertainty attributable to each factor as follows.
First, we calculated the true interval estimate with full uncertainty from all factors. Then we removed uncertainty from each factor in turn by replacing the distribution describing that factor with its mean estimate. For example, the underreporting multiplier used for nontyphoidal Salmonella is given by a lognormal distribution with mean 7.4 and SD 2.4. We removed uncertainty due to underreporting by replacing this distribution a constant multiplier of 7.4, and calculated the reduction in the width of the calculated interval. In this case, the interval was shortened from [21,000–73,000] to [29,000–56,000], and thus we attributed 42% of total uncertainty to the underreporting multiplier. Replacing other factors in turn allowed us to estimate that 15% of uncertainty was due to the yearly variation in case numbers, 6% of uncertainty was due to the domestically acquired multiplier, and 37% of uncertainty was due to the foodborne multiplier. As a result of the multiplicative nature of the model, the proportion attributed to each factor changed depending on the order in which factors were replaced by their mean value, with lower proportions attributed to the first factor replaced. To account for this, we performed the calculation for every ordering, and calculated the mean value and the range for each factor. For instance, we attributed a mean of 57% (range: 42–82%) of uncertainty in the estimate of nontyphoidal Salmonella incidence to the underreporting multiplier.
A similar approach was used to calculate the contribution of various factors to total gastroenteritis. To reduce the complexity of the calculations, we combined factors that were found to be less influential at the pathogen level. That is, the “other multipliers” factor included the domestically acquired multiplier, the gastroenteritis multiplier, the time trend multiplier, and the outbreak multiplier (see Box 1 for definitions of each of these multipliers).
We focused in particular on the foodborne multipliers, which describe the proportion of cases of each pathogen that are transmitted by food. In our comparison of international studies, we extracted point estimates and (where available) interval estimates used in Australia, Canada, United States, Greece, the Netherlands, New Zealand, France, and the United Kingdom (Adak et al., 2002; Vallant et al., 2005; Lake et al., 2010; Gkogka et al., 2011; Scallan et al., 2011b; Havelaar et al., 2012; Thomas et al., 2013; Kirk et al., 2014), recording the techniques used to calculated these multipliers (note that U.S. estimates are provided in their Technical Appendix 3). For reasons of space, we excluded pathogens that were rare or largely foodborne (such as Bacillus cereus, and Staphylococcus aureus) and those that appear in relatively few international studies (such as sapovirus) from this analysis. Although some studies have identified the relative combination of different food sources (Havelaar et al., 2008), we focus only on overall foodborne proportions. Where interval estimates were provided in a different format, we converted these to 90% intervals using @Risk in order to reflect recent reporting of foodborne multipliers (Scallan et al., 2011b) and to ensure that interval estimates were more readily comparable.
Results
Figure 1 presents the percentage of total uncertainty that can be attributed to the multipliers listed in Box 1 for total gastroenteritis and foodborne gastroenteritis including all 19 pathogens. Each graph shows the percentage of total uncertainty that is attributed to each multiplier for the given pathogen, with bars representing the mean estimate and intervals giving the range. The foodborne multiplier was clearly the biggest source of uncertainty in estimates of foodborne gastroenteritis, responsible for 74% (range 63–92%) of total uncertainty. The pathogen fraction multiplier and the underreporting multiplier were the next most influential, accounting for 10% (range 2–24%) and 9% (range 2–22%) of foodborne gastroenteritis, respectively.
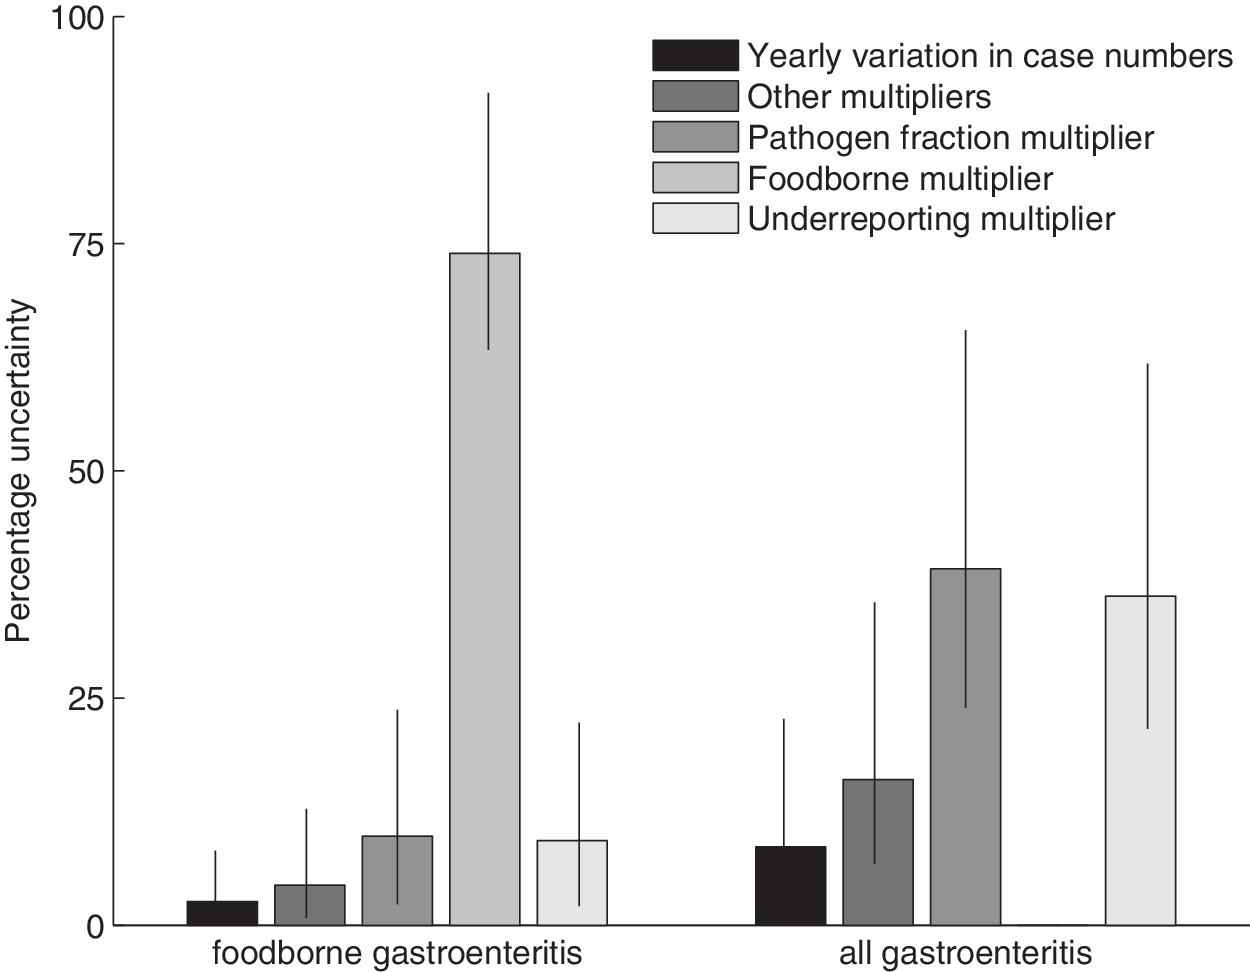
Contribution of multipliers and yearly variation to uncertainty in estimates of foodborne and total gastroenteritis. The “other multipliers” bar includes the domestically acquired multiplier used for laboratory-based surveillance data, the gastroenteritis multiplier and time trend multiplier used for cohort data, and the outbreak multiplier used for other surveillance data (see Box 1 for details). In each case, the bars represent the mean estimate and the intervals represent the range.
In Figure 2, we explored uncertainty at the pathogen level, with estimates grouped according to the data source used as laboratory-based surveillance data, cohort data, and other surveillance data, which includes a register of all gastrointestinal and foodborne outbreaks in Australia. When using laboratory-based surveillance data, most uncertainty arose from modeling underreporting in the data, and from uncertainty in the proportion of incident cases that acquired their infection from food. The contribution of yearly variation in case numbers largely reflected the propensity for that pathogen to lead to outbreaks, with much greater contributions for Listeria monocytogenes, Cryptosporidium spp., and Salmonella spp. than for pathogens that were rarely associated with outbreaks, such as Campylobacter spp. As we are estimating the proportion of uncertainty due to different components, the very precise estimate of the foodborne multiplier for L. monocytogenes amplifies the role of other multipliers here.
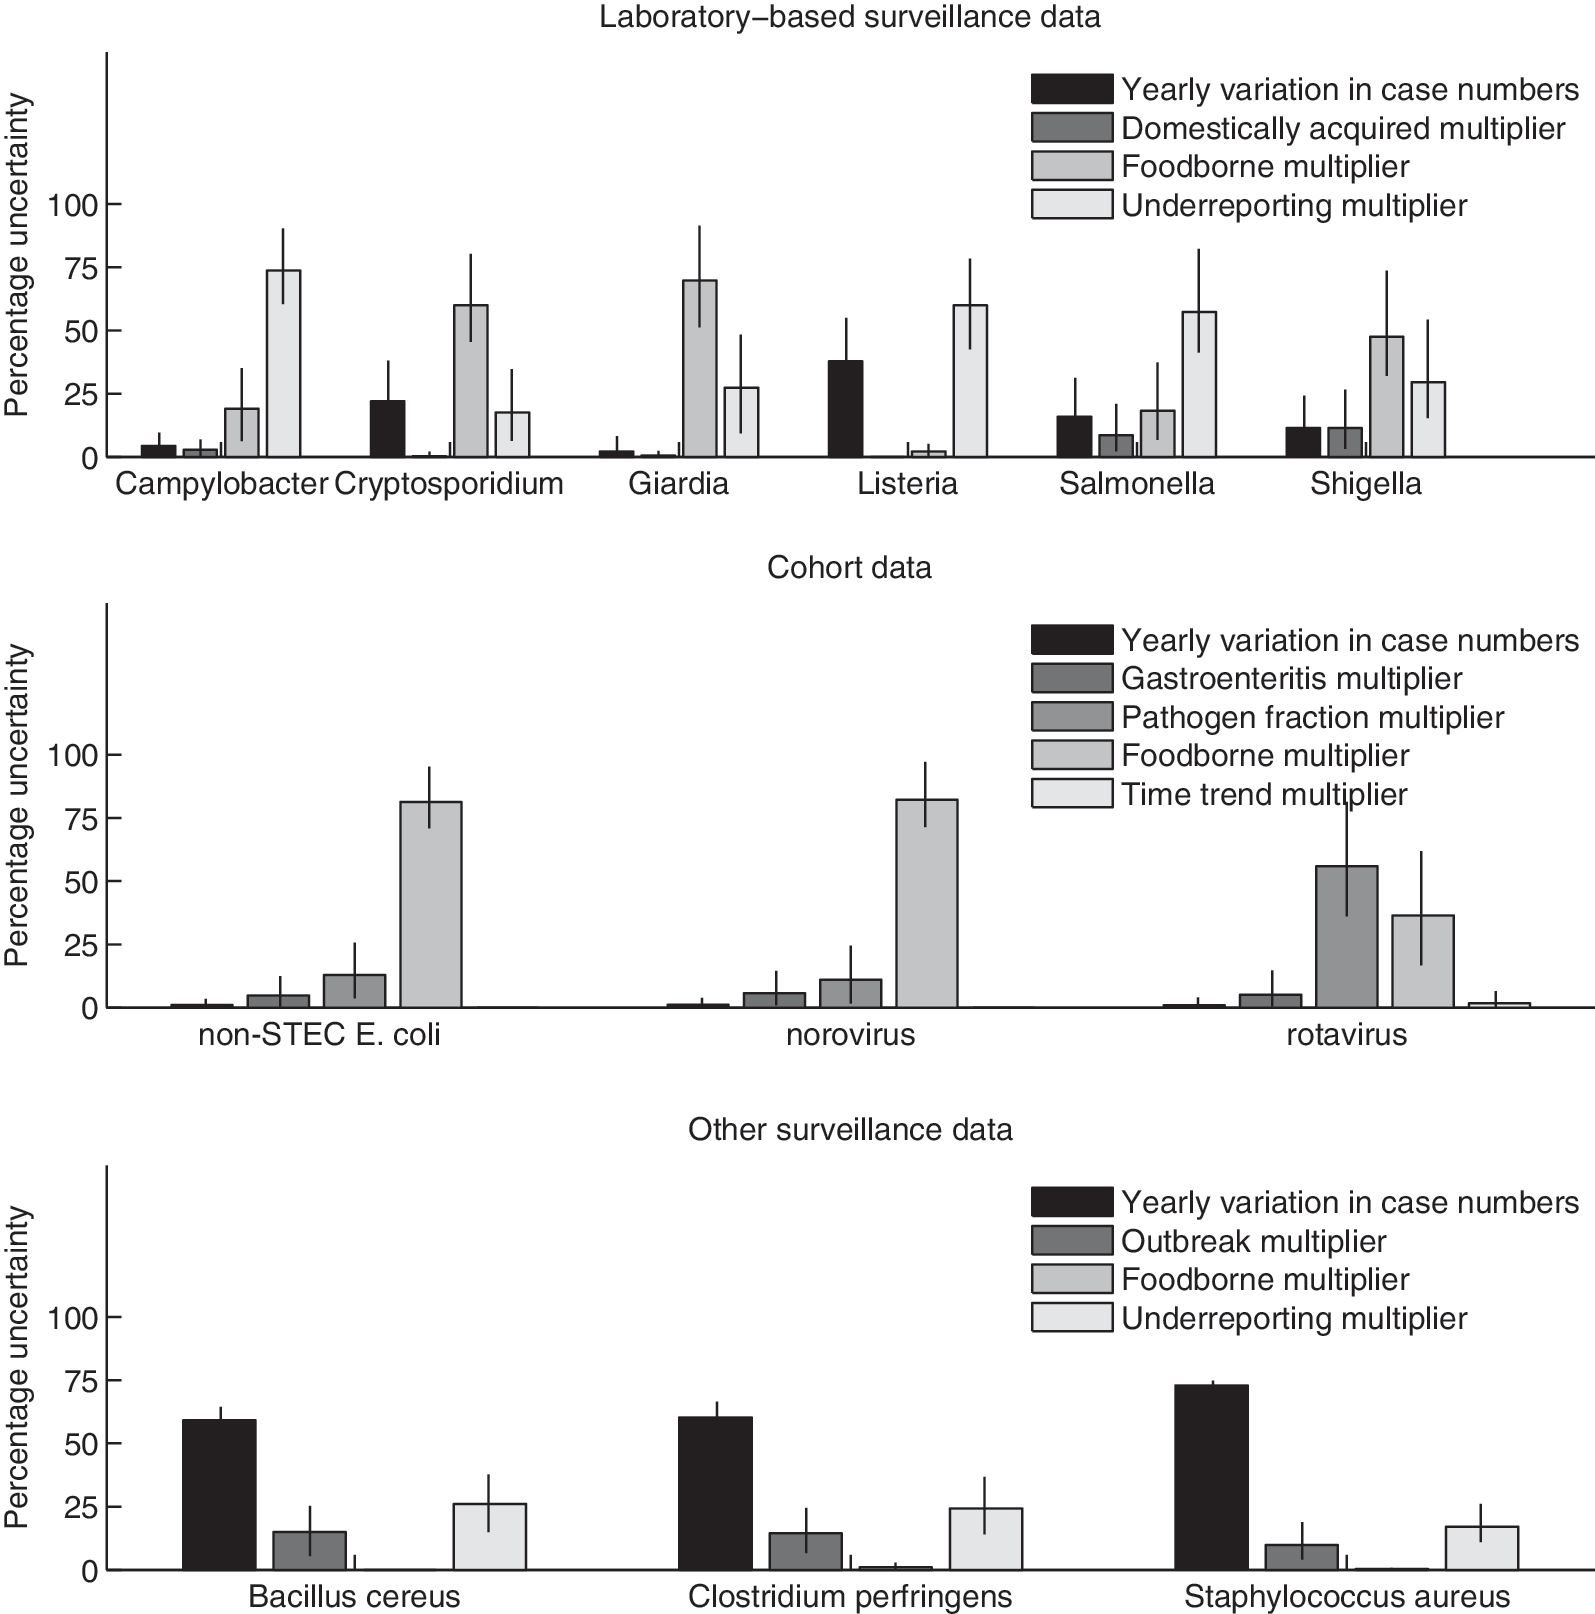
Percentage of total uncertainty that can be attributed to input data and multipliers for various pathogens, grouped by data source as laboratory-based surveillance data, cohort data, and other surveillance data (see Box 1 for further details of methods, data, and multipliers). Bars represent the mean estimate, and intervals represent the range. E. coli, Escherichia coli.
In the case of cohort study data, the foodborne multiplier was the largest source of uncertainty for both other pathogenic Escherichia coli and norovirus, responsible for around 80% of total uncertainty. This may reflect less experience of experts involved in estimating this multiplier (Vally et al., 2014), as these pathogens are not notifiable in any state of Australia. The foodborne multiplier was also responsible for 36.5% of uncertainty for rotavirus, despite the relatively tight distribution of 2% (90% Credible Interval 1–3) for the rotavirus foodborne multiplier.
The biggest source of uncertainty for pathogens estimated using other surveillance data was the yearly variability in numbers. As incidence data used here were derived from outbreak registers, this reinforces the finding that outbreak-associated pathogens have more variable case numbers from year to year. These pathogens (Bacillus cereus, Clostridium perfringens, and S. aureus) are assumed to be either entirely or largely transmitted by contaminated food, and thus the foodborne multipliers have little influence on uncertainty.
Given the importance of the foodborne multiplier in driving uncertainty in the estimates, we compared international estimates of this multiplier. Figure 3 presents the foodborne multiplier used in studies from Australia, Canada, United States, Greece, the Netherlands, New Zealand, France, and the United Kingdom (Adak et al., 2002; Vallant et al., 2005; Lake et al., 2010; Gkogka et al., 2011; Scallan et al., 2011a, b; Havelaar et al., 2012; Thomas et al., 2013; Ford et al., 2014; Kirk et al., 2014), showing both point and interval estimates where available, with all intervals transformed to a 90% interval for ease of comparison. We found that there was considerable international variation in both the values of the multipliers and the degree of uncertainty included in the multiplier. Comparing estimates across all pathogens, intervals for foodborne multipliers used in the U.S. study were relatively tight for most pathogens, while the intervals for the New Zealand study were wide. The choice of method used for each study seems likely to be important here; while the Australian, Canadian, and New Zealand studies all used a formal expert elicitation process, the United States based their estimates on case–control and risk factor studies, together with outbreak and surveillance data. Across studies, the pathogens with the greatest variation in point estimates and in the width of interval estimates include commonly acquired pathogens such as Campylobacter spp., Salmonella spp., and norovirus.
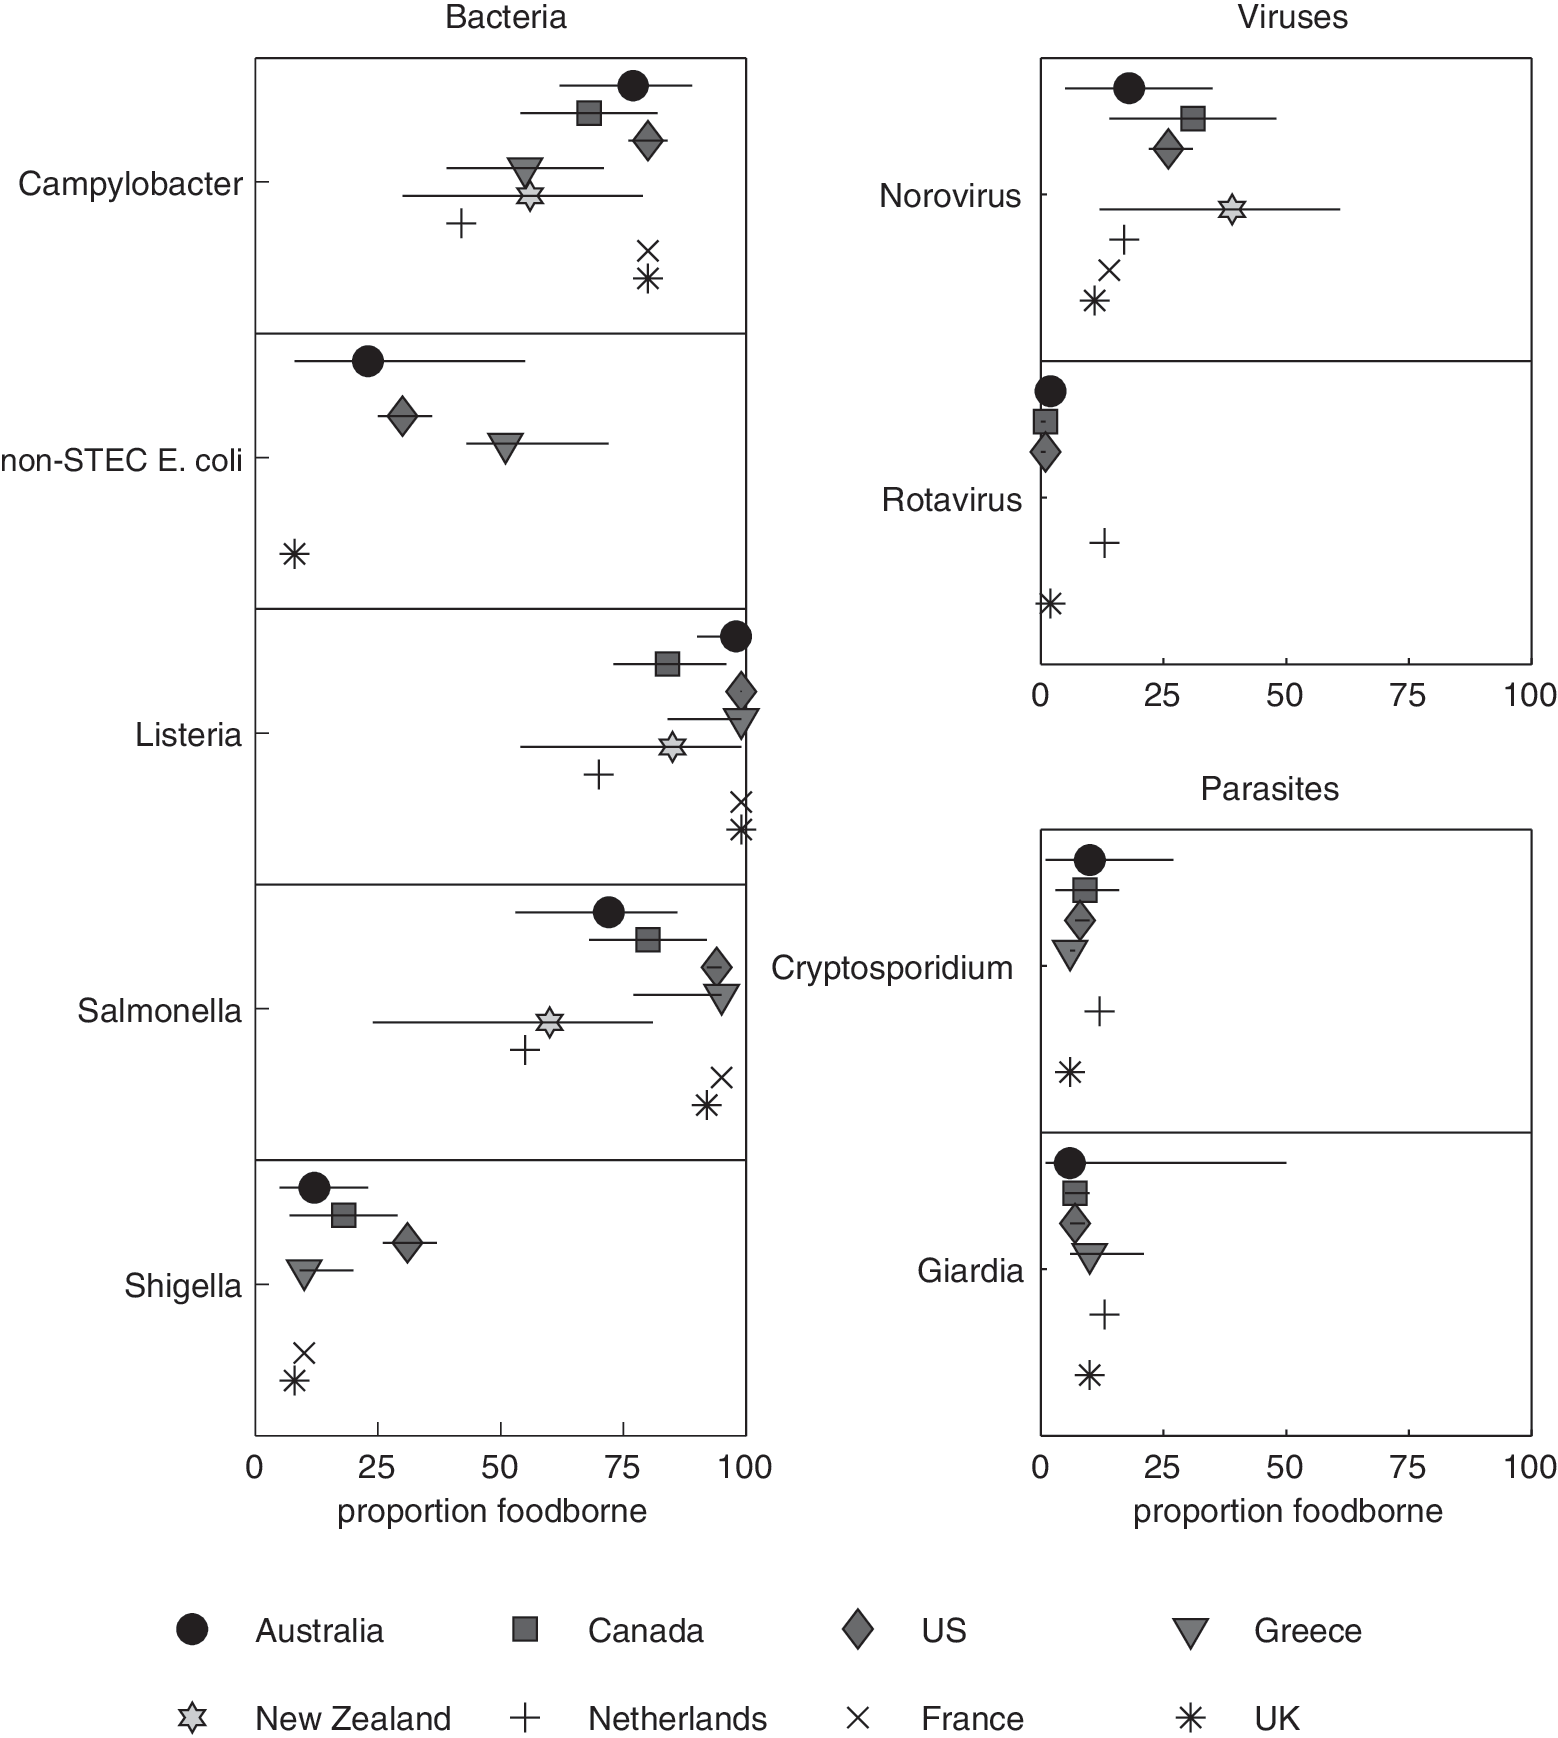
The proportion of gastroenteritis that is assumed to be foodborne for selected pathogens, grouped by pathogen type. Estimates are provided from eight different countries (Australia [Kirk et al., 2014], Canada [Thomas et al., 2013], United States [Scallan et al., 2011b], Greece [Gkogka et al., 2011], the Netherlands [Havelaar et al., 2012], New Zealand [Lake et al., 2010], France [Vallant et al., 2005] and the United Kingdom [Adak et al., 2002]). Where studies provide interval estimates, the interval has been transformed into a 90% interval using @Risk. E. coli, Escherichia coli.
Discussion
In this article, we present a new approach to quantifying sources of uncertainty in estimates of foodborne gastroenteritis incidence. We found that drivers of uncertainty varied by pathogen and by estimation approach, with the underreporting multiplier the main source of uncertainty for Campylobacter spp., Salmonella spp., and L. monocytogenes. The foodborne multiplier was the most influential factor for Cryptosporidium spp., Giardia lamblia, norovirus, other pathogenic E. coli, and Shigella spp.
The extent to which yearly variation in case numbers drives overall uncertainty for a given pathogen is typically a measure of the extent to which that pathogen is associated with outbreaks. That is, notifiable pathogens commonly associated with outbreaks, such as L. monocytogenes, Cryptosporidium spp., and Salmonella spp., have greater variation in yearly case numbers than other notifiable pathogens. Likewise, pathogens for which outbreak data are the only source of information on incidence have highly variable yearly estimates. It seems likely that this effect is particularly pronounced for a relatively small population such as Australia, which has around 1600 recorded outbreaks per year.
Given its key role in driving uncertainty in incidence estimates for common pathogens, it is not surprising that the foodborne multiplier contributes to uncertainty in estimates of total incidence of foodborne gastroenteritis; however, the extent of its importance is unexpected. We calculate that 74% (range 63–92%) of uncertainty in our estimate of foodborne gastroenteritis incidence is due to uncertainty in foodborne multipliers. We previously calculated that there were 798,000 cases of foodborne gastrointestinal illness of known pathogens in Australia each year, with credible interval 528,000–1,310,000 (Kirk et al., 2014). If all uncertainty due to foodborne multipliers was removed from this estimate, the credible interval would contract to 733,000–1,021,000.
Clearly it is not possible or desirable to remove all uncertainty due to routes of transmission in estimates of gastroenteritis incidence. However, a comparison of foodborne multipliers used internationally indicates a considerable range in both the estimates and in the levels of uncertainty in these estimates, with particularly narrow intervals in the U.S. study, and wide intervals in New Zealand. These findings may be partly due to the method used to calculate these intervals, with wider intervals from studies adopting a formal expert elicitation process. Given the high level of heterogeneity in these data—and bearing in mind the source for most estimates was expert elicitation—we felt it was inappropriate to attempt meta-analysis. This heterogeneity was particularly evident when we consider common pathogens such as norovirus, Salmonella spp., and Campylobacter spp., each of which rank as one of the four most common pathogens in most of the studies analyzed in Figure 3. For example, point estimates for the proportion of campylobacteriosis arising from contaminated food ranged from 42% to 80%, with one study producing a wide interval estimate of 30–79%, and another a much narrower interval estimate of 73–86%. The heterogeneity in estimates for common pathogens supports the findings of an analysis of structured expert elicitation studies, which identified that uncertainty was greatest for pathogens with more than one common transmission route (Havelaar et al., 2008).
To our knowledge, an attempt to quantify the drivers of uncertainty in foodborne burden of disease studies has not been made before, and the approach used here is therefore fairly simple. It is difficult to assess how well findings for Australia will generalize to different populations. It seems likely that larger countries will have less yearly variation in case numbers, particularly for pathogens commonly associated with outbreaks. The key role of the foodborne multiplier seems likely to apply to studies with similarly wide interval estimates for the proportion of transmission that is due to food (e.g., Canada [Thomas et al., 2013], Greece [Gkogka et al., 2011], and New Zealand [Lake et al., 2010]), but may not apply to the U.S. estimates that report much narrower intervals (Scallan et al., 2011b). Although methods used to derive estimates of the foodborne proportion influence levels of uncertainty, these estimates are used in burden of disease studies in a similar manner. Methods that reduce uncertainty in the foodborne proportion will result in narrower intervals for estimates of foodborne incidence.
Estimation of transmission routes for individual pathogens is challenging, and often relies on expert opinion (Havelaar et al., 2008; Vally et al., 2014). Outbreak investigations also offer good opportunities to provide data on sources of contamination (Van Duynhoven et al., 2005). Source attribution studies using microbial subtypes (Hald et al., 2004; Mullner et al., 2009a; David et al., 2013) or genotypes (Sheppard et al., 2009; Mullner et al., 2009b; Sears et al., 2011) provide an alternative approach that can also capture transmission routes for sporadic cases. Such studies are crucial for targeting control measures to reduce illness. Our findings highlight the additional value of these studies in reducing uncertainty in estimates of gastroenteritis incidence.
Footnotes
Disclosure Statement
Funding was provided by the Australian Department of Health, Food Standards Australia New Zealand, and the New South Wales Food Authority.