
Abstract
Aspergillus flavus is the main species from section Flavi responsible for aflatoxin accumulation in stored peanuts. Rapid methods to detect A. flavus could help to prevent aflatoxins from entering the food chain. A real-time polymerase chain reaction (RTi-PCR) assay was standardized for rapid, specific, and sensitive detection of A. flavus in stored peanuts. A. flavus was detected in 53.6% and 50% of peanut samples by RTi-PCR and A. flavus and Aspergillus parasiticus agar culture, respectively, with 95% agreement between them. Twenty-two A. flavus isolates were screened using high-performance liquid chromatography for their capacity to produce aflatoxin AFB1 (B1). B1 was produced by >72% of the isolates. Sixteen isolates produced B1 at concentrations ranging from 1.64 to 109.18 μg/mL. Four aflatoxin biosynthetic pathway genes (aflD, aflM, aflP, and aflQ) were evaluated using PCR and reverse-transcription PCR in 22 A. flavus isolates from peanut kernels with the aim of rapidly and accurately differentiating toxigenic and atoxigenic isolates. The PCR amplification of genes did not correlate with aflatoxin production capability. The expression of aflD and aflQ was a good marker for differentiating toxigenic from atoxigenic isolates.
Introduction
P
PCR-based methodologies have been applied to the detection of mycotoxigenic fungi in food (Somashesker et al., 2004; Manonmani et al., 2005). In particular, RTi-PCR has been used to detect specific genes and quantify A. flavus with good sensitivity and high specificity (Luo et al., 2009; Passone et al., 2010; Levin, 2012; Shweta et al., 2013). The biosynthesis of B1 involves 23 enzymatic reactions starting with acetyl-coenzyme A. A total of 15 intermediate precursors are recognized in the pathway (Meyers et al., 1998), involving 25 genes clustered in a 75-kb DNA region (Bhatnagar et al., 2006).
To date, two types of nucleic acids (DNA, RNA) have been used to distinguish toxigenic and atoxigenic A. flavus isolates based on the presence or absence of one or several AF biosynthesis genes. In previous studies, quadruplex and multiplex PCR systems have been developed to discriminate between AF-producing and non-AF-producing A. flavus isolates via detection of several genes of the AF biosynthesis pathway (Chen et al., 2002; Criseo et al., 2008). However, PCR detection of AF biosynthesis genes (presence/absence) is not always successful in distinguishing toxigenic from atoxigenic A. flavus isolates due to multiple mutations in the AF cluster genes within the targeted binding site of the primers (Levin, 2012).
Recently, several studies have tested the possibility of applying reverse transcription PCR (RT-PCR) to AF gene expression to monitor AF producers and nonproducers (Scherm et al., 2005; Degola, et al., 2007; Rodrigues et al., 2009). The expression of aflD has been proved to be useful in differentiating aflatoxigenic from nonaflatoxigenic strains of A. flavus (Scherm et al., 2005; Abdel-Hadi et al., 2011). Rodrigues et al. (2009) have tested the expression of aflD and aflQ and found good correlation between aflQ expression and AF production capability. Multiplex RT-PCRs for aflQ, aflO, aflD, and aflR have also demonstrated good correlation between AF gene expression and AF production (Degola et al., 2007). RT-PCR is sensitive because it detects gene expression (gene activity) rather than the presence or absence of genes (Sweeney et al., 2000).
The present study aims (1) to compare their A. flavus detection efficiency between classical cultural method and RTi-PCR; and (2) to correlate between aflD, aflM, aflP, and aflQ genes (PCR and RT-PCR) and the differentiation of A. flavus isolates (AF producers and non-AF producers) from stored peanut.
Materials and Methods
Collection of samples
Twenty-eight peanut samples (1000 g each) were collected from various markets in the Riyadh region of Saudi Arabia during September 2012. The samples were stored at 2°C until use.
DNA extraction
DNA isolation from the 28 peanut samples was carried out as described by Passone et al. (2010). The concentration and purity of the DNA were determined using a Gen Qunta system (Amersham Pharmacia Biotech, Sweden). The purity of the DNA for all samples was between 97% and 98%.
RTi-PCR assay
To facilitate rapid screening for the presence of A. flavus in stored peanut samples, two A. flavus-specific primers were used in one reaction mixture for RTi-PCR. RTi-PCR amplifications were performed with a thermal cycler (LightCycler 2.0; Roche Diagnostics GmbH, Germany) using primer FL1-F (5′-ATTCATGGCCGCCGGGGGCTCTCA-3′)/FL1-R (5′ GATTGATTTGCGTTCGGCAAGC-3′) according to Luo et al. (2009) with some modification. Amplifications were conducted in a 25-μL reaction mixture that included 10 μL of LightCycler-FastStart DNA master SYBR green I (Roche Diagnostics), 3 μL of template DNA, 1 μL each of FL1-F and FL1-R (10 pmol), and 4 mM MgCl2 made up to 25 μL with water. A. flavus DNA was used as a positive control in the PCR assay; negative controls were PCR reagents and 1 μL distilled water or nontarget DNA. After PCR, a melting curve of the product was generated by ramping the temperature to 95°C for 10 s, lowering it to 66°C for 60 s, and then increased it back to 95°C in increments of 4.4°C/s with continuous measurement of fluorescence.
Isolation of A. flavus
Twenty-eight stored peanut samples were examined for the detection of A. flavus using RTi-PCR. Isolation of A. flavus from the samples was carried out using standard techniques (Pitt and Hocking, 1997). Manually shelled peanuts were surface-disinfected in 5% sodium hypochlorite solution for 15 min, and then rinsed twice with sterile distilled water. Five grains from each peanut sample were randomly selected and transferred onto A. flavus and Aspergillus parasiticus agar (AFPA) in three petri dishes (9-cm diameter) using sterile forceps. Petri dishes were incubated at 30°C for 3 days according to Pitt and Hocking (1983). A. flavus KSU001, KSU002, KSU003, and KSU004 were used as reference isolates. Identification of A. flavus was based on morphological and microscopic characteristics and carried out at the Regional Center for Mycology and Biotechnology, Al-Azhar University, Cairo, Egypt.
Genomic DNA extraction of A. flavus isolates
The A. flavus spore suspension (106 spores/mL) of each isolate was inoculated into double-layer (one solid and one liquid) media in 50-mm petri dishes. The base solid medium was potato dextrose agar as a film, and the liquid top medium was peptone yeast glucose (1200 μL). A. flavus isolates were incubated at 25°C for 3 days. Mycelia were filtered through Whatman No. 1 filter paper and kept at −80°C for DNA isolation. A 0.5-g portion of the mycelium was ground into fine powder in liquid nitrogen. Approximately 100 mg of the mycelial powder was then used for extraction of genomic DNA. DNA extraction from the ground mycelia was accomplished with a DNeasy Plant Mini Kit (Qiagen, Germany) according to the manufacturer's instructions. The concentrations and purities of the fungal DNA were determined using the Gen Qunta system (Amersham Pharmacia Biotech). The purity of the DNA for all samples was between 97% and 98%, and the ratio was between 1.7 and 1.8.
Specific PCR amplification of A. flavus
PCR amplification was carried out according to a protocol described by González-Salgado et al. (2008). Specific PCR assays were performed using primers FLA1 (5′ GTAGGGTTCCTAGCGAGCC 3′) and FLA2 (5′ GGAAAAAGATTGATTTGCG TTC 3′) for A. flavus based on ITS1-5.8S-ITS2 regions. PCR was performed in a Techne TC-312 (Techne, United Kingdom). The PCR amplification protocol used for A. flavus was as follows: 1 cycle at 95°C for 5 min, 26 cycles of 30 s at 95°C, 30 s at 58°C, and 45 s at 72°C, and a final cycle at 72°C for 5 min. Amplification reactions were carried out in volumes of 25 μL containing 3 μL (10 pg–10 ng) of template DNA, 1.25 μL of each primer (20 μM), 2.5 μL of 10×PCR buffer, 1 μL of MgCl2 (50 mM), 0.25 μL of dNTPs (100 mM), and 0.2 μL of Taq DNA polymerase (5 U/μL; BioLabs, United Kingdom). PCR products were detected with 2% agarose ethidium bromide gels in TAE 1×buffer (40 mM Tris-acetate and 1.0 mM EDTA). A 100-bp DNA ladder (Intron Biotechnology, South Korea) was used as the molecular marker.
Determination of the toxigenic potential of A. flavus isolates
Isolates were grown in sterilized SMKY liquid medium (20 g sucrose, 0.5 g magnesium sulphate, 3 g potassium nitrate, and 7 g yeast extract in 1000 mL distilled water) (Davis et al., 1987). Flasks were inoculated with discs (6-mm diameter) of A. flavus isolates at 25±2°C for 7 days. The experiments were performed in triplicate. After incubation, the contents of each flask were filtered through Whatman No. 1 filter paper. For AF extraction, the filtrates from each flask were treated 3 times with 50 mL of chloroform under a separating funnel. The chloroform extracts were then separated and dehydrated with anhydrous sodium sulphate and evaporated to dryness in a water bath at 50°C under vacuum. The residues were dissolved in 10 mL of methanol and stored in brown vials, and the extracts were passed through a 0.45-μm microfilter (Paranagama et al., 2003). Analysis of the compounds present in the specimens was performed using a high-performance liquid chromatography (HPLC) apparatus (Perkin Elmer series 200, US) using a C18 column with an internal diameter of 300 mm×3.9 mm and a particle size of 4 μm. The HPLC instrument was equipped with an ultraviolet detector, and fluorescence was measured using 365-nm excitation and 430 emission wavelengths. The mobile phase consisted of methanol:acetic acid:water (20:20:60 vol/vol/vol). The total run time for the separation was ≈25 min at a flow rate of 1 mL/min (Christian, 1990).
PCR assay for five AF biosynthesis genes
DNA extraction was carried out using the method described in an earlier section (Genomic DNA extraction of A. flavus isolates). PCR parameters followed those reported by Rodrigues et al. (2009). PCR amplifications were performed in 25-μL volumes of reaction mixture containing 2.5 μL of 10×reaction buffer, 20 mM MgCl2, 1.25 U of Taq polymerase (BioLabs), 0.2 μM of each primer (see Table 1 for a list of primers), and 10 ng/μL of template DNA. The DNA and PCR mixtures were amplified in the Techne TC-312 (Techne). PCR was carried out as follows: 1 step at 94°C for 3 min; 30 cycles of 1 min at 94°C, 1 min at 55°C, and 1 min 72°C; and a final step at 72°C for 5 min. Genes aflD, aflM, aflP, and aflQ were tested in all isolates using the primer pairs listed in Table 1. The housekeeping gene tub1 encoding β-tubulin was used as internal amplification control.
Total RNA extraction
Twenty-two isolates of A. flavus were grown under the same condition as mentioned above. Total RNA was extracted with an RNeasy Plant Mini Kit (Qiagen), including a step of genomic DNA digestion with an RNase-free DNase set (Qiagen) according to the manufacturer's instructions. Fungal RNA was stored at −80°C. The concentration and purity of the fungal RNA were determined using the Gen Qunta system (Amersham Pharmacia Biotech). The purity of the RNA for all samples was between 98% and 99%, and the ratio was between 1.6 and 1.7.
RT-PCR
RT-PCR was performed in a 20-μL volume of reaction mixture containing 8 μL of One-Step RT-PCR Pre-Mix kit (Intron Biotechnology), 0.2 μM of each primer (Table 1), and 1 μg of template RNA. Reverse transcription was carried out at 45°C for 30 min. PCR parameters followed those reported by Rodrigues et al. (2009): 4 min at 94°C; 60 s at 94°C, 1 min at 60°C, and 1 min at 72°C for 5 cycles; 1 min at 94°C, 1 min at 55°C, and 1 min at 72°C for 30 cycles; and a final extension at 72°C for 6 min.
Results
Detection of A. flavus in peanut samples
Twenty-eight peanut samples were examined for the presence of A. flavus using RTi-PCR and AFPA medium (Table 2), and these methods detected A. flavus in 53.6% and 50% of the samples, respectively. There was 95% agreement between the two methods used. The melting curve analysis showed a single peak with a melting point of 87°C (Fig. 1). Those RTi-PCR results demonstrated the usefulness of rapid detection in agricultural crop monitoring due to its capability of detecting A. flavus contamination within a few hours.

Real-time polymerase chain reaction (RTi-PCR) melting curve analysis of Aspergillus flavus isolates. The melting temperature (Tm) for the A. flavus PCR fragment is 87°C.
Specific PCR for A. flavus
The identity of 22 A. flavus isolates (A. flavus KSU101-122) was confirmed based on partial sequences of the ITS1-5.8S-ITS2 regions (Fig. 2). All the A. flavus isolates were tested for amplification using the primer pair FLA1 and FLA2. A single fragment of ≈500 bp was amplified only when genomic DNA from A. flavus isolates was used; amplification did not occur with genomic DNA from other aspergilli species.
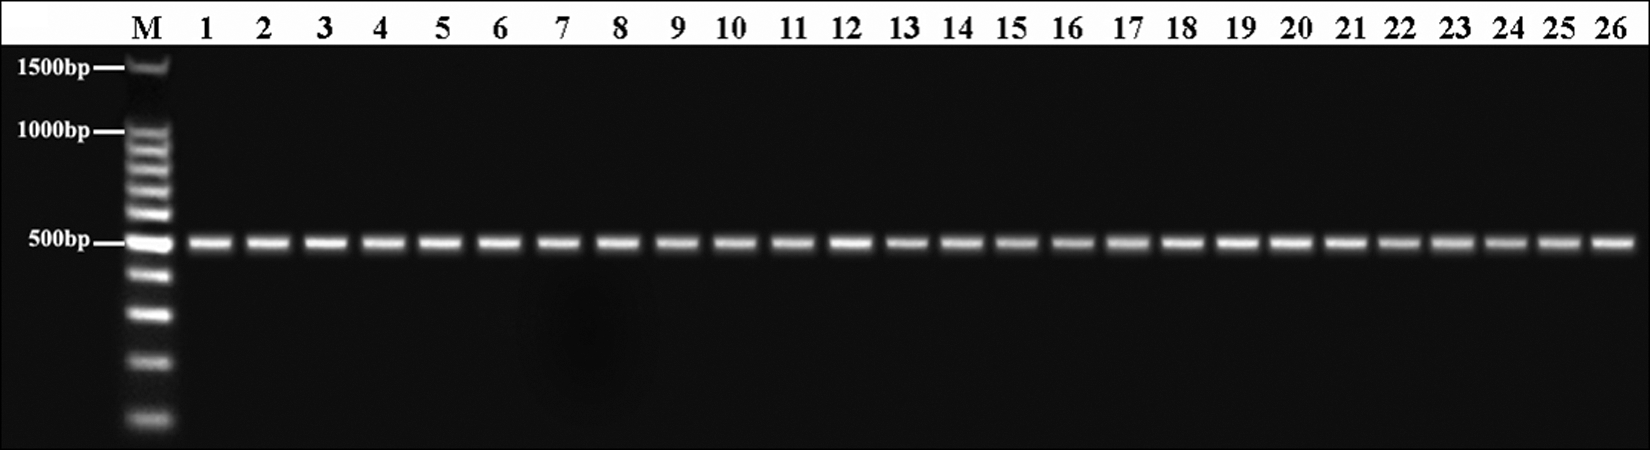
Polymerase chain reaction (PCR) amplification of 26 genomic DNA Aspergillus flavus isolates using primers FLA1/FLA2. M: DNA molecular size marker, lane 1: A. flavus KSU101, lane 2: KSU102, lane 3: KSU103, lane 4: KSU104, lane 5: KSU105, lane 6: KSU106, lane 7: KSU107, lane 8: KSU108, lane 9: KSU109, lane 10: KSU110, lane 11: KSU111, lane 12: KSU112, lane 13: KSU113, lane 14: KSU114, lane 15: KSU115, lane 16: KSU116, lane 17: KSU117, lane 18: KSU118, lane 19: KSU119, lane 20: KSU120, lane 21: KSU121, lane 22: KSU122, lane 23: KSU001, lane 24: KSU002, lane 25: KSU003, lane 26: KSU004.
AF production
Sixteen isolates were capable of producing detectable levels of AFB1, whereas six isolates failed to produce detectable amounts of the toxin (Table 3). The highest level of B1 (109.18 μg/mL) was obtained from isolate A. flavus KSU107. Isolate A. flavus KSU116 showed the lowest B1 production (1.64 μg/mL). Three isolates were very high producers (61.75–109.182 μg/mL), six isolates were high producers (20.47–39.55 μg/mL), and seven isolates were low producers (1.64–15.13 μg/mL).
HPLC, high-performance liquid chromatography; AFB1, aflatoxin B1.
Molecular characterization with PCR and RT-PCR
The results of the PCR and RT-PCR analyses are shown in (Table 3). The PCR results identified four genes (aflD, aflM, aflP, and aflQ) in all isolates, both toxigenic and atoxigenic, and showed a nondiverse pattern (Table 3 and Fig. 3). The PCR results of the present study showed that both toxigenic and atoxigenic A. flavus isolates harbored all the examined genes (aflD, aflM, aflP, and aflQ). The presence of these genes had a consistent pattern in the isolates, suggesting no differences in molecular diversity of the isolates. Consequently, such a method would not be considered useful for differentiating between toxigenic and atoxigenic isolates.
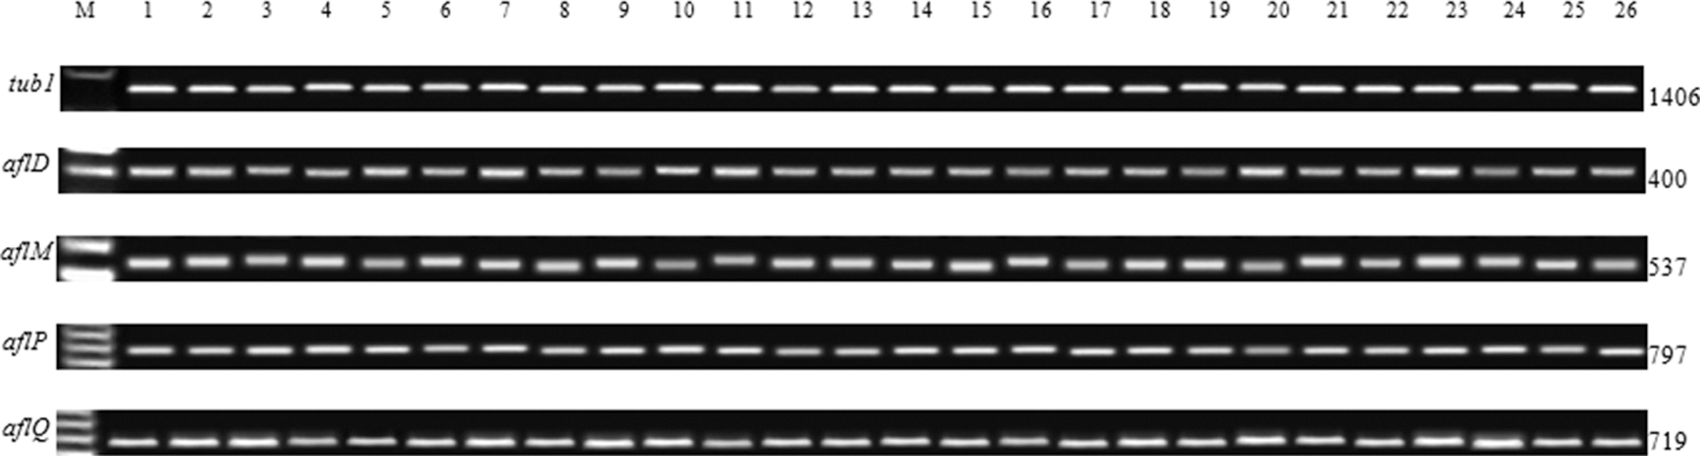
Polymerase chain reaction amplification of 26 genomic DNA A. flavus isolates using specific primers of four genes of AF biosynthesis, including aflD, aflM, aflP and aflQ. M: DNA molecular size marker, lane 1: A. flavus KSU101, lane 2: KSU102, lane 3: KSU103, lane 4: KSU104, lane 5: KSU105, lane 6: KSU106, lane 7: KSU107, lane 8: KSU108, lane 9: KSU109, lane 10: KSU110, lane 11: KSU111, lane 12: KSU112, lane 13: KSU113, lane 14: KSU114, lane 15: KSU115, lane 16: KSU116, lane 17: KSU117, lane 18: KSU118, lane 19: KSU119, lane 20: KSU120, lane 21: KSU121, lane 22: KSU122, lane 23: KSU001, lane 24: KSU002, lane 25: KSU003, lane 26: KSU004
Gene expression was analyzed in A. flavus isolates in relation to their capacity of producing B1 (Table 3 and Fig. 4). AflD expression was positive in 16 toxigenic isolates (94%), and aflQ expression was positive in all toxigenic isolates (100%). AflM and aflP expression was positive in 37.5% and 25% of isolates, respectively. Fifteen toxigenic isolates (KSU101, 102, 103, 104, 106, 107, 108, 109, 110, 113, 114, 117, 119, 120, and 122) displayed a pattern of two bands corresponding to the expression of aflD and aflQ. Five atoxigenic isolates (KSU105, 111, 1112, 115, and 121) showed no signal for aflD and aflQ expression. The compatibility between aflD and aflQ expression was >90% in toxigenic and atoxigenic A. flavus isolates.
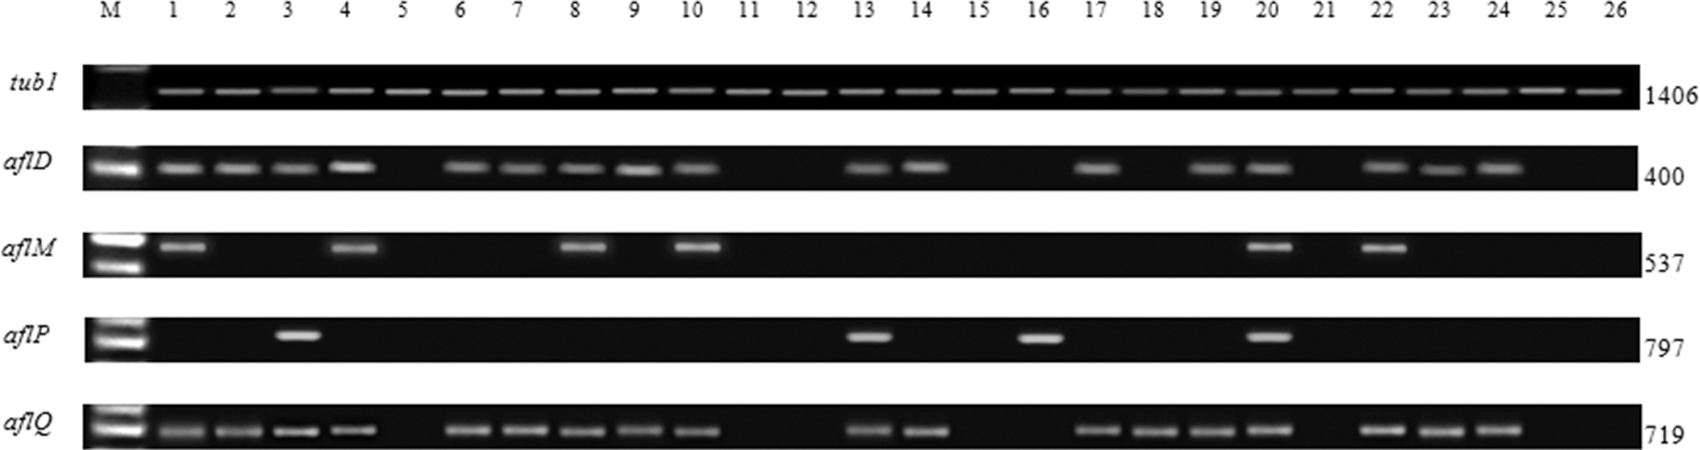
Reverse transcription polymerase chain reaction amplification of 26 genomic DNA A. flavus isolates using specific primers of four genes of AF biosynthesis, including aflD, aflM, aflP and aflQ. M: DNA molecular size marker, lane 1: A. flavus KSU101, lane 2: KSU102, lane 3: KSU103, lane 4: KSU104, lane 5: KSU105, lane 6: KSU106, lane 7: KSU107, lane 8: KSU108, lane 9: KSU109, lane 10: KSU110, lane 11: KSU111, lane 12: KSU112, lane 13: KSU113, lane 14: KSU114, lane 15: KSU115, lane 16: KSU116, lane 17: KSU117, lane 18: KSU118, lane 19: KSU119, lane 20: KSU120, lane 21: KSU121, lane 22: KSU122, lane 23: KSU001, lane 24: KSU002, lane 25: KSU003, lane 26: KSU004.
Only one toxigenic isolate KSU120 showed positive expression signal for aflM and aflP genes. Seven toxigenic isolates (KSU102, 106, 107, 109, 117, 119, and 122) failed to generate a positive single for aflM and aflP expression genes. Six atoxigenic isolates (KSU105, 111, 112, 115, 118, and 121) showed no signal for aflM and aflP expression genes. The compatibility between aflM and aflP expression was 32% for positive correlation between aflatoxigenicity and gene expression.
Discussion
RTi-PCR assays have been used to detect mycotoxigenic fungi such as Aspergillus (Shweta et al., 2013), Fusarium (Nicolaisen et al., 2009), and Penicillium (Rodrígues et al., 2011) in food products. In the present study, RTi-PCR was proved more sensitive than culture. Culture detection is time consuming and labor intensive, and the selection of media introduces bias in terms of which species may grow. RTi-PCR assay has been standardized for rapid, specific, and sensitive detection of A. flavus in various crops using sensitive and specific primers. Such PCR-based assays may be highly useful in the food and feed industries as well as in quarantine laboratories (Shweta et al., 2013). Compared with those culture-based methods, PCR is faster, more sensitive, and more specific and enables detection of subdominant populations, even in the absence of a selective enrichment medium and in the presence of other (dominant) populations. Moreover, it allows detection of dead cells or viable but noncultivable cells (Postollec et al., 2011).
Several authors have applied HPLC methods for low-ppb detection of AFs (B1, B2, G1, and G2) and AF residues (Yassin et al., 2010; Al-Wadai et al., 2013; Mahmoud et al., 2014). HPLC detection of AFs is sensitive and accurate (Pascale, 2009). A total of 88 Aspergillus section Flavi isolates isolated from peanut seeds were tested by HPLC for quantification of the ability to produce AFs (B1, B2, G1, G2). Eighty-three Aspergillus section Flavi isolates gave positive results. The concentrations of AFB1 produced ranged from 10 to 100,000 ng/g (Sultan and Magan, 2010). A total of 18 strains of Aspergillus section Flavi isolated from Egyptian peanuts were assessed for AF production during growth on YES medium using HPLC. These strains tested to produce aflatoxin B1 (AFB1) and aflatoxin B2 (AFB2). The AFB1 was in the range 1.27–213.35 μg/g. Five of the strains showed no detectable levels of AF (Abdel-Hadi et al., 2011).
PCR results of the present study agree with some previous studies (Bhatnagar et al., 2006; Rodrigues et al., 2009; Abdel-Hadi et al., 2011; Abd-El-Aziz et al., 2014).
Molecular techniques have been widely applied also in the attempt to distinguish aflatoxinogenic and nonaflatoxigenic strains of A. flavus and A. parasiticus, through the correlation of presence/absence of one or several genes involved in the AF biosynthetic pathway with the ability/inability to produce AFs. Some groups have been able to distinguish these species from other foodborne fungi (Geisen, 1996; Shapira et al., 1996). More recently, several studies have monitored the expression of regulatory and structural AFs genes in A. parasiticus and/or A. flavus using the RT-PCR to distinguish between AF producers and nonproducers. However, there is currently no agreement on single genes whose expression can be used to fully discriminate between AF and non-AF producers (Scherm et al., 2005; Degola et al., 2007; Rodrigues et al., 2009; Abdel-Hadi et al., 2011). The expression of nine structural and two regulatory AF biosynthesis genes using RT-PCR has shown that aflD expression gives the best correlation with aflatoxigenicity and that aflQ expression is inconsistent in A. flavus isolates (Scherm et al., 2005). Multiplex RT-PCR for the expression of aflP, aflO, and aflQ and two regulatory genes, aflR and aflS, in A. flavus strains also shows good correlation between the expression of these genes and AF production (Chen et al., 2002). In another study, aflP, aflQ, aflS, and aflD expression can be used to differentiate AF-producing and non-AF-producing Aspergillus strains (Degola et al., 2009). Good correlation between aflQ expression and AF production in A. flavus and A. parasiticus strains was obtained from Portuguese almonds (Rodrigues et al., 2009). The expression of four AF biosynthetic pathway genes (aflD, aflO, aflP, and aflQ) was evaluated in 24 A. flavus strains isolated from soils of a pistachio orchard. RT-PCR results showed that transcription of these genes has not always been correlated with AF production. However, the expression patterns of aflO and aflQ have been found to be well correlated with the amounts of AFB1 produced (Jamali et al., 2013). The RTi-PCR assay used in this study may be highly useful for rapid and accurate detection of A. flavus in foods and feeds and would be of considerable value in seed testing and plant quarantine laboratories. The RT-PCR results of the present study showed that aflD and aflQ transcription is a good marker for discriminating between toxigenic and atoxigenic A. flavus isolates, whereas aflM and aflP failed to differentiate AF and non-AF-producing isolates.
Footnotes
Disclosure Statement
No competing financial interests exist.