
Abstract
The persistence of certain Listeria monocytogenes strains in food-related environments suggests niche adaptation of these strains and therefore constitutes a major risk to consumer health and results in economic losses for the food producer. In this study, a set of 23 L. monocytogenes isolates, including a group of persistent and a group of sporadic strains, was evaluated regarding their swarming motility at 11°C. In each group, significant (p<0.05) differences in motility were observed. The transcript levels of nine cold stress–related genes were analyzed by real-time quantitative PCR in two representatives of persistent (CBISA3077) and sporadic (CBISA3049) strains isolated from the dairy environment, and significant (p<0.05) differences between the two strains were observed. The persistent strain showed significantly higher transcript levels of dtpT and sigB genes, and significantly lower levels of flaA, oppA, lmo1722, and lmo0866 genes. In the persistent strain, the upregulation of sigB, involved in the tolerance to low temperature and to osmotic stress, could account for the persistence of this strain in its original dairy environment. In a similar way, the downregulation of two helicase-encoding genes lmo1722 and lmo0866, in this strain, may be an evolutionary trait that could facilitate cold stress adaptation. Even though this analysis should be extended to more sporadic and more persistent strains, the results presented here strongly suggest gene expression networks differently adjusted, in the two strains, to the low-temperature environment from where they were collected. Moreover, our findings suggest that bacterial motility per se should not be considered a key feature for the persistence of L. monocytogenes in the food environment.
Introduction
T
The alternative sigma factor σB, encoded by sigB, has been identified as contributing to the general stress response in L.monocytogenes, regulating the expression of motility and transport genes when the pathogen is exposed to low temperatures (Raengpradub et al., 2008). Another alternative sigma factor, σL, encoded by sigL, also plays a key role in resistance to low temperature (Mattila et al., 2012). In this condition, single-stranded RNA molecules form stable secondary structures that undergo unwinding by several RNA helicases (Iost et al., 2013). Previous studies demonstrated the induction of genes encoding three DEAD-box RNA helicases (lmo1722, lmo1450, and lmo0866) by temperature reduction in L. monocytogenes. These helicases proved to be required for bacterial growth and motility under such conditions (Azizoglu and Kathariou, 2010; Markkula et al., 2012).
Flagellin (FlaA), encoded by flaA, is the main protein of the bacterial flagella. The importance of the flagellum as a persistence enhancer in some strains of this species remains a controversial subject. Although several authors claimed that flagella present a function in the biofilm formation in L. monocytogenes (Chang et al., 2012; Ouyang et al., 2012), other studies showed that, in some strains, the absence of flagella, or of flagellar motility, improves biofilm formation (Todhanakasem and Young, 2008).
When L. monocytogenes is exposed to low temperatures, oligopeptides longer than three residues can be transported by oligopeptide permease A (OppA) into bacterial cells, accumulating to high concentrations (Verheul et al., 1998; Borezee et al., 2000). The transport of di- and tripeptides is performed by a proton motive force-dependent system coded by gene dtpT (Verheul et al., 1995; Wouters et al., 2005).
Another important protein for low-temperature adaptation in L. monocytogenes is a single ferritin-like protein encoded by fri (Glaser et al., 2001), also called major cold shock protein, that provides protection against reactive oxygen species and other stresses (Dussurget et al., 2005).
To our knowledge, with few exceptions (Durack et al., 2013), most of the transcriptional studies on L. monocytogenes, albeit important for understanding the molecular mechanisms of cold adaptation, have used single strains. The main goal of the work presented here was the comparison of the expression of nine cold stress–related genes (flaA, oppA, dtpT, fri, sigB, sigL, lmo1722, lmo1450, and lmo0866) between one persistent and one sporadic strain of L. monocytogenes, both collected from the dairy environment.
Materials and Methods
Bacterial strains
The 23 L. monocytogenes isolates used for swarming motility analysis represent three of the four genetic lineages of the species, I, II, and III (Wiedmann et al., 1997), and comprises 2 main groups of strains (Table 1): persistent (Rørvik et al., 2000, 2003; Leite et al., 2006; Fox et al., 2011) and sporadic (Leite et al., 2006; Neves et al., 2008). These strains were from different geographic origins, isolated from diverse foods, and included clinical isolates (Cabrita et al., 2004; Neves et al., 2008; Cabrita et al., 2010). One sporadic strain (CBISA3049) and one persistent strain (CBISA 3077) were selected for transcriptomic analysis. These strains, even though being isolated from the dairy environment, showed no significant differences in motility and presented major differences in the exoproteomes at 11°C (Cabrita et al., 2013). Cultures were kept on tryptone soy broth (Difco, Detroit, MI) supplemented with 15% (vol/vol) glycerol, and stored at −80°C, until use.
Bold and underlined indicates the strains studied in real-time quantitative polymerase chain reaction.
Persistent strains.
CBISA, Colecção de Bactérias do Instituto Superior de Agronomia; CIP, Colection de l'Institut Pasteur; ATCC, American Type Culture Collection; INRA, Institut National de la Recherche Agronomique; Nd, not determined.
Motility assays
Swarming on semisoft agar was evaluated for all the isolates listed in Table 1. After growth in tryptone soy agar–yeast extract (TSA-YE) (Biokar Diagnostic, Beauvais, France) at 37°C, during 24 h, 1 individual colony of each isolate was used to needle inoculate 0.4% (wt/vol) minimal medium (Modified Welshimer Broth [MWB]) (Premaratne et al., 1991) plates. Incubation was for 23 days at 11°C. Images of the incubated plates were captured and recorded using a digital camera (FE-4000; Olympus Imaging Corp., Tokyo, Japan) and the area of the swarming halo around the point of inoculation was measured using the image analysis program ImageJ 1.42I (Wayne Rasband National Institutes of Health, Bethesda, MD) (Schneider et al., 2012). Results were reported as the mean of the swarming area observed in four independent experiments.
RNA isolation
Bacterial cells were obtained following the method described by Cabrita et al. (2010) with modifications. Strains were cultured overnight at 37°C on TSA-YE. Single isolated colonies were suspended in 25 mL of MWB and incubated at 11°C, at 120 rpm, until exponential phase (about 6 days). Cultures were adjusted with fresh MWB to an A600=0.05. Incubation proceeded at 11°C with shaking until an A600 of 0.5 was reached (1×10⁹ to 2×10⁹ colony-forming units/mL). Total RNA was then extracted, according to Werbrouck et al. (2006), using the RNAprotect Bacteria Reagent (RpBR) and RNeasy Mini kit (Qiagen GmbH, Hilden, Germany) as described by the manufacturer with small modifications: 1 mL of the culture was harvested, mixed with 2 mL of RpBR and centrifuged (5000×g, 10 min). The bacterial pellet was resuspended in 200 μL of Tris-EDTA buffer containing 15 mg/mL lysozyme (Sigma-Aldrich, St. Louis, MO) and 10 μL proteinase K (>600 mAU mL−1) (Qiagen GmbH) and incubated for 10 min at 37°C for cell lysis. To remove DNA, a DNase I treatment according to the extraction kit instructions, using RNase-free DNase set (Qiagen GmbH), was performed. Total RNA was eluted in 50 μL of RNase free water and stored at −80°C until use. Total nucleic acid concentration was determined by ultraviolet spectrophotometry at 260 nm and the purity was determined by the A
cDNA synthesis
The reverse transcriptase (RT) reaction was performed, according to SuperScript III RT (Invitrogen, Carlsbad, CA) manufacturer instructions, in a total volume of 20 μL containing 100 ng of RNA template, 1×First-Strand buffer, 5 mM dithiothreitol, 0.5 mM dNTP (Promega, Madison, WI), 2.5 μM random hexamers (Invitrogen), 40U RNase OUT (Invitrogen), and 200 U SuperScript III RT. To check the presence of residual DNA, each RNA sample was also subjected to a cDNA synthesis reaction without addition of SuperScript III RT enzyme (NoRT). The reaction mixtures were successively incubated for 5 min at 25°C, 60 min at 50°C, 15 min at 70°C, and 5 min at 5°C. Solutions with cDNA were stored at −80°C until use.
Real-time quantitative PCR
The gene expression of flaA, oppA, dtpT, fri, sigB, sigL, lmo1722, lmo0866, and lmo1450 was studied using real-time quantitative PCR (qPCR), which was carried out with the iCycler iQ5 real-time PCR detection system (Bio-Rad, Hercules, CA) using iQ5 version 2.0 software (Bio-Rad). Optimization of qPCR is essential for accurate quantification. With the exception of primer flaA-fw from Knudsen et al. (2004) (Table 2), all the remaining primers were designed as follows: based on conserved regions of DNA sequences of 27 available L. monocytogenes genomes, downloaded from the GenBank/EMBL/DDBJ/PDB database, and using the BLAST program from NCBI browser (
RTPrimerDB (
From Knudsen et al. (2004).
Primers for reference gene (RF) ldh.
Real-time quantitative PCR was performed in a 20-μL reaction volume containing 0.5 ng cDNA template (1 μL of the 1:10 dilution of the original cDNA), 0.25 μM of each primer, and 1×iQ™ SYBR Green Supermix (Bio-Rad). The real-time PCR run protocol consisted of the following cycle profile: (1) 1 cycle at 95°C for 10 min; (2) 40 cycles at 95°C for 15 s, 60°C for 1 min, and 72°C for 30 s; (3) 1 cycle at 72°C for 5 min. After each PCR cycle, a melting curve analysis was performed between 65°C and 95°C to verify the specificity of the amplification product. To evaluate the residual DNA, the NoRT cDNA reaction was examined. When ΔCq between the sample and its respective NoRT was >5, the DNA contamination level was ignored. For each gene, a threshold was determined in the exponential growth region of the amplification curve. Cq was defined as the PCR cycle number at which the amplification curve intercepts the threshold line. A relative standard curve of four serial dilution points of stock cDNA was used to quantify the Cq values.
Analysis of the relative expression levels of the genes
To analyze the stability of the four tested reference genes (RFs), rpoD, tufA, gyrA, and ldh, the software program geNorm 3.5 (Biogazelle, Gent, Belgium) was used (Vandesompele et al., 2002). In a first step, this software estimates the gene-stability measure M (which must be <1.5) for each RF. The lowest M value reflects the gene with the most stable expression level. Secondly, for the used RFs this software calculates a normalization factor, which was applied in the treatment of the data.
Concerning the genes under analysis (Table 2), relative expression levels were normalized to the relative quantities of the RF ldh by using geNorm. For the four RFs tested in this study, the stability measure M was 0.679 for rpoD, 0.322 for tufA, and 0.294 for gyrA and ldh. The low M values and the minor differences between these values indicated that each of these RFs is constitutively expressed with the necessary stability under the experimental conditions tested. Therefore, each of the four tested RFs is suitable as internal control. To reduce the qPCR assay number, the gene expression was normalized only to ldh. In addition to its lowest M value, ldh presented higher linearity on PCR amplification (R 2=0.9986) than gyrA (R2=0.9884), and the normalization factor does not significantly change with the inclusion of gyrA.
Optimization of qPCR
The amplification specificity of the primer sets was confirmed by ensuring single product bands with the desired length in agarose gels (Table 2), and single peaks in melting curve analysis. No primer-dimers were generated during the qPCR run protocol. The qPCR assays were repeated three times under identical conditions, and the PCR efficiencies (E) for all genes were estimated (Table 2) by determining the slope of the standard curve according to the equation E={[10(-1/slope)]/2}×100, which was adapted from Pfaffl (2001). All PCR efficiencies were >95% in the range from 0.5 pg to 0.5 ng of cDNA, input (n=3) presenting high linearity, with correlation coefficient R 2>0.99 (data not shown). The presence of chromosomal DNA was checked by performing NoRT for each gene and for each sample. The DNA contamination level was considered negligible for all samples.
Statistical analysis
Concerning the analysis of the swarming motility data, the assumptions for the standard analysis of variance (ANOVA) (normal distribution and homogeneity of variance of the data) were confirmed, and the significant differences between the area of the swarming halos were determined using one-way ANOVA with Tukey's HSD multiple-comparison test (α=0.05).
For the qPCR data, as the assumptions for the standard ANOVA were not met, the results were analyzed with the nonparametric Mann–Whitney U test (α=0.05).
Comparison of the expression of different genes, and comparison between gene expression and motility, were obtained through the calculation of the nonparametric Spearman rank correlation coefficients (ρ) between relative mRNA expression and motility. For those comparisons, the two selected strains were tested, with three biological replicates and two technical repeats. The significance level was set at p<0.05.
All statistical analyses were performed by running the program Statistica for Windows, version 7 (StatSoft, Inc., Tulsa, OK).
Primer nucleotide sequences accession numbers
Primer sequences were submitted to the RTPrimerDB (
Results
Motility analysis
Growth curves in MWB at 11°C of the 23 L. monocytogenes isolates tested for motility were compared and did not show significant differences (data not shown).
Analysis of the motility of the L. monocytogenes strains in MWB agar at 11°C showed significant differences (Fig. 1). These differences existed both within the persistent and the sporadic group of strains. Moreover, some persistent and sporadic strains showed no significant differences between them. Among the persistent strains, some were significantly less motile and others were significantly more motile than the rest of the strains. For example, the persistent strain CBISA3072 was included in the group of strains with the highest motility, and the persistent strain CBISA4347 in the group of the lowest motility (Fig. 1). The clinical strain CBISA3847 (Fig. 1 and Table 1) exhibited significantly more motility than all the other strains tested. However, within the group presenting the lowest motility, other clinical strains were included, such as 3849, 3851, and 3850 (Table 1 and Fig. 1).

Swarming motility on semisoft agar of the 23 Listeria monocytogenes isolates listed in Table 1, after growth at 11°C for 23 days. Average values of swarming areas±SD (error bars). The lines over the bars indicate strains with no significant differences among average values (α >0.05). Bar pattern codes: Persistent isolates;  sporadic isolates; *Strains selected for real-time quantitative polymerase chain reaction analysis.
Relative transcript levels of the nine genes and their correlations
The relative expression levels of the genes flaA, oppA, lmo1722, and lmo0866 were significantly higher (p<0.05) in the sporadic strain CBISA3049 than in the persistent strain CBISA3077, whereas the relative expression levels of genes dtpT and sigB were significantly lower (p<0.05) in strain CBISA3049 than in strain CBISA3077. No significant differences (p>0.05) between the two strains were observed for the expression levels of fri, sigL, and lmo1450 (Fig. 2).

Relative expression levels (transcript levels) of 9 genes, in 2 strains of Listeria monocytogenes (CBISA3049 and CBISA3077) at late exponential phase of growth at 11°C. Average values of relative gene expression levels±SD (error bars), from three independent experiments, normalized against the expression level of the housekeeping gene ldh. Asterisks over bars indicate significant differences between the two strains at p<0.05. Bar pattern codes: Persistent isolate CBISA3077;  Sporadic isolate CBISA3049.
In both strains, the flaA expression level was strongly negatively correlated with sigB expression level (ρ=−0.91, p<0.05, and ρ=−0.84, p<0.05, respectively) (Fig. 3). This was the only significant correlation with a similar effect in both strains. Despite this result, the values for flaA expression in the two strains were significantly different (Fig. 2), even though there was no significant difference in the motilities of these two strains (Fig. 1). On the other hand, sigB showed significantly higher transcript level in the persistent strain than in the sporadic strain (Fig. 2). When gene expression of the nine genes was compared with bacterial motility, no significant correlations were found (data not shown).
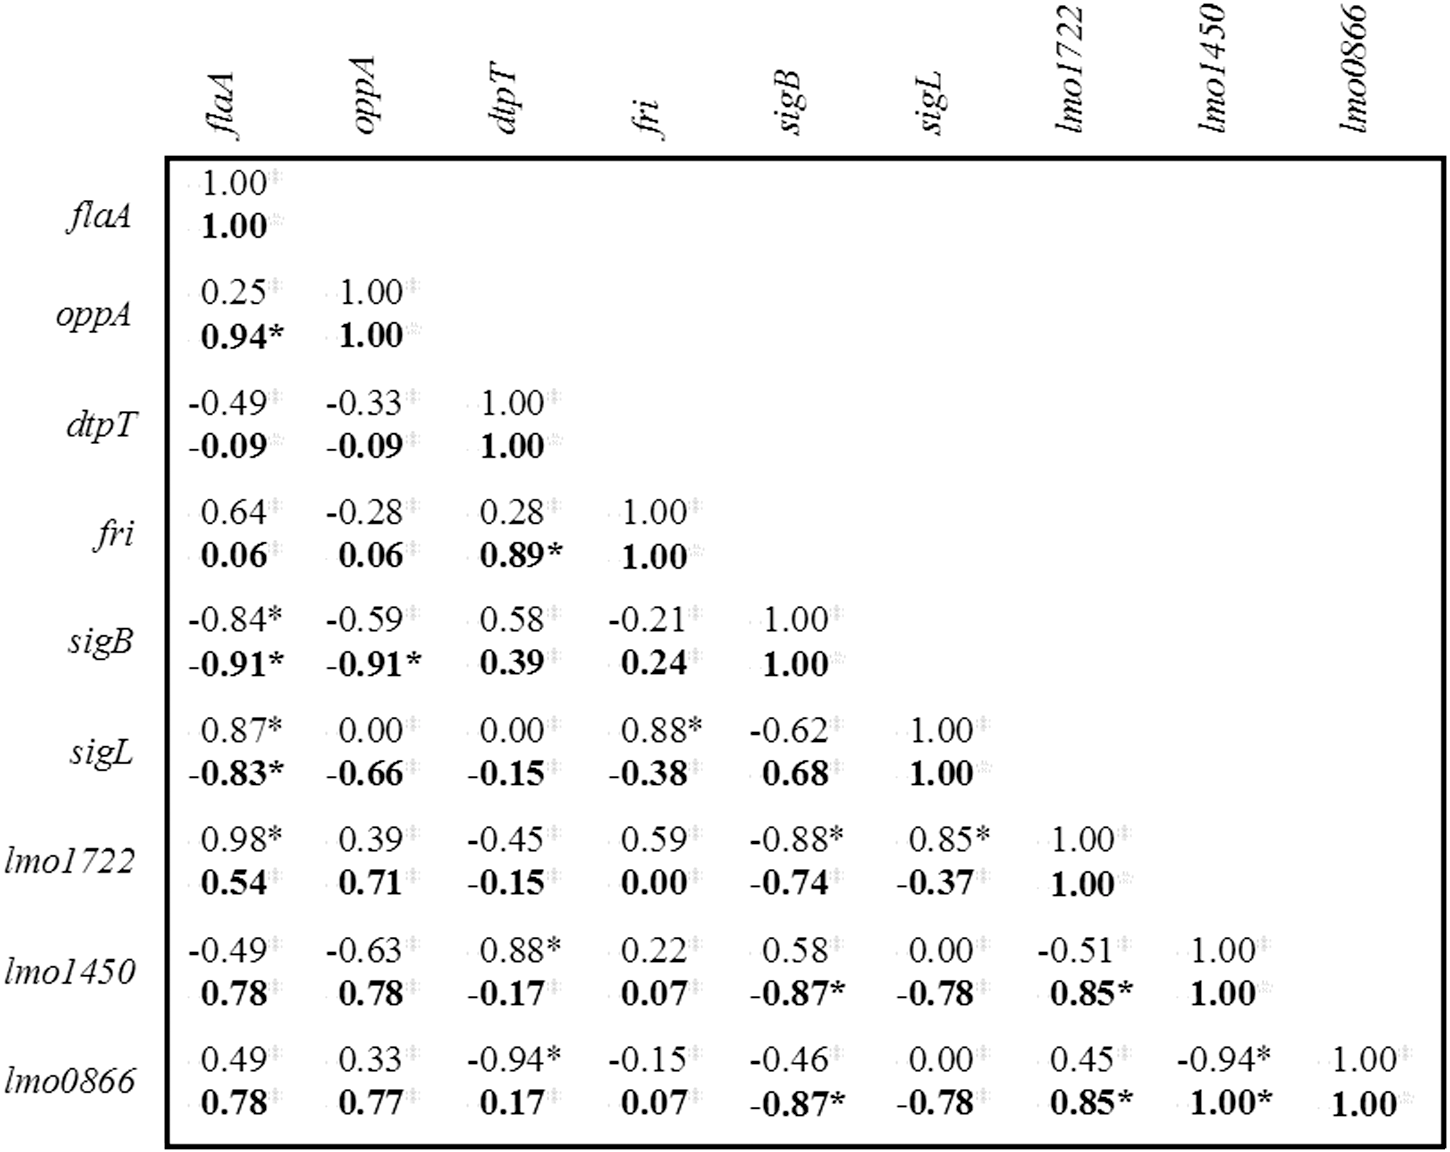
Correlation matrix of mRNA expression levels between the analyzed genes, for each strain: bold type—values for the persistent strain CBISA3077; normal type—values for the sporadic strain CBISA3049. Values represent pairwise Spearman rank correlation coefficients (ρ) between two genes: The strength of the correlations was defined as follows: (a) strong, |ρ|≥0.7; (b) moderate, |ρ|≥0.5; (c) weak, |ρ|≥0.3; and (d) no appreciable correlation, |ρ|≤0.3. *Significance levels of values (p<0.05).
For the other seven genes (oppA, dtpT, fri, sigL, lmo1722, lmo1450, and lmo0866), the correlations observed in one of the strains differed from the respective correlations in the other strain (Fig. 3). For instance, the sigB expression level of strain CBISA3049 did not show significant correlation with oppA expression levels. However, in the persistent strain, sigB was strongly negatively correlated with oppA (ρ=−0.91, p<0.05) (Fig. 3). Also, in the persistent strain, dtpT transcript level was positively correlated (p<0.05) with fri transcript level but not in the sporadic strain (Fig. 3). Nevertheless, fri transcript levels did not show significant differences between the two strains (Fig. 2).
Discussion
Swarming motility varies widely among L. monocytogenes persistent strains
The large diversity of swarming motility values observed among strains is an example of the variety of responses to the same stimulus within the species. This high degree of variability, particularly noticeable among the group of persistent strains, may be a result of adaptive changes in each of these strains over time, for different ecological niches. In view of the fact that, in the conditions of the assay, persistent strains can present low or high motility, this feature per se does not seem to be critical for strain persistence, at low-temperature environments.
Downregulation of two RNA helicases in the persistent strain
The downregulation of the two RNA helicases genes lmo1722 and lmo0866 observed in the persistent strain may reflect not only an adaptive evolution in response to low temperature, but probably also to the osmotic conditions present in the dairy environment from which this strain was persistently collected for more than a year (Leite et al., 2006). To our knowledge, no clear relation between sigB expression and RNA helicases expression has been demonstrated yet.
Correlation between low temperature–related genes differs between the persistent and the sporadic strain
Despite that the analysis of swarming areas on semisoft agar showed no significant differences between the two strains, the flaA relative expression in the persistent strain was significantly lower than in the sporadic strain, suggesting transcriptional regulation of this gene. In fact, the persistent strain was found to be poorly flagellated compared with the sporadic strain (Cabrita et al., 2013). Raengpradub and colleagues (2008) found that, at 37°C, the transcript levels of several L.monocytogenes flagellar genes (fliK, flgD, fliN, flgK, flgL, flgB, flgC, fliE, fliF, fliG, fliH, and lmo1699) were negatively regulated by σB. The same occurred in the present study for both strains, at 11°C, with flaA, suggesting that at both temperatures, sigB exerts a negative regulation on genes involved in motility. Netterling and collaborators (2012) showed that L. monocytogenes flaA is positively regulated by lmo1722, and the results obtained from strain CBISA3049 seems to support these findings. Nevertheless, the molecular mechanism involved remains to be clarified.
The present results corroborate previous works (Cabrita et al., 2010, 2013) that did not detect OppA in 11°C and 20°C culture supernatants of the persistent strain. Raimann and colleagues (2009) showed that during growth of this pathogen under low-temperature conditions, oppA seems to be positively regulated by sigL. However, our results concerning sigL expression suggest that the difference found in oppA transcript levels between the two strains derives from some regulatory mechanism other than sigL. Moreover, Chan and collaborators (2007) observed that transcription of oppA is σB independent during growth at 4°C, which is agreement with our results obtained with strain CBISA3049 at 11°C. However, in the persistent strain, sigB expression was strongly negatively correlated with oppA. We may therefore hypothesize that a common indirect regulator of sigB, oppA, and flaA could be sigB itself, since this gene can induce its own regulation (Chaturongakul et al., 2011).
dtpT expression levels and its correlation with fri
The participation of fri in the indirect regulation and/or stability of proteins involved in adaptation to cold, osmotic, and oxidative stresses has been described (Hébraud and Guzzo, 2000; Dussurget et al., 2005). In the persistent strain CBISA3077, dtpT transcript level was positively correlated with fri, but fri transcript levels did not show significant differences between the two strains. Nevertheless, dtpT transcript level in the persistent strain was significantly higher than in the sporadic strain, suggesting a compensation of the low levels of transcription of oppA obtained for the persistent strain. It is possible that, similarly to OppA, the peptide transport through DtpT could account for the accumulation of peptides within the bacterial cell, thus providing amino acids, such as proline, and conferring cold-stress tolerance to the cell. The results of the present work suggest the existence of two alternative systems for tackling the challenges of cold stress in L. monocytogenes.
Conclusions
Regarding the analysis of the transcript levels of nine cold stress–related genes at 11°C, discrepancies were found between one persistent (CBISA3077) and one sporadic strain (CBISA3049) both collected from the dairy environment. The higher transcript level of sigB in the persistent strain may confer greater resistance to osmotic stress which, together with cold stress, is one of the conditions associated with the cheese dairy environment. The downregulation of two RNA helicases in the persistent strain suggests another important evolutive and/or adaptative feature of this strain. Although OppA has been reported as required for the growth of L. monocytogenes at low temperatures, the persistent strain presented a lower transcript level of oppA, but a higher dtpT transcript level, than the sporadic strain. The results obtained in this work indicated two different gene expression networks in response to low temperature and showed new correlations between some genes that have not been described previously. The differences found are consistent with the persistence of the strain CBISA3077 in the dairy environment. Moreover, the obtained results indicate that while motility should not be considered a key feature for persistence, the comparison of the transcriptomes of a larger number of persistent and sporadic strains, in response to stresses associated with field conditions, can help to elucidate the phenomenon of persistence in L. monocytogenes.
Footnotes
Acknowledgments
The authors thank Alexandre Borges for advice on qPCR and for the geNorm software. The authors also thank Fundação Marquês de Pombal for financial support and INIAV, IP for allowing Paula Cabrita's stay at Laboratório de Microbiologia (CBAA/DRAT), ISA/UL.
Disclosure Statement
No competing financial interests exist.