
Abstract
We used a 10-gene (10G) multilocus sequence typing scheme to investigate the diversity and phylogenetic distribution of 124 Listeria monocytogenes strains across major lineages, major serotypes, and seven epidemic clones that have been previously associated with outbreaks. The 124 isolates proved to be diverse, with a total of 81 sequence types (10G-STs) belonging to 13 clonal complexes (CCs), where all STs of the same CC differ from one another in up to 3 of the 10 alleles (named as 10G-triple-locus-variant-clonal-complexes [10G-TLV-CCs]). Phenotypic characterization for 105 of the 124 strains showed that L. monocytogenes had variable maximum growth rate (μmax) in a defined medium at 16°C, and classification by lineage or serotype was not able to reflect the genetic basis for the difference of this phenotype. Among the six major 10G-TLV-CCs, 10G-TLV-CC4 that included lineage I strains had significantly lower μmax (Tukey honestly significant difference adjusted [adj.] p < 0.05) compared to 10G-TLV-CC1 and 10G-TLV-CC3 that both comprised lineage II strains, indicating a distinct difference in growth of these L. monocytogenes isolates under nutrient-limited conditions among some of the CCs. However, the other three (10G-TLV-CC2, 6, and 10) of the six major 10G-TLV-CCs containing either lineage I or lineage II strains did not show significantly different μmax compared to the others (adj. p < 0.05). Our findings highlighted the importance of using molecular typing methods that can be used in evolutionary analyses as a framework for further understanding the phenotypic characteristics of subgroups of L. monocytogenes.
Introduction
L
Multivirulence-locus sequence typing (MvLST) (Zhang et al., 2004; Chen et al., 2007) together with pulsed-field gel electrophoresis (Buchrieser et al., 1993), have been used to define epidemic clones (ECs) of L. monocytogenes, where isolates that are genetically related but implicated in temporally and geographically distinct outbreaks are classified in one EC (Kathariou et al., 2003; Chen et al., 2007; Cheng et al., 2008; Lomonaco et al., 2013). Multilocus sequence typing (MLST) (Meinersmann et al., 2004), which targets seven housekeeping genes (7G-MLST), has been used to define the clonal complexes (CCs) of L. monocytogenes (Feil, 2004; Ragon et al., 2008). Cantinelli et al. (2013) recently confirmed the correspondence between ECs and CCs in terms of phylogenetic clustering and discriminatory power. In this study, we used 10-gene MLST (10G-MLST) (den Bakker et al., 2010) to investigate the phylogenetic diversity of L. monocytogenes strains. Further, we compared the available classification results based on these previously described typing schemes (CCs and ECs identified by using 7G-MLST and MvLST scheme, respectively) to the one we used (10G-MLST scheme), to understand the correlations among them and enable cross-referencing between the phylogenetic classification results of these schemes.
The ability to persist at low temperatures and in nutrient-limited food processing environments elevates the risk of food contamination and transmission of this pathogen through foods to humans (Lappi et al., 2004; Swaminathan et al., 2007), thus possibly representing one of the important phenotypes to identify the L. monocytogenes isolates with greater potential to spread through the food supply. Since Lineages III and VI of L. monocytogenes are rarely isolated from human-related cases or from food, we focused on Lineages I and II, and compared the maximum growth rates (μmax) of L. monocytogenes isolates growing in a chemically defined medium (DM) at 16°C by lineage (I and II) and 10G-MLST defined CCs (where all STs of the same CC differ from one another in 3 or fewer of the 10 alleles). This will facilitate better understanding of the correlation between phenotype and genotype of L. monocytogenes.
Materials and Methods
Isolates
For measurement of μmax in DM, a group of 105 isolates was assembled from our collection (the Cornell University Food Safety Laboratory (CUFSL]) (Supplementary Table S1; Supplementary Data are available online at
Isolates are listed in numerical order of the “Lineage,” and then in “10G-TLV-CC.”
10G-ST, sequence type (ST) identified by using 10G-MLST scheme.
10G-SLV-CC, single-locus-variant-clonal complex identified by using 10G-MLST scheme and eBURST algorithm, where all STs in the clonal complex (CC) differ from one another in 1 of the 10 alleles.
10G-TLV-CC, triple-locus-variant-clonal complex identified by using 10G-MLST scheme and eBURST algorithm, where all STs in the same CC differ from one another in no more than 3 of the 10 alleles.
7G-ST, ST identified by using 7-gene multilocus sequence typing (7G-MLST) scheme.
7G-CC, CC identified by using 7G-MLST scheme, where all ST in the same CC differ from one another in one of the seven alleles.
μmax, the growth parameter, maximum growth rate, of L. monocytogenes isolates growing in defined medium (DM) at 16°C.
NA, not available.
S, singleton, (1) for 10G-SLV-CCs and 10G-TLV-CCs, singletons were defined as STs differing from all of the other STs in more than 1 or more than 3 of the 10 alleles, respectively; (2) for 7G-CCs, singletons were defined as STs differing from all of the other STs in more than 1 of the 7 alleles.
Isolates are listed in numerical order of the “Lineage,” and then in “10G-TLV-CC.”
10G-ST, sequence type (ST) identified by using 10G-MLST scheme.
10G-SLV-CC, single-locus-variant-clonal complex identified by using 10G-MLST scheme and eBURST algorithm, where all STs in the clonal complex (CC) differ from one another in 1 of the 10 alleles.
10G-TLV-CC, triple-locus-variant-clonal complex identified by using 10G-MLST scheme and eBURST algorithm, where all STs in the same CC differ from one another in no more than 3 of the 10 alleles.
7G-ST, ST identified by using 7-gene multilocus sequence typing (7G-MLST) scheme.
7G-CC, CC identified by using 7G-MLST scheme, where all ST in the same CC differ from one another in 1 of the 7 alleles.
μmax, the growth parameter, maximum growth rate, of Listeria monocytogenes isolates growing in defined medium (DM) at 16°C.
S, singleton, (1) for 10G-SLV-CCs and 10G-TLV-CCs, singletons were defined as STs differing from all of the other STs in more than 1 or more than 3 of the 10 alleles, respectively; (2) for 7G-CCs, singletons were defined as STs differing from all of the other STs in more than 1 of the 7 alleles.
NA, not available.
MLST
All of the 124 isolates were characterized using a previously described 10G-MLST scheme (den Bakker et al., 2010), which includes DNA sequences of partial open reading frames for 10 genes: ldh, lmo0490, prs, sigB, polC, rarA, lmo1555, pbpA, addB, and lmo2763 (den Bakker et al., 2010). This method was selected as it was designed to be used for the majority of Listeria species, not just monocytogenes, and has the potential to be more discriminatory with the inclusion of 10 genes rather than 7. The 10G-MLST data for the isolates from our collection (CUFSL, Supplementary Table S1) can be found on Food Microbe Tracker (
The eBURST V3 (Feil et al., 2004) algorithm was used for the classification of single-locus-variant-clonal complexes (10G-SLV-CCs) and triple-locus-variant-clonal complexes (10G-TLV-CCs). All 10G-STs assigned to the same 10G-SLV-CC and 10G-TLV-CC share identical alleles at 9 and 7 of 10 loci, respectively. Singletons were accordingly defined as 10G-STs having at least two and four allelic mismatches with all other 10G-STs (Supplementary Fig. S1, Tables 1 and 2) for 10G-SLV-CCs or 10G-TLV-CCs, respectively. The central 10G-ST of a clonal complex (CC) was defined as the ST that differed from the largest number of other STs at only a single locus or at three loci for 10G-SLV-CCs or 10G-TV-CCs, respectively. The goeBURST 1.2.1 (Francisco et al., 2009) algorithm was used to visualize the relationship of the 10G-STs by generating a full minimum spinning tree with PHYLOViZ (
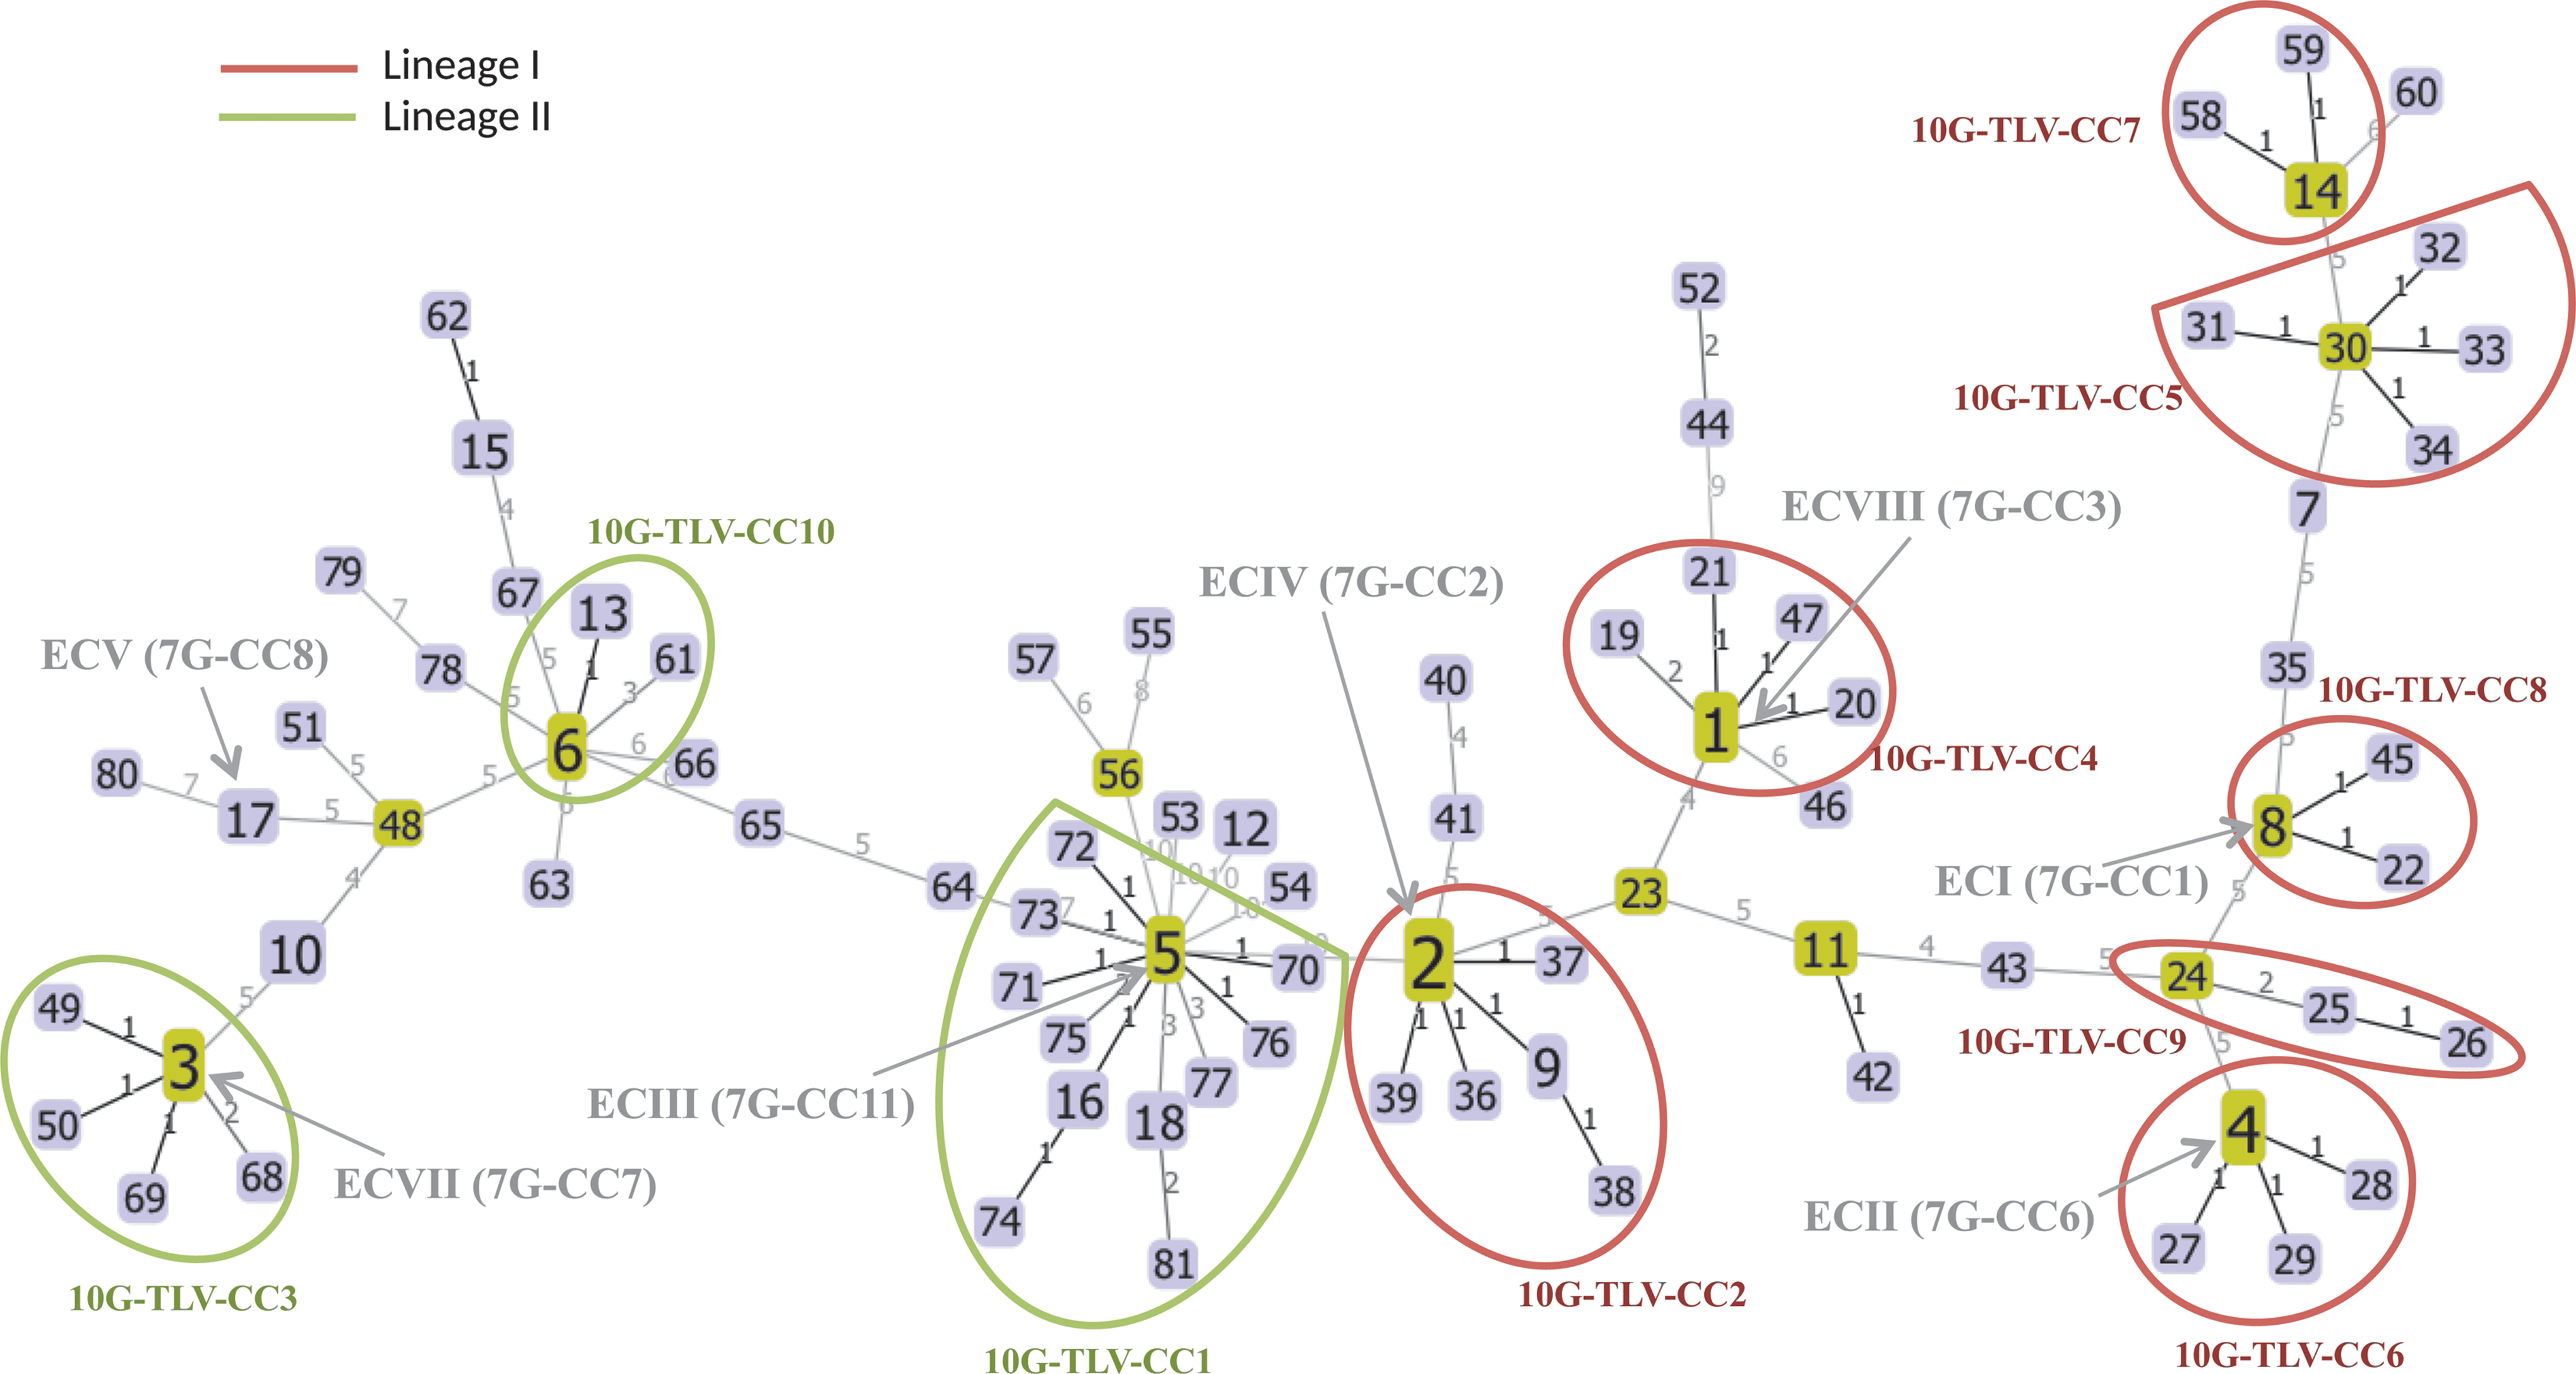
Ten major 10-gene-triple-locus-variant-clonal-complexes (10G-TLV-CCs) and the minimum spanning tree generated by goeBURST for all 10G-sequence types (STs). 10G-TLV-CCs were identified by using 10G-MLST scheme and eBURST algorithm, where all 10G-STs of the same 10G-TLV-CC differ from one another in no more than 3 of the 10 alleles. Ten major 10G-TLV-CCs (defined as the 10G-TLV-CCs containing more than 2 10G-STs) are depicted by red (Lineage I) and green (Lineage II) circles. Seven epidemic clones and the 7G-CCs are designated next to their corresponding 10G-TLV-CCs and specifically pointed to the group founder 10G-STs. The identified group founder 10G-STs are represented by light-green elements, and the other 10G-STs are represented by blue. The size of each element reflects the number of isolates within a 10G-ST. Locus variant levels (levels 1–10) are shown on links between 10G-STs.
For 60 of the 124 isolates, CC (defined as 7G-CC in present study) were assigned to each strain based on sequence types (ST) (defined as 7G-ST in present study) (Tables 1 and 2) presented in the Pasteur MLST database (
Maximum growth rate in defined media
To simulate a nutrient-limited (e.g., food processing) environment for L. monocytogenes growth, we measured μmax of 105 L. monocytogenes isolates using a DM specific to L. monocytogenes (Amezaga et al., 1995) at 16°C, with 25 mM glucose as the carbon source. For growth prior to inoculation in DM, we followed the approach previously described by Stasiewicz et al. (2010). In the DM, optical density (OD)600 readings were taken from hour 0 to 3 as time point 0 (started from the first detectable OD600 value of each sample), and at every 6 or 12 h after time point 0 until stationary phase (up to 96 h). The four-factor modified logistic growth model described by Baranyi and Roberts (1994) was used to calculate the growth parameter μmax, (log[OD600/mL]/day), for each strain. Regression was carried out by using the NLStools package (v 0.0-5) in R v2.6.2. For growth in DM, each strain was tested once; multiple strains per CC were considered replicates.
Analysis of growth rates
One-way analysis of variance (ANOVA) were used to determine whether μmax was significantly different between lineages and among 10G-TLV-CCs for the 105 strains tested (Fig. 2), where the values of the μmax served as the response. The linear model used for the ANOVA was: Y(μmax) = lineage or 10G-TLV-CC + strain + E(error). Strain was treated as a random effect. Significant difference between a given pair of lineages or 10G-TLV-CCs was identified by the Student t-test and Tukey honestly significant difference (HSD) method (α = 0.05; JMP 7; SAS Institute, Inc., Cary, NC), respectively. Student t-test p-value (P) and Tukey HSD adjusted p-values (adj. P) are reported as significant when <0.05.
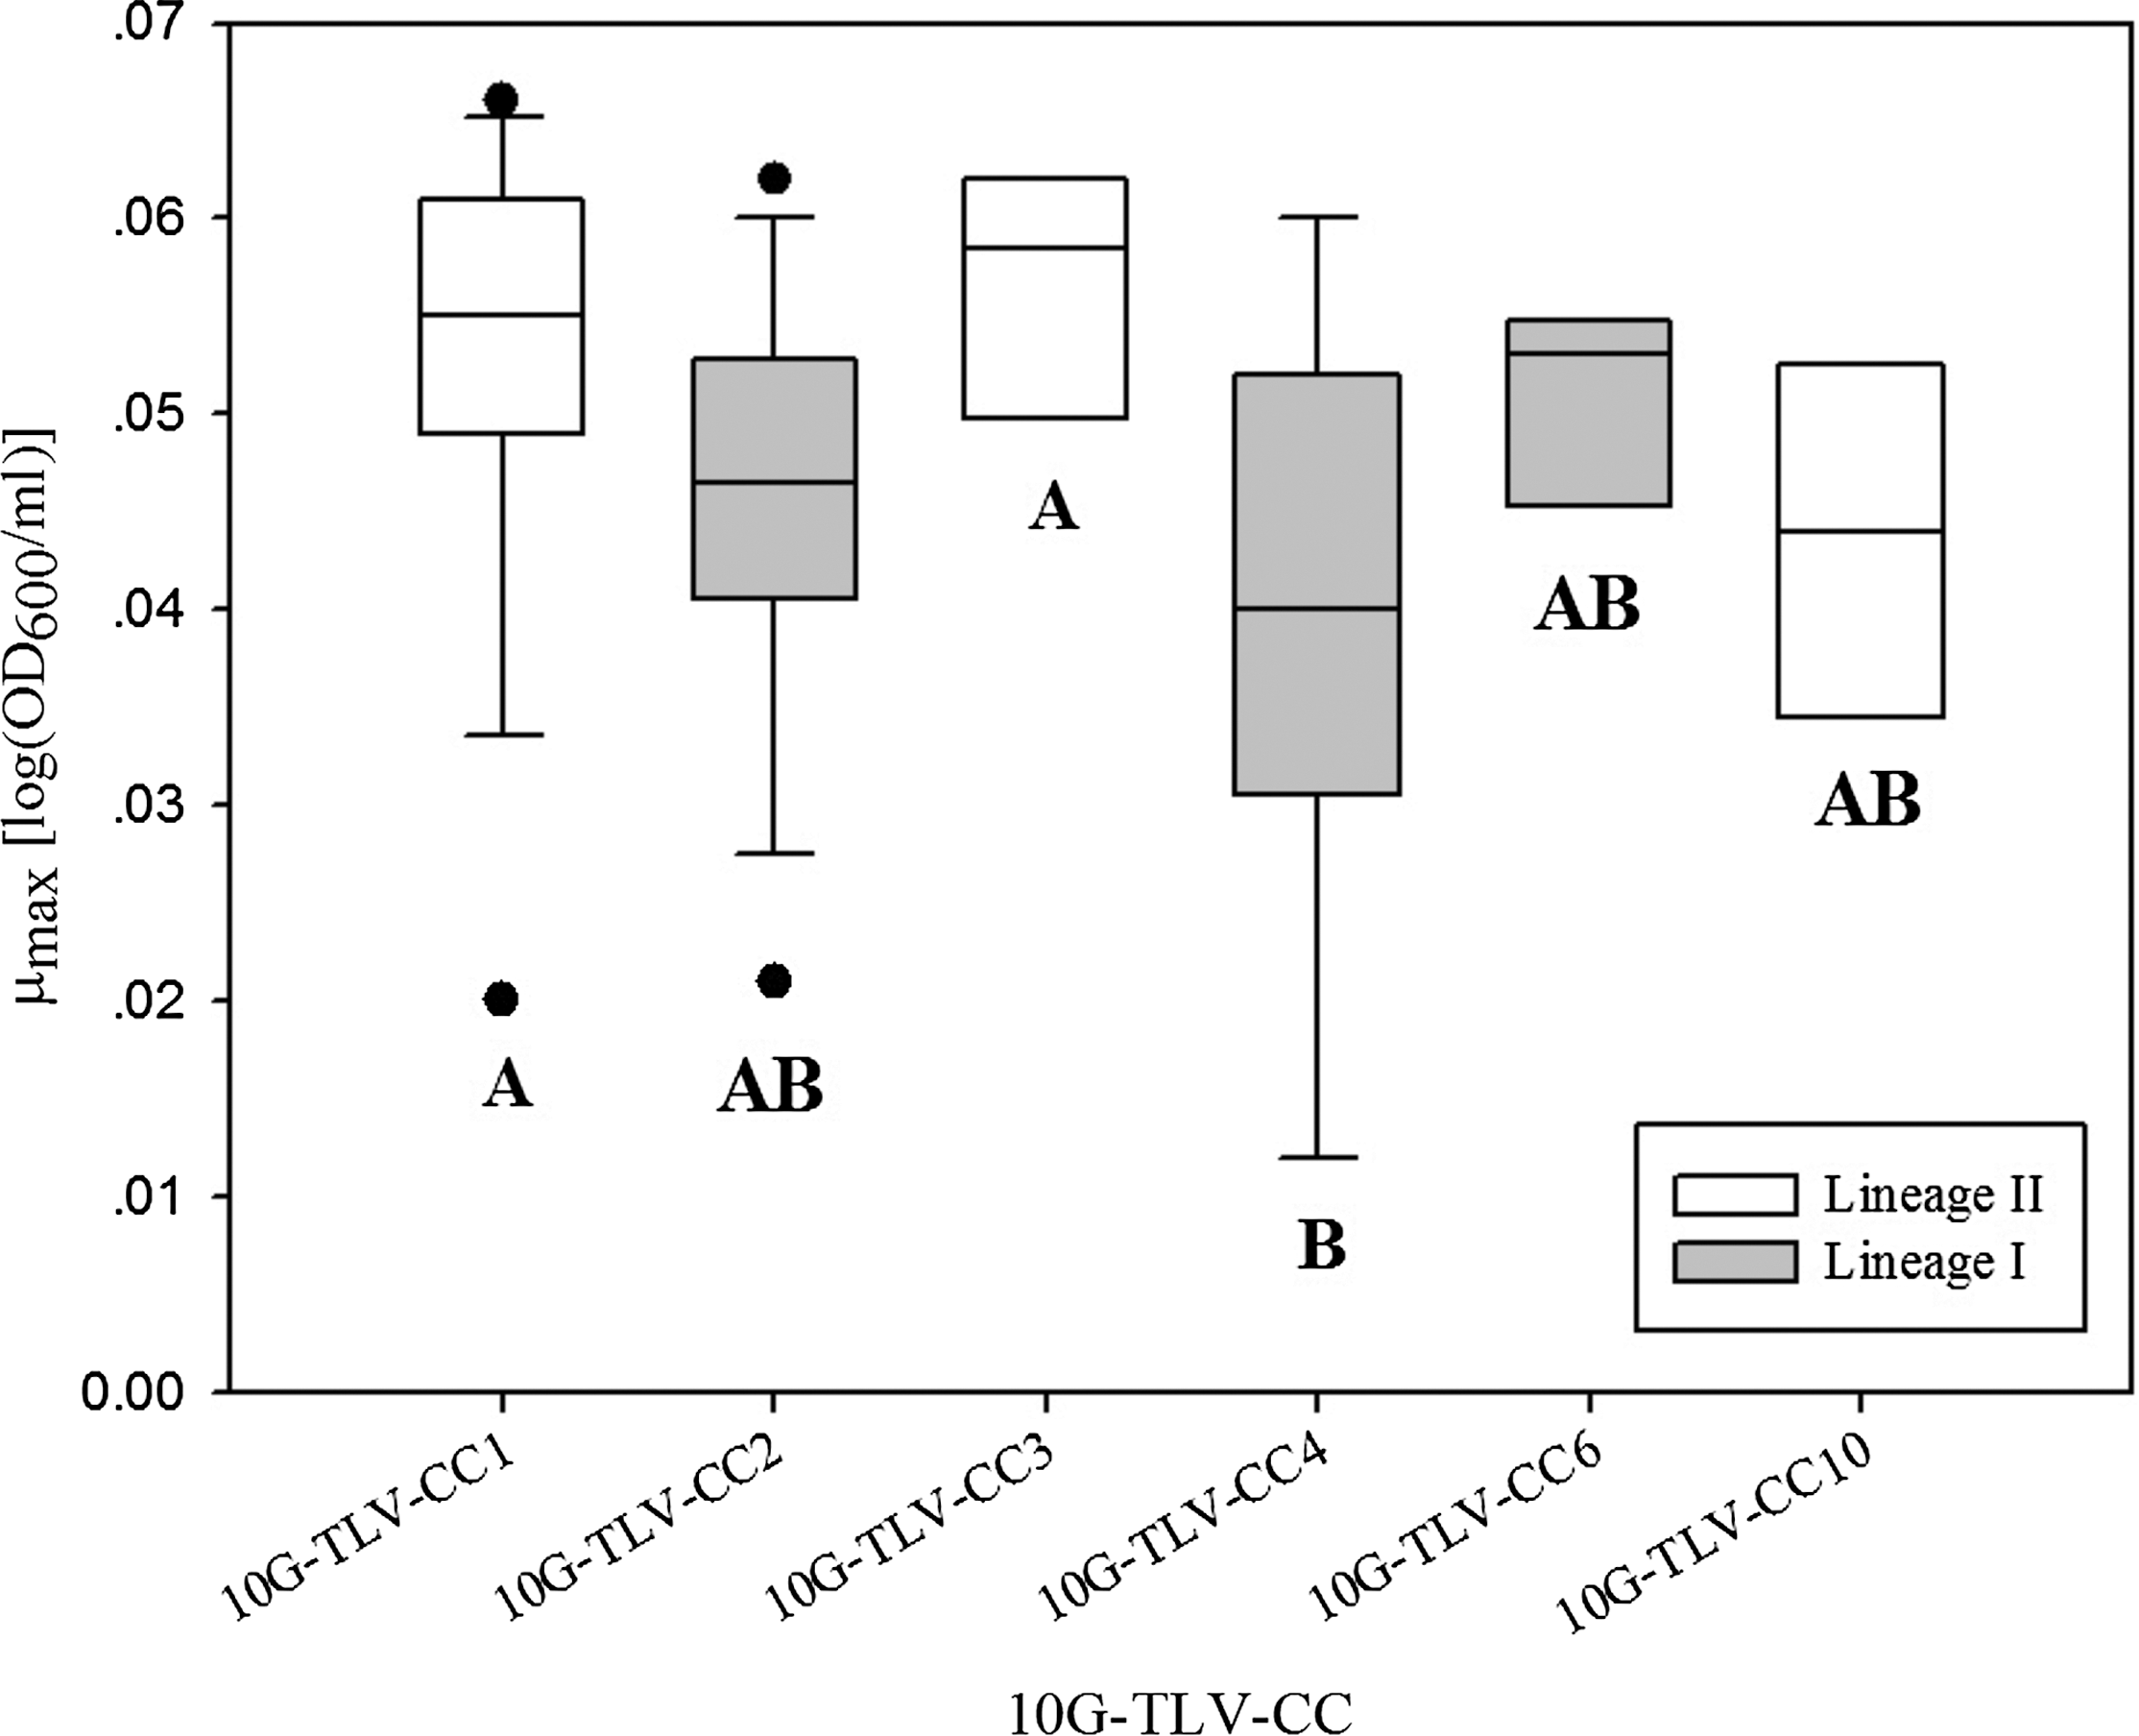
Boxplots of the distribution of Listeria monocytogenes growth parameter maximum growth rate (μmax) for six major 10-gene-triple-locus-variant-clonal-complexes (10G-TLV-CCs) (defined as each has five or more isolates) in defined media at 16°C. 10G-TLV-CC1, 3, and 10 represent Lineage II strains, and 10G-TLV-CC2, and 4 and 6 represent Lineage I strains. The horizontal bar indicates the median for each treatment. Boxes represent the 25th to 75th percentile of the values; whiskers represent the 10th and 90th percentiles. Filled circles represent values outside the 10th to 90th percentiles. Boxplots with the same letter are not statistically different from each other (overall α = 0.05, Tukey honestly significant difference correction).
Results and Discussion
Ten-gene MLST allows for a high level of discrimination of L. monocytogenes
Based on 10G-MLST, the 124 isolates were found to represent a total of 81 10G-STs (Supplementary Fig. S1, Tables 1 and 2). Four 10G-STs (10G-ST1, 2, 3, and 4) predominated, with five or more isolates belonging to each of the 4 STs, and cumulatively account for 21% of isolates (26/124). Among them, 10G-ST1, 2, and 4 belong to lineage I, and 10G-ST3 belongs to lineage II. Overall, Lineage I (39 STs, 64 isolates) contains more STs than lineage II (34 STs, 51 isolates). All 10G-STs containing more than one isolate originated from more than one source, which is consistent with the finding of Haase et al. (2014). The 10G-STs, 10G-ST1, 2, and 3, all included outbreak related isolates and correspond to 7G-ST3, 7G-ST2, and 7G-ST6, respectively. Interestingly, despite that two isolates from the U.S. hot dog outbreak FSL F6-0366 (H7858) and FSL N1-0225 (H7550) were both assigned as 7G-ST6 previously, they were differentiated into two distinct 10G-STs (10G-ST4 and 10G-ST29). The 10G-MLST showed a higher discriminatory power (D = 0.9842) (Hunter, 1990) compared to 7G-MLST (D = 0.9774), indicating that, although with some exceptions, 10G-MLST is generally more discriminatory than 7G-MLST (Tables 1 and 2). This suggests that 10G-MLST is an effective approach for characterizing L. monocytogenes DNA sequence polymorphism with a higher resolution compared to the 7G-MLST scheme.
While 10G-MLST shows increased discrimination over 7G-MLST, most likely these methods will be replaced with whole genome sequencing (WGS) (Roetzer et al., 2013), which is being adopted by public health agencies for routine surveillance (Harris et al., 2013; den Bakker et al., 2014), including an MLST-based approach to analyze genome sequence data (wgMLST) (Jolley and Maiden, 2014). However, interpreting genetic variation will present new challenges to investigation using WGS or wgMLST, whereas the use of a smaller number of genes for clustering may still be useful and efficient to define genetically distinct groups with phenotypic differences. In addition, 7G- or 10G-MLST data will be easily comparable with genome-based data, since the necessary sequences can be easily extracted from WGS data.
eBURST clustered 124 isolates into 12 10G-SLV-CCs and 13 10G-TLV-CCs
We used the eBURST algorithm to identify 12 10G-SLV-CCs and 42 singletons from 81 10G-STs, where all 10G-STs belonging to the same 10G-SLV-CCs share identical alleles at 9 of the 10 loci. Two 10G-SLV-CCs, 10G-SLV-CC1 (12 isolates, 8 STs) and 10G-SLV-CC2 (16 isolates, 6 STs), predominated and accumulatively accounted for 23% isolates (28/124), and 17% of the 10G-STs (14/81); they belong to Lineage II and Lineage I, respectively. Overall, Lineage I (8 10G-SLV-CCs, 11 singletons) contains more 10G-SLV-CCs than Lineage II (4 10G-SLV-CCs, 22 singletons). A large proportion of the outbreak-associated isolates were classified into 10G-SLV-CC2, accounting for 42% of the outbreak-associated isolates (10/24). Overall, isolate classifications into 10G-SLV-CCs and 7G-CCs were consistent for the majority of the clonal complexes (Tables 1 and 2) with some exceptions; for instance, isolates FSL J1-0169 and FSL R2-0182 assigned as 7G-CC5 were differentiated by 10G-MLST into two singletons.
A less stringent approach allowing three-locus variants between members identified 13 10G-TLV-CCs and 31 singletons among the 124 isolates (Tables 1 and 2). This approach allowed more isolates to be clustered into CCs, and reduced the number of singletons, facilitating a better understanding of the relationship between isolates. Among the 13 10G-TLV-CCs, 10 CCs that each contain more than 2 10G-STs were highlighted in Figure 1, and account for 69% isolates (85/124) and 60% of 10G-STs (49/81) (Tables 1 and 2). The 26 outbreak-associated isolates were distributed in 6 of the 13 distinct 10G-TLV-CCs, including 5 of the 10G-TLV-CCs that each represent 1 EC (Fig. 1, Supplementary Table S1). Among them, each of the ECs only reciprocally corresponds to one 10G-TLV-CCs, showing a consistency between the classification into ECs and 10G-TLV-CCs, which is similar to the findings of Cantinelli et al. (2013) that MLST-based CCs correspond to the EC classification.
Growth rates show considerable differences between lineages and between 10G-TLV-CCs
Our data showed that L. monocytogenes had highly variable μmax across the 105 isolates in DM at 16°C, ranging from 0.012 to 0.066 log(OD600/mL)/day (Tables 1 and 2). More specifically, a one-way ANOVA model with lineage effect (two levels: Lineages I and II) for the growth parameter μmax showed a significant effect (p = 0.0059) of lineage on μmax (Table 3). Lineage I isolates had significantly lower (p < 0.05) average μmax (0.045 ± 0.010 log[OD600/mL]/day) compared to Lineage II isolates [0.052 ± 0.011 log(OD600/mL)/day] (Table 3). In contrast, Bergholz et al. (2010) demonstrated that Lineage I strains had a significantly higher growth rate than Lineage II strains in brain heart infusion broth (BHIB) with 6% salt at 37°C. Moreover, our previous study on L. monocytogenes growth on cold smoked salmon and in modified BHIB with 4.65% salt at 7°C showed that there was no significant difference between the average μmax of Lineage I and Lineage II strains under either of the growth conditions (Tang et al., 2013). Possible explanations for these observed differences include the high salt content and the difference of the incubation temperatures, while the DM used in the present study simulated a nutrient-limited food-processing environment, usually with relatively low temperatures (about 16°C). Similarly to our finding, Bruhn et al. (2005) found that Lineage II strains outcompeted Lineage I strains in selective enrichment media. However, based on the findings of Haase et al. (2014) that environmental and food isolates are equally distributed between Lineage I and II, it is not likely that the ability of Lineage II strains to grow faster in nonhost environments (especially nutrient-limited food-processing environments) can increase the prevalence of all Lineage II strains in environmental and food samples. Our observation, combined with the findings of Haase et al. (2014), may suggest that it is more likely that just some of the subgroups of Lineage II strains can grow faster than Lineage I strains in such environments.
μmax, the growth parameter, maximum growth rate, of L. monocytogenes isolates growing in defined media (DM) at 16°C.
10G-TLV-CC, triple-locus-variant-clonal complex identified by using 10-gene multilocus sequence typing (10G-MLST) scheme and eBURST algorithm, where all sequence types in the same clonal complex (CC) differ from one another in no more than 3 of the 10 alleles.
Results are summarized by means ± standard deviations for strains of each category; each strain was tested once.
Means within a given column with the same letter are not statistically different from each other (overall α = 0.05, Tukey's correction).
To further compare the growth rate of subgroups of Lineage I and Lineage II strains, a one-way ANOVA model with 10G-TLV-CC effect (six levels: 10G-TLV-CC1, 2, 3, 4, 6, 10, each having at least five isolates) for the growth parameter μmax was conducted, and showed significant effect (p = 0.0087) of 10G-TLV-CCs on μmax (Fig. 2, Table 3). The 10G-TLV-CC4 showed the lowest average μmax (0.040 ± 0.015 log[OD600/mL]/day) and was significantly lower (adj. p < 0.05) than 10G-TLV-CC1 (0.053 ± 0.011 log[OD600/mL]/day) and 10G-TLV-CC3 (0.057 ± 0.006 log[OD600/mL]/day) (Fig. 2, Table 3). The average μmax of each of the 10G-TLV-CC2 (7G-CC2), 10G-TLV-CC 6 (7G-CC6) and 10G-TLV-CC10 (7G-CC9) was not significantly different (adj. p > 0.05) from the others (Fig. 2, Table 3). The 10G-TLV-CC4, representing partial Lineage I strains, corresponds to 7G-CC3. The 10G-TLV-C1 and 10G-TLV-C3, representing partial Lineage II strains, correspond to 7G-CC11 and 7G-CC7 (Supplementary Table S1). Interestingly, it has been reported that 7G-CC3 (10G-TLV-CC4) ranked among the four most common clones (7G-CC2, 7G-CC1, 7G-CC3, and 7G-CC9) in the world, and is one of the most highly prevalent 7G-CCs (7G-CC1, 7G-CC2, and 7G-CC3) in Lineage I (Chenal-Francisque et al., 2011). According to our result, it seems that the majority of the most prevalent 7G-CCs aforementioned do not have a significant higher growth rate in DM as compared to the less prevalent 7G-CCs.
We also assessed whether the source or serotype of isolates may influence μmax in DM. However, a one-way ANOVA model with source effect (human, food, environment, and animal as four levels of this effect) or serotype (1/2a, 1/2b, and 4b as three levels of this effect) for the growth parameter μmax did not show significant effect (p > 0.05) on μmax. Although various studies have characterized L. monocytogenes isolates to probe for phenotypic differences between L. monocytogenes lineages or serotypes (Mereghetti et al., 2000; Buncic et al., 2001; Bergholz et al., 2010; Stasiewicz et al., 2010; Tang et al., 2013), our data suggest that it is necessary to compare between L. monocytogenes CCs, which are defined by sequence typing methods such as 10G-MLST, when studying the phenotypes of L. monocytogenes, as classification by lineage or serotype may not be able to reflect the genetic basis for phenotype difference between different phenotypes of L. monocytogenes clusters.
Taken together, our data showed that (1) L. monocytogenes isolates have diverse μmax in DM at 16°C, and (2) the isolates assigned as 10G-TLV-CC4, which represented part of the Lineage I isolates and was predominated by serotype 1/2b, had lower average μmax compared to two 10G-TLV-CCs that represented part of the Lineage II isolates and predominated by serotype 1/2a.
Conclusions
Our findings demonstrated that the 124 L. monocytogenes isolates are genetically diverse, and the outbreak-associated isolates were widespread through the diversity of L. monocytogenes. We also identified that, among the 105 isolates tested, there was considerable variation in maximum growth rate in a nutrient-limited growth condition. We found that certain genetic subgroups of Lineage II strains could grow faster than some genetic subgroups of Lineage I strains under this nutrient-limited condition, which may facilitate their persistence in nonhost environments, thus leading to a higher risk of food contamination and transmission of this pathogen through foods to humans. Our data highlighted the importance of using molecular typing methods that are amenable to evolutionary analysis for a further understanding of the phylogenetic distribution of L. monocytogenes isolates and for the phenotypic characterization of genetic subgroups of L. monocytogenes. Classification of L. monocytogenes based on DNA sequence polymorphism, in the long term, may facilitate the surveillance, detection, and control of L. monocytogenes strains that are more likely to cause outbreaks and sporadic listeriosis cases.
Footnotes
Acknowledgments
We thank Maureen Gunderson for assistance with media preparation. This work was supported by New York Sea Grant R/SHH-15, funded under award NA07OAR4170010 from the National Sea Grant College Program of the U.S. Department of Commerce's National Oceanic and Atmospheric Administration, to the Research Foundation of State University of New York, and by Agriculture and Food Research Initiative grant 2010-65201-20575 from the U.S. Department of Agriculture, National Institute of Food and Agriculture, Food Safety Program.
Disclosure Statement
No competing financial interests exist.
References
Supplementary Material
Please find the following supplemental material available below.
For Open Access articles published under a Creative Commons License, all supplemental material carries the same license as the article it is associated with.
For non-Open Access articles published, all supplemental material carries a non-exclusive license, and permission requests for re-use of supplemental material or any part of supplemental material shall be sent directly to the copyright owner as specified in the copyright notice associated with the article.