
Abstract
Shiga toxin-producing Escherichia coli (STEC) are foodborne pathogens, and beef cattle are recognized as the principal reservoir. The aims of this study were (1) to identify the most sensitive combination of selective enrichment broths and agars for STEC isolation in artificially inoculated ground beef samples, and (2) to evaluate the most efficient combination(s) of methods for naturally contaminated ground beef samples. A total of 192 ground beef samples were artificially inoculated with STEC and non-stx bacterial strains. A combination of four enrichment broths and three agars were evaluated for sensitivity, specificity, and positive predictive value for STEC isolation from experimentally inoculated samples. Enrichments with either modified tryptic soy broth (mTSB) containing 8 mg/L novobiocin (mTSB-8) or modified Escherichia coli (mEC) broth followed by isolation in MacConkey agar were the most sensitive combinations for STEC isolation of artificially inoculated samples. Independently, both enrichments media followed by isolation in MacConkey were used to evaluate ground beef samples from 43 retail stores, yielding 65.1% and 58.1% stx-positive samples by RT-PCR, respectively. No difference was observed in the isolate proportions between these two methods (8/25 [32%] and 8/28 [28.6%]). Identical serotypes and stx genotypes were observed in STEC strains isolated from the same samples by either method. In this study, no single enrichment protocol was sufficient to detect all STEC in artificially inoculated samples and had considerable variation in detection ability with naturally contaminated samples. Moreover, none of the single or combinations of multiple isolation agars used were capable of identifying all STEC serogroups in either artificially inoculated or naturally occurring STEC-contaminated ground beef. Therefore, it may be prudent to conclude that there is no single method or combination of isolation methods capable of identifying all STEC serogroups.
Introduction
S
STEC strains have been isolated from a variety of domestic animals with ruminants, especially beef cattle, recognized as their main natural reservoir (Caprioli et al., 2005). During carcass processing, transfer of bacteria from the animal's hide or fecal contamination of the carcass can facilitate the transmission of pathogenic E. coli to meat products (Elder et al., 2000).
There is no single marker or combination of markers to differentiate STEC from nonpathogenic E. coli strains (Brusa et al., 2013). Therefore, several methods for the isolation, detection, and characterization of STEC O157:H7 are currently recommended worldwide (ISO, 2001; USDA/FSIS, 2015). Although enrichment protocols are suitable for the most prevalent serogroups identified epidemiologically in clinical infections (O26, O45, O103, O111, O121, O145, and O157) (Gill et al., 2014), they are not always effective for the other STEC serogroups. Media with various selective or enrichment compounds have been used to inhibit the competitive flora in food samples (Vimont et al., 2006; Wang et al., 2013); however, STEC is a heterogeneous bacterial group, and selective enrichment broths can inhibit the development of some serogroups (Drysdale et al., 2004; Feng et al., 2011). Buffered peptone water (BPW) at 37 ± 1°C can be used as an alternative enrichment protocol; however, the isolation rate with this enrichment media can be affected due to the high number of background microflora allowed by BPW (Drysdale et al., 2004). In addition to the standard methods, other studies have shown experimentally the benefits of using modified E. coli broth (mEC) as enrichment media (Brusa et al., 2013).
The aim of this study was to evaluate multiple combinations of selective enrichment broths and agars for STEC isolation in artificially inoculated ground beef samples and then apply the most efficient methods combination in a survey of naturally contaminated ground beef samples from retail stores. While this study was underway, the International Organization for Standardization (ISO/TS 13136:2012), the United States Department of Agriculture (USDA MLG 5B.03) and the Food and Drug Administration (Feng et al., 2011) all updated techniques; however, they still have different recommended enrichment protocols that combined different selective broths with different incubation temperatures.
Material and Methods
Artificially inoculated samples
Bacterial strains
A total of 12 STEC and 24 non-stx bacterial strains were used to artificially inoculate ground beef samples (Table 1). All strains belong to the collection of the Instituto de Genética Veterinaria “Ing. Fernando N. Dulout”. They were stored at −70°C in brain heart infusion (BHI) broth (Biokar, Zac de Ther, France) with 30% glycerol (ICN Biomedicals, Solon, Ohio).
A, animal; C, cattle; E: environment; F, food; H, human; IGEVET, Instituto de Genética Veterinaria “Ing. Fernando N. Dulout” (Universidad Nacional de La Plata (UNLP) - Consejo Nacional de Investigaciones Científicas y Técnicas (CONICET) LA PLATA), Facultad de Ciencias Veterinarias; U, unknown; W, water.
Preparation of inoculum, sample inoculation, and enrichment protocols
STEC and non-stx strain frozen stocks were grown in BHI broth at 37°C for 18 h overnight, streaked onto BHI agar plates, and incubated 24 h at 37°C to assure purity. For ground beef inoculation, a single colony of each strain was selected and grown overnight in 4 mL of BHI broth at 37°C. A total of 196 ground beef samples (10 g) were prepared from a single batch of ground beef obtained from a retail store which was supplied with meat from a single processing plant. For the purpose of this specific study, we were provided with meat from a single cow that was confirmed to be STEC-negative by stx 1 and stx 2 gene detection with RT-PCR (ISO, 2012).
Final STEC and non-stx strains overnight cultures were serially diluted in BPW (Biokar). Eight samples per strain were artificially inoculated with 12 different STEC strains (n = 96), and four samples per strain were artificially inoculated with 24 different non-stx bacterial strains (n = 96) by adding 1 mL inoculum of 100 CFU/mL or 1000 CFU/mL, respectively. One milliliter of sterile BPW (Biokar) was inoculated to four negative control samples. The inoculum level was confirmed by plating on plate count agar (Laboratorios Britania, Buenos Aires, Argentina) and incubating overnight at 37°C.
STEC and non-stx inoculated samples were divided into four groups of 24 samples each and assigned to four different enrichment protocols as follows: protocol A, modified tryptic soy broth (mTSB) containing 16 mg/L novobiocin (Acumedia Manufacturers, Lansing, MI) at 37 ± 1°C for 20 h (mTSB-16) (ISO-13136:2012); protocol B, mTSB containing 8 mg/L novobiocin plus casamino acids (Acumedia) at 42 ± 1°C for 20 h (mTSB-8) (USDA/FSIS, 2012); protocol C, mEC broth (Acumedia) at 42 ± 1°C for 20 h (mEC); and protocol D, modified BPW with pyruvate at 37 ± 1°C for 5 h followed by acriflavine, cefsulodin, and vancomycin addition (Biokar) at 42 ± 1°C (mBPWp+ACV) (Feng et al., 2011). Enrichment consisted in incubating each group of artificially inoculated samples (n = 49) with 90 mL of respective enrichment media. One negative control sample was assigned to each enrichment protocol.
Screening by RT-PCR and STEC isolation
Bacterial DNA extraction was performed directly from 1 mL of each enrichment broth, in 1% Triton X-100 in TE buffer 1× (10 mM Tris: 1 mM Ethylenediaminetetraacetic acid, pH 8), and boiled for 10–15 min (Leotta et al., 2005). Detection of stx genes by RT-PCR was carried out as previously described (Brusa et al., 2013). Samples were considered STEC positive when stx 1 and/or stx 2 genes were detected. One mL of each PCR-positive sample was spun down and the pellet was plated onto three different agars: agar 1, Levine eosin methylene blue (L-EMB) (Biokar); agar 2, MacConkey agar (MC) (Becton Dickinson Co., Sparks, MD); And agar 3, triptone bile X-glucuronide (TBX) (Biokar). All plates were incubated at 37°C for 18 h. Fifty colonies with E. coli morphology were selected from each plate and point-inoculated on nutrient agar (Laboratorios Britania). After incubation, selected colonies were pooled in five groups of 10 and were screened for the presence of stx 1 and stx 2 genes by multiplex-PCR (Leotta et al., 2005). Positive stx-pools were further analyzed by multiplex-PCR in order to identify each individual stx-positive colony.
Experimental design
Phase one: Experimentally inoculated samples
The isolation proportions obtained with a combination of different methods in experimentally inoculated sample were evaluated. The first combination was based on the enrichment media–single agar [E-SA] method (Fig. 1A). The performance of each enrichment media (protocols A, B, C, and D) was evaluated by isolation in three different agars (agars 1, 2, and 3). Thus, the isolation on E-SA method was expressed as the number of isolates obtained from a single enrichment media followed by a single agar (A1 = mTSB-16 + L-EMB, A2 = mTSB-16 + MC, A3 = mTSB-16 + TBX; B1 = mTSB-8 + L-EMB, B2 = mTSB-8 + MC, A3 = mTSB-8 + TBX; C1 = mEC + L-EMB, C2 = mEC + MC, C3 = mEC + TBX; D1 = mBPW + L-EMB, D2 = mBPW + MC, D3 = mBPW + TBX) (Fig. 1A). The second combination, the enrichment media–triple agar method [E-TA], computed the number of isolates obtained from three different agars after each enrichment protocol (Fig. 1B). Thus, the isolation proportion on E-TA methods was expressed as single enrichment media followed by adding the number of isolates from three agars (A123 = mTSB-16 + L-EMB + MC + TBX; B123 = mTSB-8 + L-EMB + MC + TBX; C123 = mEC + L-EMB + MC + TBX; D123 = mBPW + L-EMB + MC +TBX) (Fig. 1B).
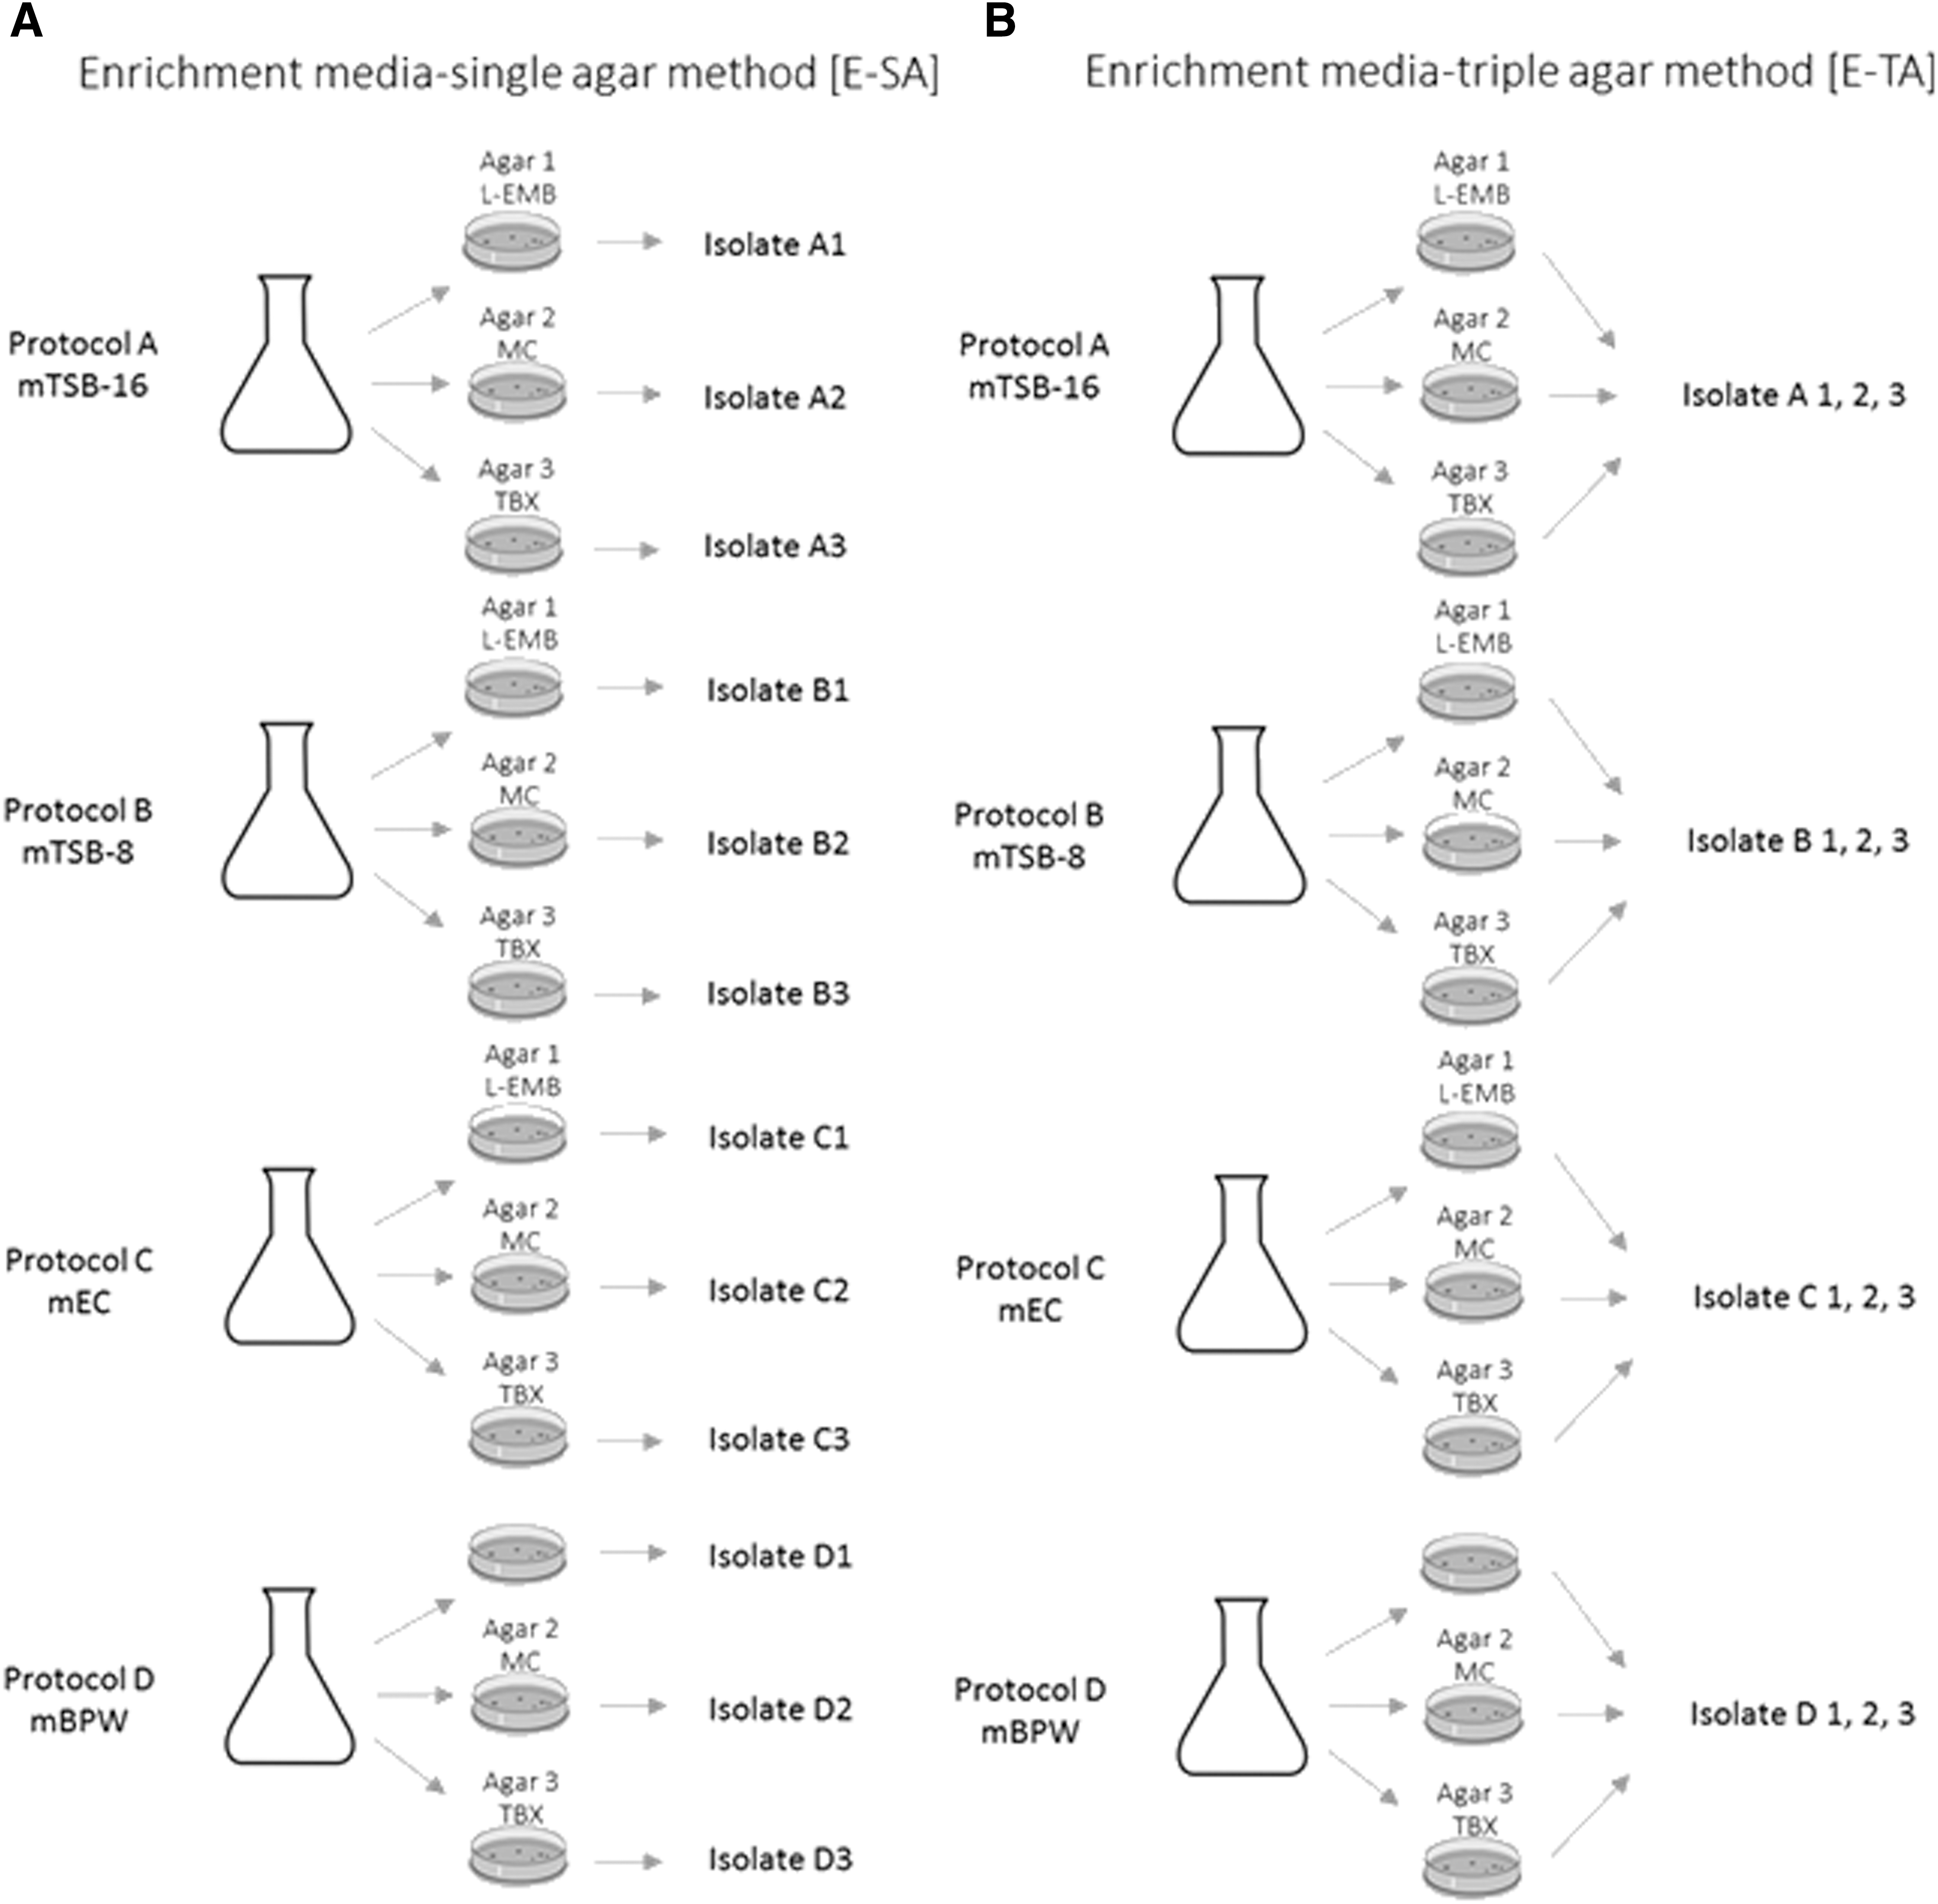
Protocols for artificially inoculated samples.
Phase two: Naturally contaminated samples
Based on the results obtained with experimentally inoculated samples, we selected the best two E-SA methods for detection of STEC in naturally contaminated samples. From February to September 2013, 43 ground beef samples (25 g) from 43 retail stores were collected in duplicate and enriched in 225 mL of enrichment protocols B and C. Then, samples were screened for the presence of stx genes as previously described for artificially inoculated samples. Isolation of STEC-positive samples was carried out in MC agar. Serotyping of O and H antigens was performed by plate micro-agglutination and tube agglutination, respectively, using antisera kit (O1-O186) and 56 H antisera produced by the Laboratorio de Referencia de E. coli (Lugo, Spain), as described by Blanco et al. (1997). The eae gene was determined using primers SK1-SK2 as described by Gannon et al. (1993). E. coli strains 2348/69 and ATCC 25922 were used as positive and negative controls, respectively.
Statistical analysis
Isolation sensitivity, specificity, and positive predictive values of positive results (PPV+), as well as 95% confidence intervals (CI) were computed for the enrichment E-SA method and for the enrichment E-TA method. Sensitivity and specificity and PPV+ were calculated as follows: sensitivity, a/(a+b), where a = stx PCR-positive and positive isolate, b = stx PCR-positive and negative isolate; specificity d/(c+d), where b = stx PCR-negative and positive isolate, c = stx PCR-negative and negative isolate; and PPV+, a/(a+c), where a = stx PCR-positive and positive isolate, c = stx PCR-negative and negative isolate. Fishers' exact test and chi-square test with Yates' correction were used to compare the proportions of STEC positive results obtained from E-SA and E-TA. The difference in frequency of isolations obtained from each E-TA method with the different enrichment media was determined with Pearson's chi-square test. P-values less than 0.05 were considered statistically significant and all tests were two-tailed. To determine agreement between E-SA and E-TA, weighted Cohen's kappa coefficient (k) with a 95% CI was calculated and interpreted as follows: poor, <0.20; fair, 0.20–0.39; moderate, 0.40–0.59; good, 0.60–0.79; and excellent, ≥0.80. Agreement between tests was significant if p < 0.05 by Bowker's test of symmetry. Statistical analyses were performed using JMP 11.
Results
Phase one: Experimentally inoculated samples
Both sensitivity and positive predictive values of E-SA and E-TA isolation of artificially inoculated samples are presented in Table 2. The specificity of all E-SA and E-TA methods was 100% (95% CI 85.62–100%). No statistical differences in the proportion of isolates obtained with E-SA and E-TA were observed (p < 0.05), except for the following combinations: A3 versus A123, B2 versus B123 and D123 versus D1, D2, and D3 (Table 3). The proportion of positive E-TAs after different enrichment media was statistically significant (chi-squared = 19.06; DF = 3; p = 0.001). The correlation between E-SA and E-TA is shown in Table 3. The k coefficient showed good agreement between A3 and A123, C2, C3, and C123, and excellent agreement between B2 and B123, and D1 and D2 with D123 (Table 3). The proportion of isolates obtained with the E-TA, showed good agreement among methods A123, B123, and C123 (k-value 0.647, 95% CI, 0.0131.0) and fair agreement between methods A123 and C123 (k-value 0.032, 95% CI 0.22–0.291).
Letters in protocol names indicate enrichment selective media: complete version: A: modified tryptic soy broth containing 16 mg/L novobiocin (ISO/TS 13136:2012); B: mTSB containing 8 mg/L novobiocin plus casamino acids (USDA MLG 5.03); C: modified Escherichia coli broth; D: modified buffered peptone water with pyruvate followed by acriflavine, cefsulodin, and vancomycin addition (Feng et al., 2011). Numbers indicate agars used: 1, Levine eosin methylene blue; 2: MacConkey; 3: triptone bile X-glucuronide.
95% CI, 95% confidence interval; PPR+, positive predictive value of positive results.
In protocol names, letters indicate enrichment selective media: A, ISO/TS 13136:2012; B, USDA MLG 5.03; C, modified Escherichia coli broth; D, Feng et al., 2011. Numbers indicate agars: 1, Levine eosin methylene blue; 2, MacConkey; 3, triptone bile X-glucoronide.
p values refer to Fisher's exact test.
Phase two: naturally contaminated samples
Screening of ground beef samples obtained from retail outlets showed that 25/43 (58.1%) and 28/43 (65.1%) samples enriched in protocols B and C, respectively, were stx-positive. No significant differences (chi-squared = 0.124, DF = 1, p = 0.72) were observed in the isolation proportion between methods B2 (8/25; 32.0%) and C2 (8/28; 28.6%). STEC strains isolated with both methods showed identical serotypes and stx genotypes. Eight different O:H serotypes and three different stx-genotypes were found: O26:H11 (stx 1), O64:H20 (stx 2), O91:H21 (stx 2), O113:H21 (stx 2), O141:H49 (stx 2), O178:H19 (stx 1/stx 2), OUT:H19 (stx 2), and OUT:HUT (stx 2). Only O26:H11 (stx 1) was positive for the eae gene.
Discussion
The current study evaluates the performance of four enrichment protocols in combination with three agars for the isolation of all STEC strains in artificially inoculated samples and in naturally infected ground beef from 43 retail stores.
ISO Technical Specification (TS) 13136:2012 refers to a horizontal method for STEC detection and determination of serogroups O157, O111, O26, O103, and O145 (ISO, 2012). Due to the emergence of atypical stx- positive strains associated with severe disease outbreaks (Frank et al., 2011), the ISO determined that all STEC should be considered pathogenic and in ISO/TS 13136:2012 therefore proposed three different enrichment broths followed by isolation in TBX based upon the sample matrix to be evaluated. Accordingly, enrichment protocol A was used because of the sample characteristics of this study. The sensitivity of the ISO/TS 13136:2012 method A3 (mTSB-16+ TBX) was significantly higher for E-SA as compared with method A1 (mTSB-16 + EMB) and A2 (mTSB-16+ MC). However, the isolation proportion for E-TA increased significantly (91.6%) in artificially inoculated samples. It can be speculated that the increment in isolation proportion observed in the E-TA compared with each E-SA method in samples enriched with protocol A, is due to an increment in the number of plates evaluated but not due to better growth condition provided by the agars used for isolation.
The USDA Microbiology Laboratory Guidebook (MLG) 5B.03 (effective date November 6, 2012) describes the methodology necessary to detect and isolate non-O157 STEC serogroups including O26, O45, O103, O111, O121, and O145 from meat products (USDA MLG 5B.03). USDA guidelines also require isolation by immunomagnetic separation followed by culture in Rainbow Agar. Among all three E-SA method using the enrichment condition recommended by USDA MLG 5B.03 (enrichment protocol B), the isolation sensitivity in artificially inoculated samples was higher (95.8%) with MC agar compared with EMB and TBX agars. In addition, we did not observe significant improvements in sensitivity with enrichment protocol B regardless of isolation with E-SA or E-TA methods.
The FDA proposes a method for diarrheagenic E. coli, including STEC O157:H7 and non-O157 implicated in foodborne illnesses (Feng et al., 2011). Although this method was not designed for meat products, it can be used to analyze ready-to-eat food containing meat or ground beef. In our screening of artificially inoculated samples, enrichment protocol D was the less effective of all isolation methods (D1, D2, and D3). Despite the significant improvements in isolation sensitivity observed with E-TA method (58.3%), this method remained significantly below the sensitivity values obtained with other methods evaluated in this study. Several authors have described the use of protocol D to enrich non-O157:H7 STEC from different foodstuffs (Baranzoni et al., 2014; Kase et al., 2015); however, results obtained in the present study showed that enrichment protocol D with either E-SA or E-TA methods was less sensitive than the other enrichments media for non-O157 STEC used to evaluated ground beef.
Previous reports have shown the potential use of enrichment protocol C for the detection of non-O157 STEC in bovine carcasses in slaughterhouses (Masana et al., 2011), ground beef samples, and environmental samples from retail stores (Brusa et al., 2013). In this study the sensitivity of two of the E-SA methods, enrichment protocol C followed by isolation either in MC or TBX, was comparable with the values observed with standard methods (91.6%). Moreover, the sensitivity with enrichment protocol C increased significantly (95.8%) with the E-TA method.
The efficacy of MC for STEC isolation has been previously reported (Drysdale et al., 2004; Auvray et al., 2009; Masana et al., 2011; Brusa et al., 2013). Before the existence of official guidelines for non-O157 STEC isolation, MC was used to evaluate and compare the enrichment efficiency of mEC and mTSB (Kanki et al., 2009). In our study, MC agar showed to be the most efficient in E-SA methods for enrichment protocols B, C, and D, with a sensitivity of 95.8%, 91.6%, and 45.8%, respectively. However, isolation in MC agar was significantly less sensitive (75%) with E-SA method A3 (mTSB-16 + TBX) (83.3%).
Based on the results obtained with experimentally inoculated samples, we selected two enrichment broths (mTSB-8 and mEC) to evaluate naturally contaminated samples, followed by isolation on MC agar. Based on PCR results, 25/43 (58.1%) and 28/43 (65.1%) of ground beef samples were stx-positive with enrichment protocols B and C respectively. The proportion of STEC-positive isolates obtained from methods B2 and C2 was 8/25 (32.0%) and 8/28 (28.5%), respectively. We isolated six STEC serotypes and two untypeable STEC from ground beef using methods B2 and C2. In this study one O26:H11 (stx 1 +/eae +) strain was isolated by both methods used to evaluate naturally contaminated samples. Serogroup O26:H11 is included in the most prevalent STEC serogroups in clinical cases and human outbreaks (Possé et al., 2008; EFSA, 2013). In addition, amongst the isolates detected in naturally contaminated samples we detect O91:H21 (stx 2 +/eae −), O113:H21 (stx 2 +/eae −) and O178:H19 (stx 1 +/stx 2 +/eae −), which are sporadically detected in human diseases (EFSA, 2013). Based on these results we support the necessity to reinforce the isolation steps to confirm the presence of the most prevalent serogroups to humans. The current effort to isolate all STEC serotypes could be detrimental in the confirmation of serotypes clinically importance to humans.
The proportion of isolates (32.0% and 28.5%) obtained for both methods used for naturally contaminated samples is similar to previously reported. The success to confirm STEC presence by culture isolation in ground beef was 29.8% in the United States (Bosilevac et al., 2011) and 34.0% in France (Pradel et al., 2000); in boneless beef trim used for ground beef it was 20% in the Unite dStates, Australia, and New Zealand and 56% in Uruguay (Bosilevac et al., 2007). Numerous reports have demonstrated poor correlation between the number of positive samples during stx screening and the number of samples that can be confirmed by isolation (Pradel et al., 2000; Bosilevac et al., 2007; Bosilevac et al., 2011). Factors such as low detection limit of the screening technique and high levels of background bacteria could impair the accurate detection of STEC in contaminated meat samples (Auvray et al., 2009; Ju et al., 2012). In addition, other variables such as volume of samples plated, amount of plates necessary to achieve STEC isolates, number of colonies selected per plate, and laboratory personnel experience might affect STEC detection in meat samples.
Conclusions
Currently, there are multiple STEC isolation methods available to identify contaminated food products. In addition, stx-gene PCR is still being used as a screening for STEC detection. However, stx-PCR is also used as a confirmatory for enrichment broths or stx-positive samples. Thus, the mere detection of stx-genes as a definitive or confirmatory test for STEC presence might be excessive and STEC could be overdiagnosed. In numerous occasions, food products are disqualified due to the presence of stx-positive genes, regardless the bacterial strain carrying these genes. On the other hand, as we observed in this study, all possible isolation methods available were not sufficient to detect artificially contaminated samples and performed poorly in naturally infected samples. Therefore, we can conclude that there is no single method or combination of isolation methods capable of identifying all STEC serogroups. It would be necessary not only to combine multiple bacteriological tools but also adapt the most adequate set of techniques based on the regional prevalence of specific STEC that affect human health in order to maximize the use of the available tools for the detection and isolation of STEC strains.
Footnotes
Acknowledgments
We thank Dr. Kent J. Schwartz (Iowa State University, Veterinary Diagnostic Laboratory) for his critical revisions of this article. This research was supported by a grant from Consejo Nacional de Investigaciones Científicas y Técnicas Proyectos de Investigación Plurianuales (2010–2012) No. 0266. The authors acknowledge the serotyping conducted by Marcelo Sanz (Centro de Investigación Veterinaria Tandil – Centro de Investigación Veterinaria Tandil (CIVETAN), Consejo Nacional de Investigaciones Científicas y Técnicas (CONICET), Comisión de Investigaciones Científicas de la provincia de Buenos Aires (CICPBA), Facultad Ciencias Veterinarias, Universidad Nacional del Centro de la Provincia de Buenos Aires (UNCPBA)). We also thank A. Di Maggio for editing the manuscript.
Disclosure Statement
No competing financial interests exist.