
Abstract
This study systemically analyzed data on the prevalence of foodborne pathogens and foodborne disease outbreaks to identify the priorities of foodborne infection risk management in Korea. Multiple correspondence analysis was applied to three variables: origin of food source, phase of food supply chain, and 12 pathogens using 358 cases from 76 original papers and official reports published in 1998–2012. In addition, correspondence analysis of two variables—place and pathogen—was conducted based on epidemiological data of 2357 foodborne outbreaks in 2002–2011 provided by the Korean Ministry of Food and Drug Safety. The results of this study revealed three distinct areas of food monitoring: (1) livestock-derived raw food contaminated with Campylobacter spp., pathogenic Escherichia coli, Salmonella spp., and Listeria monocytogenes; (2) multi-ingredient and ready-to-eat food related to Staphylococcus aureus; and (3) water associated with norovirus. Our findings emphasize the need to track the sources and contamination pathways of foodborne pathogens for more effective risk management.
Introduction
F
Epidemiological data are useful for investigating foodborne infection outbreaks and specific food-associated pathogens. The Korean Ministry of Food and Drug Safety (MFDS, 2012a) has launched a public website, which provides free access to the epidemiological data on outbreaks (place, time, and causative pathogen), starting from 2002. This information helps analyze foodborne illnesses and reveal the problems underlying foodborne outbreaks in Korea.
Systemic analysis is using massive datasets to search, collect, and analyze valuable data from individual studies (EFSA, 2010). In a previous study, a systemic approach was applied to the global data on foodborne disease outbreaks for food source attribution by multiple correspondence analysis (MCA) (Greig and Ravel, 2009).
The aim of this study was to overview food contamination monitoring trends in Korea by checking the availability of information on pathogen prevalence and analyzing the recent monitoring data on microbial contamination in the food supply chain using MCA. In addition, the epidemiological data on foodborne infection outbreaks were evaluated by correspondence analysis (CA), which should present a broader perspective for future directions to control foodborne infection outbreaks in Korea. This integrative approach would identify the priorities of foodborne infection risk management in Korea and problematic areas requiring further monitoring, and promote the development of additional measures to improve the food contamination monitoring system.
Materials and Methods
Scope definition
The aim of this study was to analyze the recent data on food contamination monitoring available in Korea and to identify the pathogens of immediate concern. The data were extracted from the journal articles published during the last 15 years. This systemic analysis consisted of the following steps. First, the prevalence of foodborne pathogens in Korea from 1998 to 2012 was assessed. The next steps involved screening of the existing primary research reports and subsequent selection based on expert reviews, followed by data extraction and presentation in the evidence table, data synthesis using statistical tools, description of the results, and drawing the conclusions.
The scope of this study included any reports on the prevalence of foodborne microbial pathogens included in the MFDS foodborne outbreak statistics (MFDS, 2012a) and found in the foodstuff produced, processed, distributed, and consumed in Korea based on the data published in 1998–2012.
Screening of primary studies
We scanned the studies published between 1998 and 2012 in Korean and English. Peer-reviewed research papers and other publications on the prevalence of foodborne pathogens in Korea were screened using the eArticle (2012) and DBpia (2012) search engine. The following keywords were used: “pathogen,” “foodborne,” “food,” “Korea,” “prevalence,” “contamination,” “Bacillus cereus,” “Campylobacter jejuni,” “Campylobacter coli,” “Clostridium botulinum,” “Clostridium perfringens,” “Enterobacter sakazakii,” “pathogenic (enteroaggregative, enterohemorrhagic, enteroinvasive, enteropathogenic, enterotoxigenic) Escherichia coli,” “E. coli O157:H7,” “STEC,” “VTEC,” “Listeria monocytogenes,” “norovirus,” “Salmonella,” “Staphylococcus aureus,” “Vibrio parahaemolyticus,” and “Yersinia.” For international articles, ScienceDirect, Scopus, Taylor & Francis, and Ingentaconnect resources were used, and the data were selected by the application of each search term together with “Korea.” The official reports of the public institutions (QIA, 2012; KFRI, 2012; MFDS, 2012b; National Fisheries Research & Development Institute, 2012; Busan IHE, 2012; Daegu IHE, 2012; Gangwondo IHE, 2012; Gwangju IHE, 2012; Gyeonggido IHE, 2012; Inchon IHE, 2012; Seoul IHE, 2012) were also searched. Systemic analysis was conducted according to PRISMA guidelines (PRISMA, 2009).
Article selection criteria
The screened articles were examined by two reviewers to exclude any overlapping reports and to find the earliest relevant study on the subject. The appropriate articles were selected based on the title, abstract, and data tables. The exclusion criteria were as follows: studies on less than 20 analyzed samples (to provide minimum statistical significance), and studies presenting the prevalence of isolated strains, but not food sample numbers.
Data extraction and food classification
To analyze the prevalence of individual foodborne pathogens in specific food products, the latter were further categorized by the origin of food source (i.e., fresh water, plant products, marine products, livestock products, and multi-ingredient foods, and the phase of the food supply chain, i.e., raw, processed, and ready-to-eat food) (Table 1). Dried raw materials such as crops and seafood were classified as raw. The products that were powdered, heat-treated, frozen, or subjected to infection-preventive measures (e.g., washing) were classified as processed. Ready-to-eat food was defined as those not requiring processing or cooking before consumption.
Data management and knowledge synthesis
The extracted data were classified according to the pathogen, food sample, food source, phase of the food supply chain, sample number, and publication year, using the Microsoft Excel 2007 program. In this study, a total of 358 cases (pathogen, food source, the phase of food chain) of food contamination monitoring were used for analysis.
Data synthesis and statistical analysis
To analyze the relationship among more than three variables, we employed the MCA statistical method, which is a useful tool to assess the distances between qualitative categorical variables as points in low-dimensional space (Greig and Ravel, 2009). An Excel sheet was created and the data were analyzed by conducting MCA to visually observe the relationships between three categorical variables: food pathogen prevalence, origin of food source, and the phase of food supply chain. Statistical analysis was performed using the XLStat™ 2011 software (Addinsoft, Paris, France) and Excel Add-ins (Microsoft, Redmond, WA).
Epidemiological data analysis
MFDS (2012a) categorized places of foodborne infection outbreaks caused by different pathogens. Outbreaks rather than patient numbers were used to identify the main cause of food poisoning outbreaks to avoid overestimation of infection spreading in one outbreak, because the catering service and restaurants (i.e., the places of mass food production and consumption) are mostly responsible for pathogen dissemination. In this study, CA was conducted on two variables, pathogen and place of outbreak using the XLStat™ 2011 software.
To compare foodborne pathogen prevalence and infection outbreaks, we calculated the mean values and 95% confidence intervals (CIs) for each foodborne pathogen based on the foodborne pathogen prevalence data and epidemiological data using Excel 2007 (Microsoft).
Results and Discussion
Screening and selection of primary studies
The number of articles initially obtained by keyword search was 18,495 using eArticle and DBpia databases; 4886 using ScienceDirect, Scopus, and Taylor & Francis; and 161 using Ingentaconnect; overlapping papers were excluded. The total number of official reports was 16 after expert review. Finally, the articles reporting foodborne pathogen prevalence and satisfying the inclusion criteria of this study were selected (n = 76) and used for the following analysis.
Frequency of food contamination monitoring
The data extracted from 76 selected articles produced 358 cases (based on the pairwise combination of pathogen, food source, and food chain) (Table 1). The number of samples per case varied from 20 to 2841 (data not shown). Among food source categories, livestock and plant products yielded 182 (50.8%) and 96 (26.8%) cases, respectively. Among food supply phase categories, raw foodstuff was associated with 261 (72.9%) cases, which was higher than the number of cases related to processed (40; 11.2%) or ready-to-eat (57; 15.9%) food. The distribution of foodborne pathogens was the following: S. aureus, 69 (19.3%); L. monocytogenes, 52 (14.5%); B. cereus, 44 (12.3%); pathogenic E. coli, 40 (11.2%); C. perfringens, 34 (9.5%); C. jejuni/coli, 34 (9.5%); and Salmonella spp., 25 (7%) cases (Table 1).
In Korea, Salmonella enterica serovars such as Salmonella Enteritidis and Salmonella Typhimurium are the main cause of foodborne outbreaks (Kang et al., 2013). Some food contamination monitoring research in Korea has been conducted with the objective to establish food standards, as was the case for B. cereus in soy sauce/paste, sauce, composite seasonings, etc., which might be attributed to high numbers of these bacteria, observed in specific monitoring studies (MFDS, 2009). In Korea, E. coli O157:H7 monitoring in raw materials increased according to Food Standards requirement in meat products in 1998 and fresh-cut produce in 2010 (MFDS, 2015).
Such parameters as food source and processing phase can affect product contamination with the pathogen. Because Vibrio spp. were detected in seawater in warmer months (Lee et al., 2008), some raw marine products were found positive for V. parahaemolyticus. Drying is a frequently used conventional method for food preservation (Legnani et al., 2004); however, open-air drying leaves soil bacteria such as Bacillus spp. and Clostridium spp., which can contaminate the final product; in fact, most dried foods, regardless of the source, tested positive for B. cereus and C. perfringens (data not shown). It has been shown that once meat products are frozen, psychrophilic pathogens such as L. monocytogenes can survive for a long time, causing severe illness (Rocourt et al., 2000; Burnett et al., 2005). A high portion of ready-to-eat cooked products were positive for S. aureus, known to colonize human skin and mucosa (Wertheim et al., 2005), indicating that food handlers need to take special precautions during food preparation (Acco et al., 2003).
MCA of categorical variables in food contamination monitoring
To qualitatively analyze and visually observe the relationship among categorical variables, we constructed a two-dimensional (2-D) map (Fig. 1). The size of bubbles drawn by the XLStat™ software indicates the frequency of the conducted food contamination monitoring, and categorical distances in the region indicate relative differences in dimensions 1 and 2, which contributed 58.01% and 12.41%, respectively. The percentage on the map is the adjusted inertia.

A two-dimensional map plot based on multiple correspondence analysis of food contamination monitoring data in Korea, including the information on foodborne pathogens, food source, and processing phase collected from the articles published in 1998–2012. The relative position of the region in the map represents foodborne pathogens (circles), food source (triangles), and the phase of food supply chain (squares). Symbol size is proportional to the number of cases.
These results show that raw livestock products were monitored frequently for pathogenic E. coli (including E. coli O157:H7) and Campylobacter spp., whereas marine products were monitored as raw food for V. parahaemolyticus. S. aureus contamination monitoring was frequently conducted for multi-ingredient ready-to-eat food. The location of norovirus was close to a fresh water source in the 2-D map.
Trends in foodborne outbreaks
The major pathogens causing food poisoning outbreaks in Korea from 2002 to 2011 were categorized as unidentified pathogens (921 cases), norovirus (344 cases), pathogenic E. coli (277 cases), Salmonella spp. (240 cases), V. parahaemolyticus (185 cases), and S. aureus (174 cases) (Table 2). The patterns of pathogen infection varied depending on the place. Most of the foodborne outbreaks occurred through mass food distribution (1705 outbreaks, 72.3%): in restaurants (1116; 47.3%) and through food catering (589; 25.0%). Among the total of 75,275 patients, 45,378 (60.3%) were infected through catered food and 16,522 (21.9%) in restaurants (MFDS, 2012a).
In food catering service including educational and industrial establishments, the most frequent pathogen was norovirus (145 outbreaks), followed by pathogenic E. coli (129 outbreaks). In the restaurants, the most frequent foodborne pathogen was Salmonella spp. (136 outbreaks), followed by V. parahaemolyticus (116 outbreaks). Homemade food was responsible for food poisoning mainly because of Salmonella spp. (31 outbreaks).
CA of epidemiological data on pathogens and places of foodborne infection outbreaks
CA of the relationship between foodborne pathogens and places of infection is shown in Figure 2. The position of the points generated by the XLStat™ software indicates relative differences in both dimension 1 and 2, which contributed to 67.66% and 25.87%, respectively. Foodborne outbreaks caused by Campylobacter spp., pathogenic E. coli, norovirus, and C. perfringens occurred more in food catering, whereas those caused by V. parahaemolyticus and Salmonella spp. mostly happened in restaurants and those caused by chemicals, natural toxins, and C. botulinum occurred at home. Moreover, the data indicate that it was difficult to identify the pathogens responsible for restaurant-acquired infections, which can be attributed to late notification by the affected patients resulting in difficulty in collecting and analyzing the contaminated restaurant products (Lee et al., 2012).
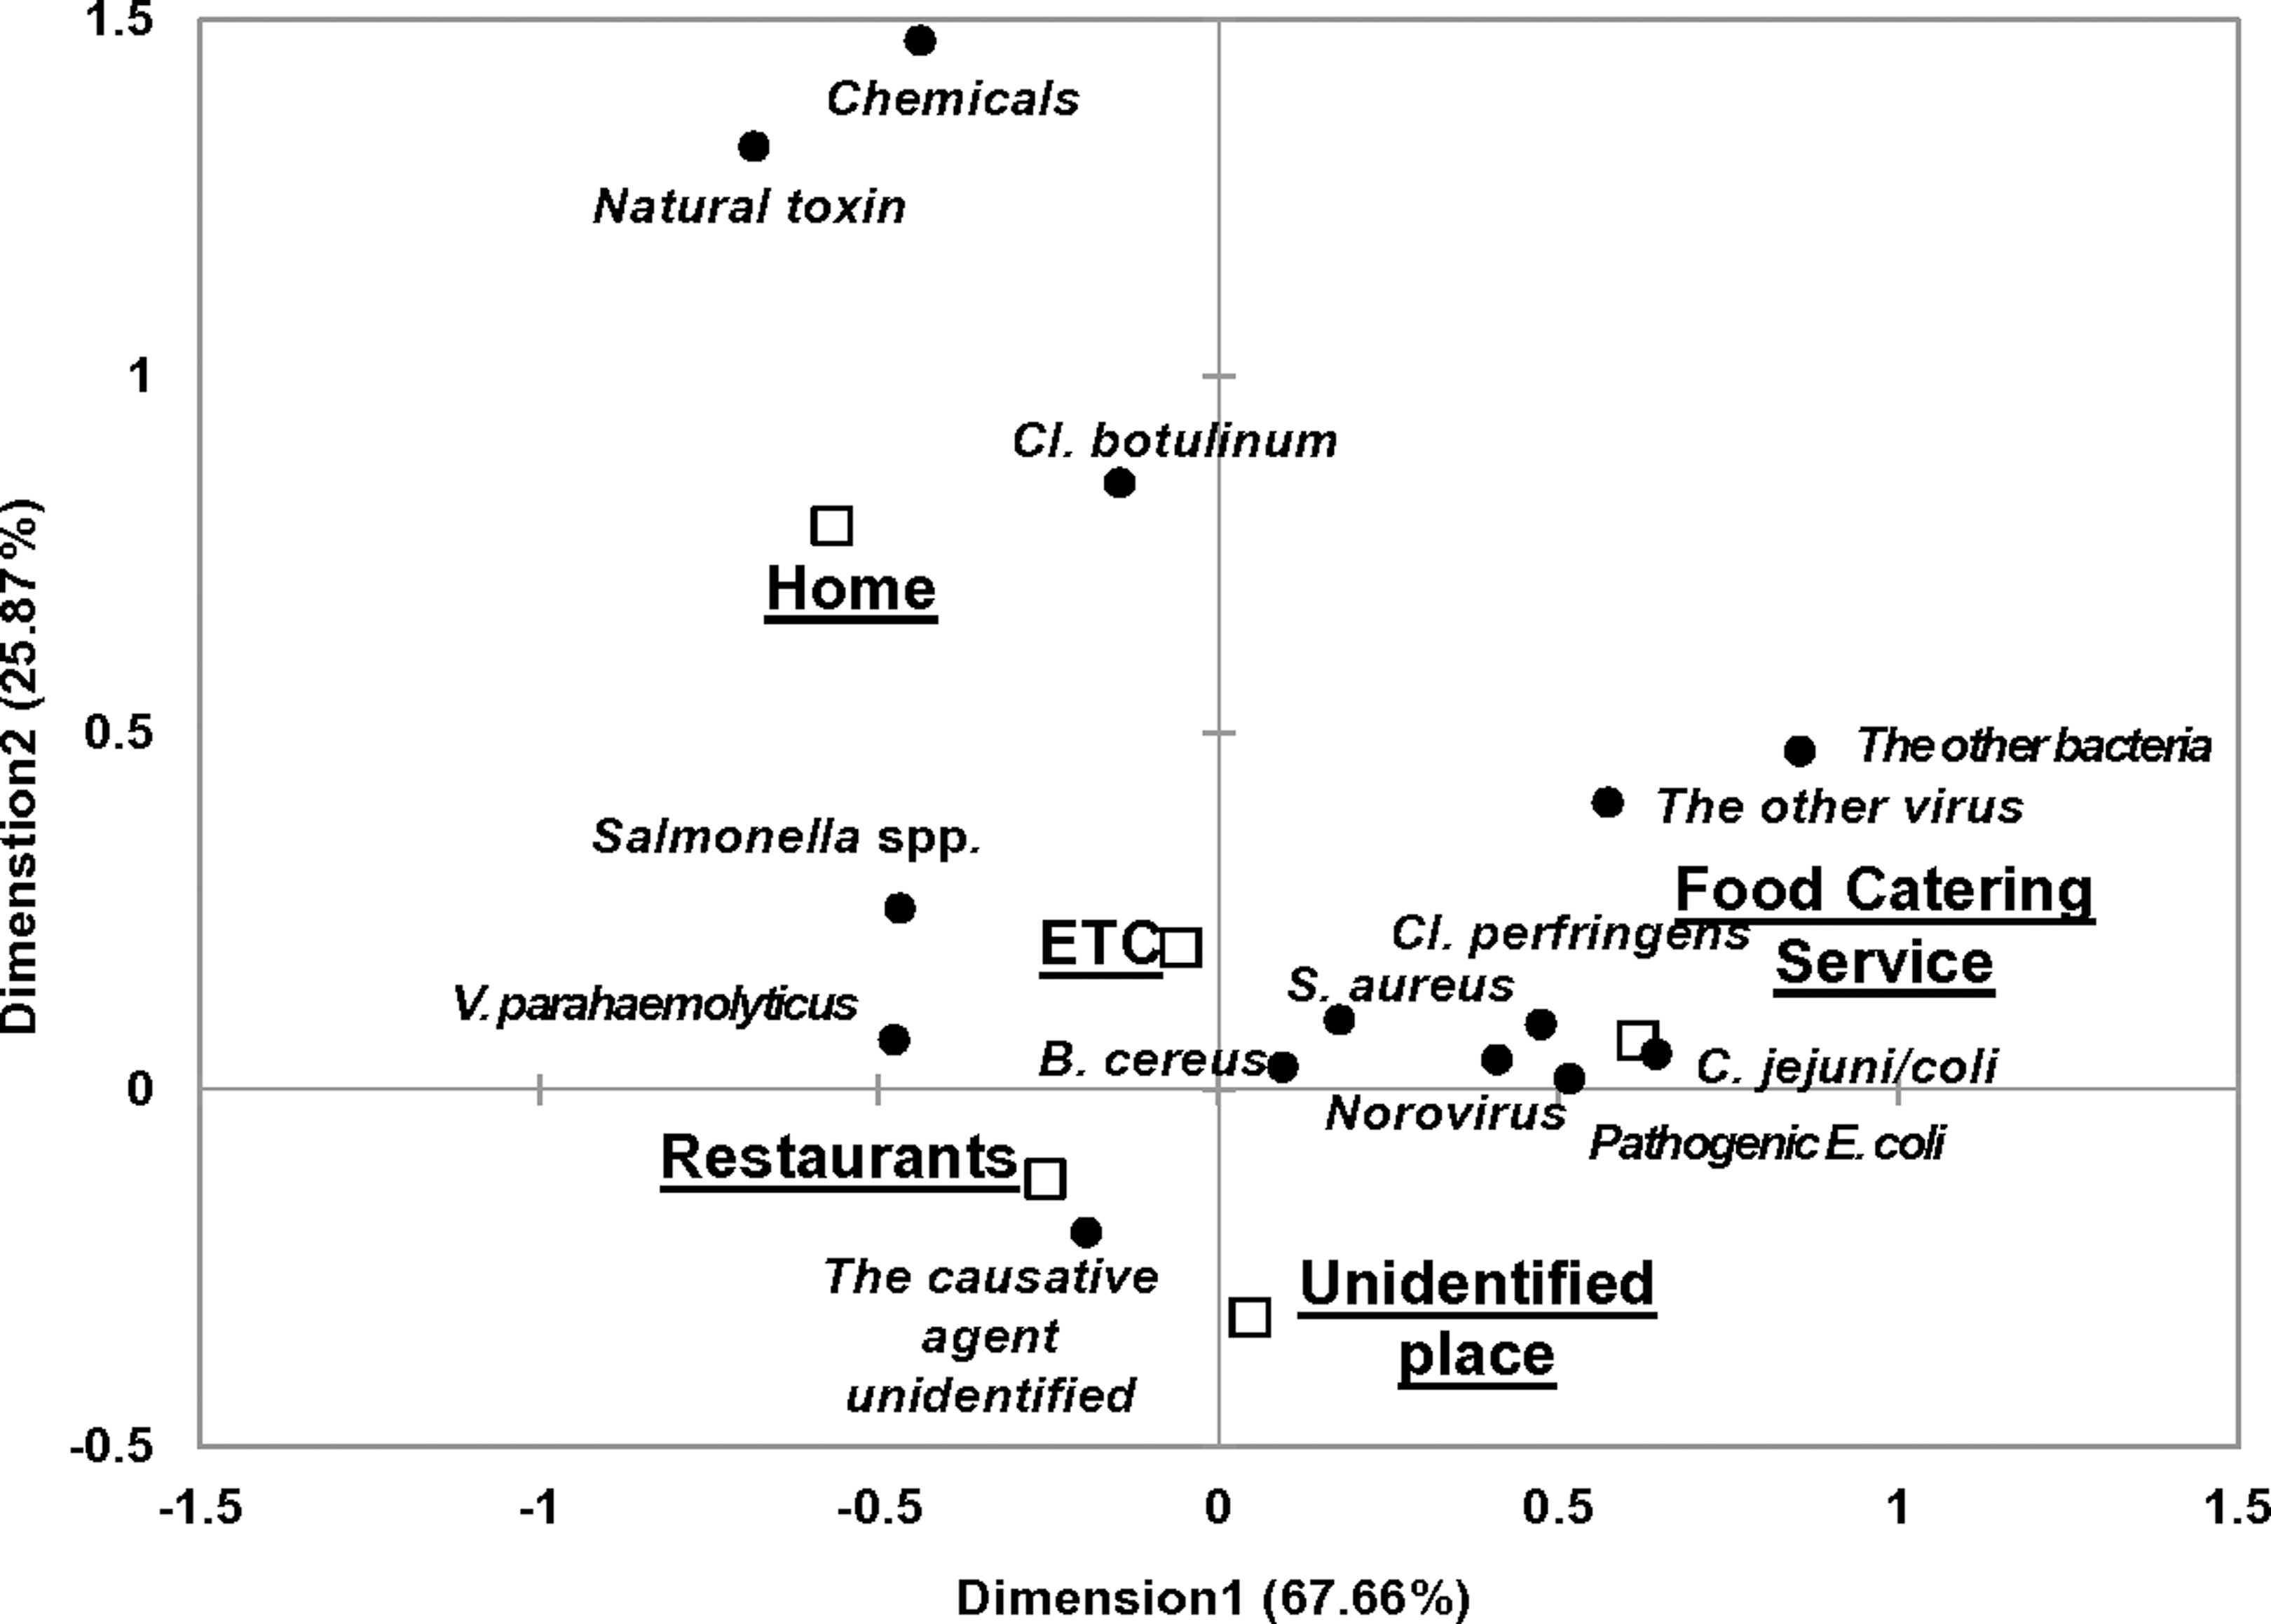
A two-dimensional map plot based on correspondence analysis of epidemiological data on foodborne pathogens and places of foodborne disease outbreaks in 2002–2011 in Korea extracted from the Ministry of Food and Drug Safety site. The relative position of the region in the map represents foodborne pathogens (circles) and places of foodborne outbreaks (squares).
Comparison of food contamination monitoring and epidemiological data
We compared the proportions of foodborne pathogens between the food monitoring (1998–2012) and epidemiological (2002–2011) datasets (Table 3). Although norovirus and Salmonella spp. showed the highest prevalence among foodborne disease outbreaks, food contamination monitoring in Korea was concentrated on S. aureus, L. monocytogenes, and B. cereus. In addition, relatively high numbers of pathogenic E. coli–caused outbreaks should be further examined. The comparison between food contamination monitoring and epidemiological data as well as the high incidence of outbreaks identified norovirus and pathogenic E. coli as the priority of risk management in food catering in Korea. Norovirus was located close to water, marine, and plant sources in the map (Fig. 1); therefore, water and marine and plant products should be more carefully examined in foodborne outbreaks. In the statistics of Korea Centers for Disease Control Prevention (KCDC), the identified food related to norovirus outbreaks in 2011 and 2012 were water, seafood, and raw vegetables (KCDC, 2013).
Total pathogenic Escherichia coli, including O157:H7.
Since pathogenic E. coli was located close to livestock and raw products in the map (Fig. 1), meat and fresh vegetables need to be examined and sampling should be performed more regularly by trained investigators to identify the infectious agent and contaminated food.
According to the mapping results (Figs. 1 and 2), V. parahaemolyticus in marine products and Salmonella spp. in livestock products require careful food contamination monitoring to reduce foodborne disease outbreaks in restaurants. Particularly, a high number of the causative agent unidentified (39.1%) in restaurants and homemade food emphasizes that additional efforts should be made to identify the etiological agents and reduce the number of related outbreaks.
Conclusions
Food contamination monitoring reveals the trends among the emerging foodborne pathogens, and the information is then used in the food industry and national programs to control foodborne infections. Based on the results of this study, we can make some suggestions for improving the existing food monitoring system. First, food (including environment)-monitoring data should be collected in the major steps in the food supply chains in order to provide scientific evidence for decision-making and implementation of intervention measures, such as further processing (e.g., thermal or nonthermal treatment).
Second, a national food monitoring strategy for more efficient risk assessment should include the creation and analysis of the database, which would integrate the available microbiological and epidemiological data on foodborne infection outbreaks with the aim to prevent unnecessary repetition and cover the whole food processing chain from farm to table. The availability of open-access data can contribute to time and social cost reduction before any policy decision.
In addition, more data on personal and environmental hygiene and food-handling behavior should be collected and included in further systemic analysis, which would also help to develop an effective education and training program for food handlers.
Footnotes
Acknowledgments
This work was supported by the research grants from Korea Food Research Institute.
Disclosure Statement
No competing financial interests exist.