
Abstract
In this retrospective study, typing ability, discriminatory power, and concordance between typing results obtained on 123 Campylobacter jejuni turkey isolates, collected in 1998, within 14 different farms, applying multilocus sequence typing (MLST), pulsed-field gel electrophoresis (PFGE), antibiotic resistance profile, and virulence gene pattern, were assessed and compared. Overall, 33 sequence types, 28 pulsotypes, 10 resistotypes, and 5 pathotypes were identified. MLST and PFGE showed the better discriminatory ability (i.e., Simpson's diversity index >0.90) as well as unidirectional (i.e., Wallace and adjusted Wallace coefficients >0.86) and bidirectional (i.e., adjusted Rand coefficient >0.60) concordance. Moreover, both methods showed a good unidirectional and bidirectional concordance with the resistotype. On the contrary, the congruence of both genotyping methods and resistotype with the pathotype seemed due to chance alone. A clonal relationship was identified among 66.7% of the isolates. Furthermore, 59.7% of the investigated isolates were resistant to two or more antimicrobials and 92% to tetracycline. All the isolates harbored cadF and pldA genes, whereas a flaA gene product and a cdtB gene product were amplified from 85.4% and 79.7% of the isolates, respectively, using the primers designed by Bang et al. (2003). The results of this study clarify the level of genetic diversity among the C. jejuni originating from turkeys. MLST level of correlation with PFGE, resistotype, and pathotype is assessed. This result supports the selection of type and number of typing methods to use in epidemiological studies. Finally, the identification of clonal complexes (i.e., groups of profiles differing by no more than one gene from at least one other profile of the group using the entire Campylobacter MLST database) shared between turkey and human isolates suggests that turkeys could be a possible source of Campylobacter infection.
Introduction
I
Beside molecular methods, different isolates can be characterized according to their antibiotic resistance profile and pattern in virulence genes. The pathogenesis of Campylobacter infection is not fully elucidated, although flagella-mediated motility, adhesion to intestinal mucosa, and invasion and production of cytotoxin have been identified as virulence determinants (Konkel et al., 1997; Wassenaar, 1997; Datta et al., 2003). Therefore, four genes, each one responsible for one virulence factor, were investigated in this study; flaA, responsible for motility; cadF, for adhesion; pldA, for invasion; and cdtB, for toxin production.
When different typing methods are applied to a set of isolates, they should be compared to verify possible correlations in terms of results obtained in order to avoid duplications in terms of epidemiological information. Carrico et al. (2006) proposed the use of the adjusted Rand coefficient (AR) as a measure for the quantitative assessment of bidirectional correspondence between typing methods, taking into account that agreement may arise by chance alone. Severiano et al. (2011) proposed the adjusted Wallace (AW) and corresponding confidence intervals (CI) as quantitative measures of unidirectional congruence between typing methods.
Since (1) the majority of the available knowledge on typing results concerns broiler isolates, (2) more than one isolate was typed from each farm and animal, and (3) few publications are available on quantitative assessment of the concordance between typing results applied to the same set of isolates, in this research, typing ability, discriminatory power, and concordance between typing results collected on C. jejuni turkey isolates applying MLST, PFGE, antibiotic resistance profile, and virulence gene patterns were assessed and compared.
Materials and Methods
Sampling scheme
In March 1998, a total of 196 turkey ceca were collected in 2 slaughterhouses that gathered turkeys coming from 14 different farms located in Emilia-Romagna and Veneto regions (northern Italy). At the slaughterhouse, from each farm, 14 animals, belonging to the same group, were randomly selected from the line. Within 5 h after sampling, approximately 5 g of individual cecal contents were diluted 1:1 into saline solution (0.154 M NaCl), homogenized by vortex mixer, and diluted further 1:10 and 1:100 in the same solution. Ten microliters of these last two dilutions were then streaked onto two plates of Campylobacter Blood-Free Selective Agar (CCDA; Oxoid, Hampshire, UK). The plates were incubated at 37 ± 1°C under microaerobic atmosphere with hydrogen (Bolton et al., 1992) and after 48 h of incubation were checked daily up to 5 days for colonies. From each plate, four colonies of Gram-negative spiral-shaped bacteria that looked like Campylobacter spp. were subcultivated, cloned, submitted to a Campylobacter genus-specific polymerase chain reaction (PCR) (Linton et al., 1996), and stored at −80 ± 3°C for further typing. In 2014, with the beginning of this retrospective study, the isolates were thawed and submitted to a C. jejuni–C. coli-specific multiplex PCR (Denis et al., 1999). Among the C. jejuni isolates, one or more isolates for each animal were selected based on the colony morphological appearance. Overall, 123 C. jejuni isolates were submitted for further investigations.
MLST
The DNA of the C. jejuni isolates was purified using the Chelex® 100 procedure (Biorad, Milan, Italy) and characterized by MLST as previously described (Dingle et al., 2001). Allele numbers, sequence types (STs), and clonal complexes (CCs) were assigned using the PubMLST database (
PFGE
The C. jejuni isolates were typed using PFGE with the use of SmaI (Zhou et al., 2011). Band patterns were analyzed with BioNumerics 7.5 software (Applied Maths, Keistraat, Belgium). DNA patterns were compared using the Dice coefficient and the unweighted-pair group method with arithmetic averages, with a 1.0% tolerance limit and 1.0% optimization. Isolates showing a PFGE pattern similarity level of 90% were grouped in the same “PFGE cluster.” The PFGE patterns were classified as pulsotypes.
Antimicrobial susceptibility testing
The resistotype (R-type) was obtained using the E-test method (AB BioMerieux, Solna, Sweden). Mueller-Hinton Agar II (Becton Dickinson, Franklin Lakes, NJ) containing 5% defibrinated sheep blood was used as medium. The antimicrobial agents tested were ciprofloxacin (CIP), enrofloxacin (EN), gentamicin (G), tetracycline (T), chloramphenicol (C), nalidixic acid (NA), ampicillin (AM), and erythromycin (ER). The plates were incubated at 37 ± 1°C under microaerobic atmosphere for 48 h. C. jejuni ATCC 33560, Staphylococcus aureus ATCC 29213 and Escherichia coli ATCC 25922 were used as control strains. NARMS (2012) cutoff values were used for all the antibiotics tested, except for enrofloxacin and ampicillin, for which the Clinical and Laboratory Standards Institute 2008 (CLSI, 2008) cutoff values for Enterobacteriaceae and Campylobacter were used, respectively. The following resistance breakpoints (μg/mL) were considered: ciprofloxacin ≥1, enrofloxacin ≥4, gentamicin ≥4, tetracycline ≥2, chloramphenicol ≥32, nalidixic acid ≥32, ampicillin ≥32, and erythromycin ≥8. The identified R-types were labeled using different numbers.
Detection of virulence genes
The DNA of the C. jejuni isolates was amplified by PCR to detect the presence of toxin and virulence genes (cdtB, cadF, flaA, and pldA), using primers VAT2–WMI-R (5′-GTTAAAATCCCCTGCTATCAACCA-3′; 5′GTTGGCACTTGGAATTTGCAAGGC3′), F2B-R1B (5′-TGGAGGGTAATTTAGATATG-3′; 5′-CTAATACCTAAAGTTGAAAC-3′), flaA-F-flaA-R (5′-GGATTTCGTATTAACACAAATGGTGC3′; 5′-CTGTAGTAATCTTAAAACATTTTG-3′) (Bang et al., 2003), pldA-84-Pld-981 (5′-AAGCTTATGCGTTTTT-3′; 5′ TATAAGGCTTTCTCCA3′) (Datta et al., 2003), respectively. C. jejuni ATCC 33560 was used as positive control and sterile water as negative control. Each pathotype was labeled as P-type.
Calculation of discriminatory power and congruence among typing methods
The discriminatory indexes (DI) of MLST, PFGE, R-type, and pathotype were calculated using the Simpson's diversity index described by Hunter and Gaston (1988). The Wallace's coefficient (W), the AW coefficient, and the AR coefficient, along with the respective CIs, were all calculated using the Comparing Partitions website (
Results
MLST
All 123 isolates were successfully typed by MLST. Five new alleles were discovered in this study. Overall, the isolates were classified in 33 STs: 11 were unique STs, identified in single isolates, whereas 22 were shared between 2 and 15 isolates. The majority of the common STs (i.e., 59.1%) were shared between isolates collected from turkeys reared in the same farm. The remaining STs were shared between isolates collected from animals housed in different farms, located in the same (i.e., 31.8%) or different regions (i.e., 9.1%). In 71.4% of the tested farms, the isolates were characterized by two to four different STs. The most spread ST was ST879, identified among isolates collected in three different farms, followed by STs 50, 227, 3334, 1880, 3476, and 7496 associated with isolates from two different farms. All the remaining STs were identified among isolates coming from a single farm.
PFGE
All 123 isolates were typed by PFGE. Overall, 28 pulsotypes were associated with the isolates genotyped; 13 were unique pulsotypes, identified in single isolates, whereas 15 were shared between 2 and 26 isolates. The majority of the common pulsotypes (i.e., 53.3%) were shared between isolates collected from turkeys reared in the same farm. The remaining pulsotypes were shared between isolates collected from animals housed in different farms, located in the same (i.e., 20%) or different regions (i.e., 26.7%). In 57.1% of the tested farms, the isolates were characterized by two to four different pulsotypes. The most spread pulsotypes were those labeled as 1 and 30, identified among isolates collected in five different farms, followed by pulsotype 11, associated with isolates from three farms, and pulsotypes 3, 14, 15, and 28, associated with isolates from two different farms. All the remaining pulsotypes were identified among isolates coming from a single farm.
Resistotype (R-type)
The distribution of the minimum inhibitory concentration values of the 123 isolates tested is shown in Table 1. All 123 isolates of C. jejuni were sensitive to gentamicin and chloramphenicol, whereas four isolates were sensitive to all antimicrobials tested. Furthermore, 92% of the tested isolates were resistant to tetracycline, 55% to nalidixic acid, 52% to enrofloxacin and ciprofloxacin, and 13% to ampicillin. Finally, one isolate was resistant to erythromycin. Overall, according to the resistance to the tested antimicrobials, 10 different R-types were identified and labeled with numbers. The R-type 1 (T) was found in 35% of the isolates; R-type 2 (CIP-EN-T-NA) in 43%; R-type 3 (CIP-EN-NA) in 2%; R-type 4 (AM) in 2%; R-type 5 (T-NA) in 3%; R-type 6 (T-AM) in 4%; R-type 8 (CIP-EN-T-NA-AM) in 6%; R-types 7 (CIP-EN-T-NA-ER), and 9 (CIP-EN-NA-AM) in 1% of the isolates, respectively; R-type 11 (S), referred to C. jejuni susceptible to all antibiotics tested, in 3% of the isolates.
Resistant isolates are represented in bold.
Pathotype (P-type)
All 123 C. jejuni isolates harbored the cadF gene responsible for adherence. The presence of pldA gene, responsible for invasion, was highlighted in all isolates, while the flaA gene, involved in isolate motility, was determined in 105 isolates (85.4%). As regards the cdtB gene, associated with toxin production, it was present in 98 (79.7%) C. jejuni isolates. Overall, five different P-types, labeled as numbers, were identified according to the pathotype (Fig. 1). The P-type 10 (cadF–flaA–pldA–cdtB) was identified in 68% of the isolates, followed by P-types 4 (cadF–flaA–pldA) (16%) and 5 (cdtB–cadF–pldA) (11%). The two remaining P-types, 7 (cadF–pldA) and 3 (cadF– flaA) were identified in four and two isolates, respectively.
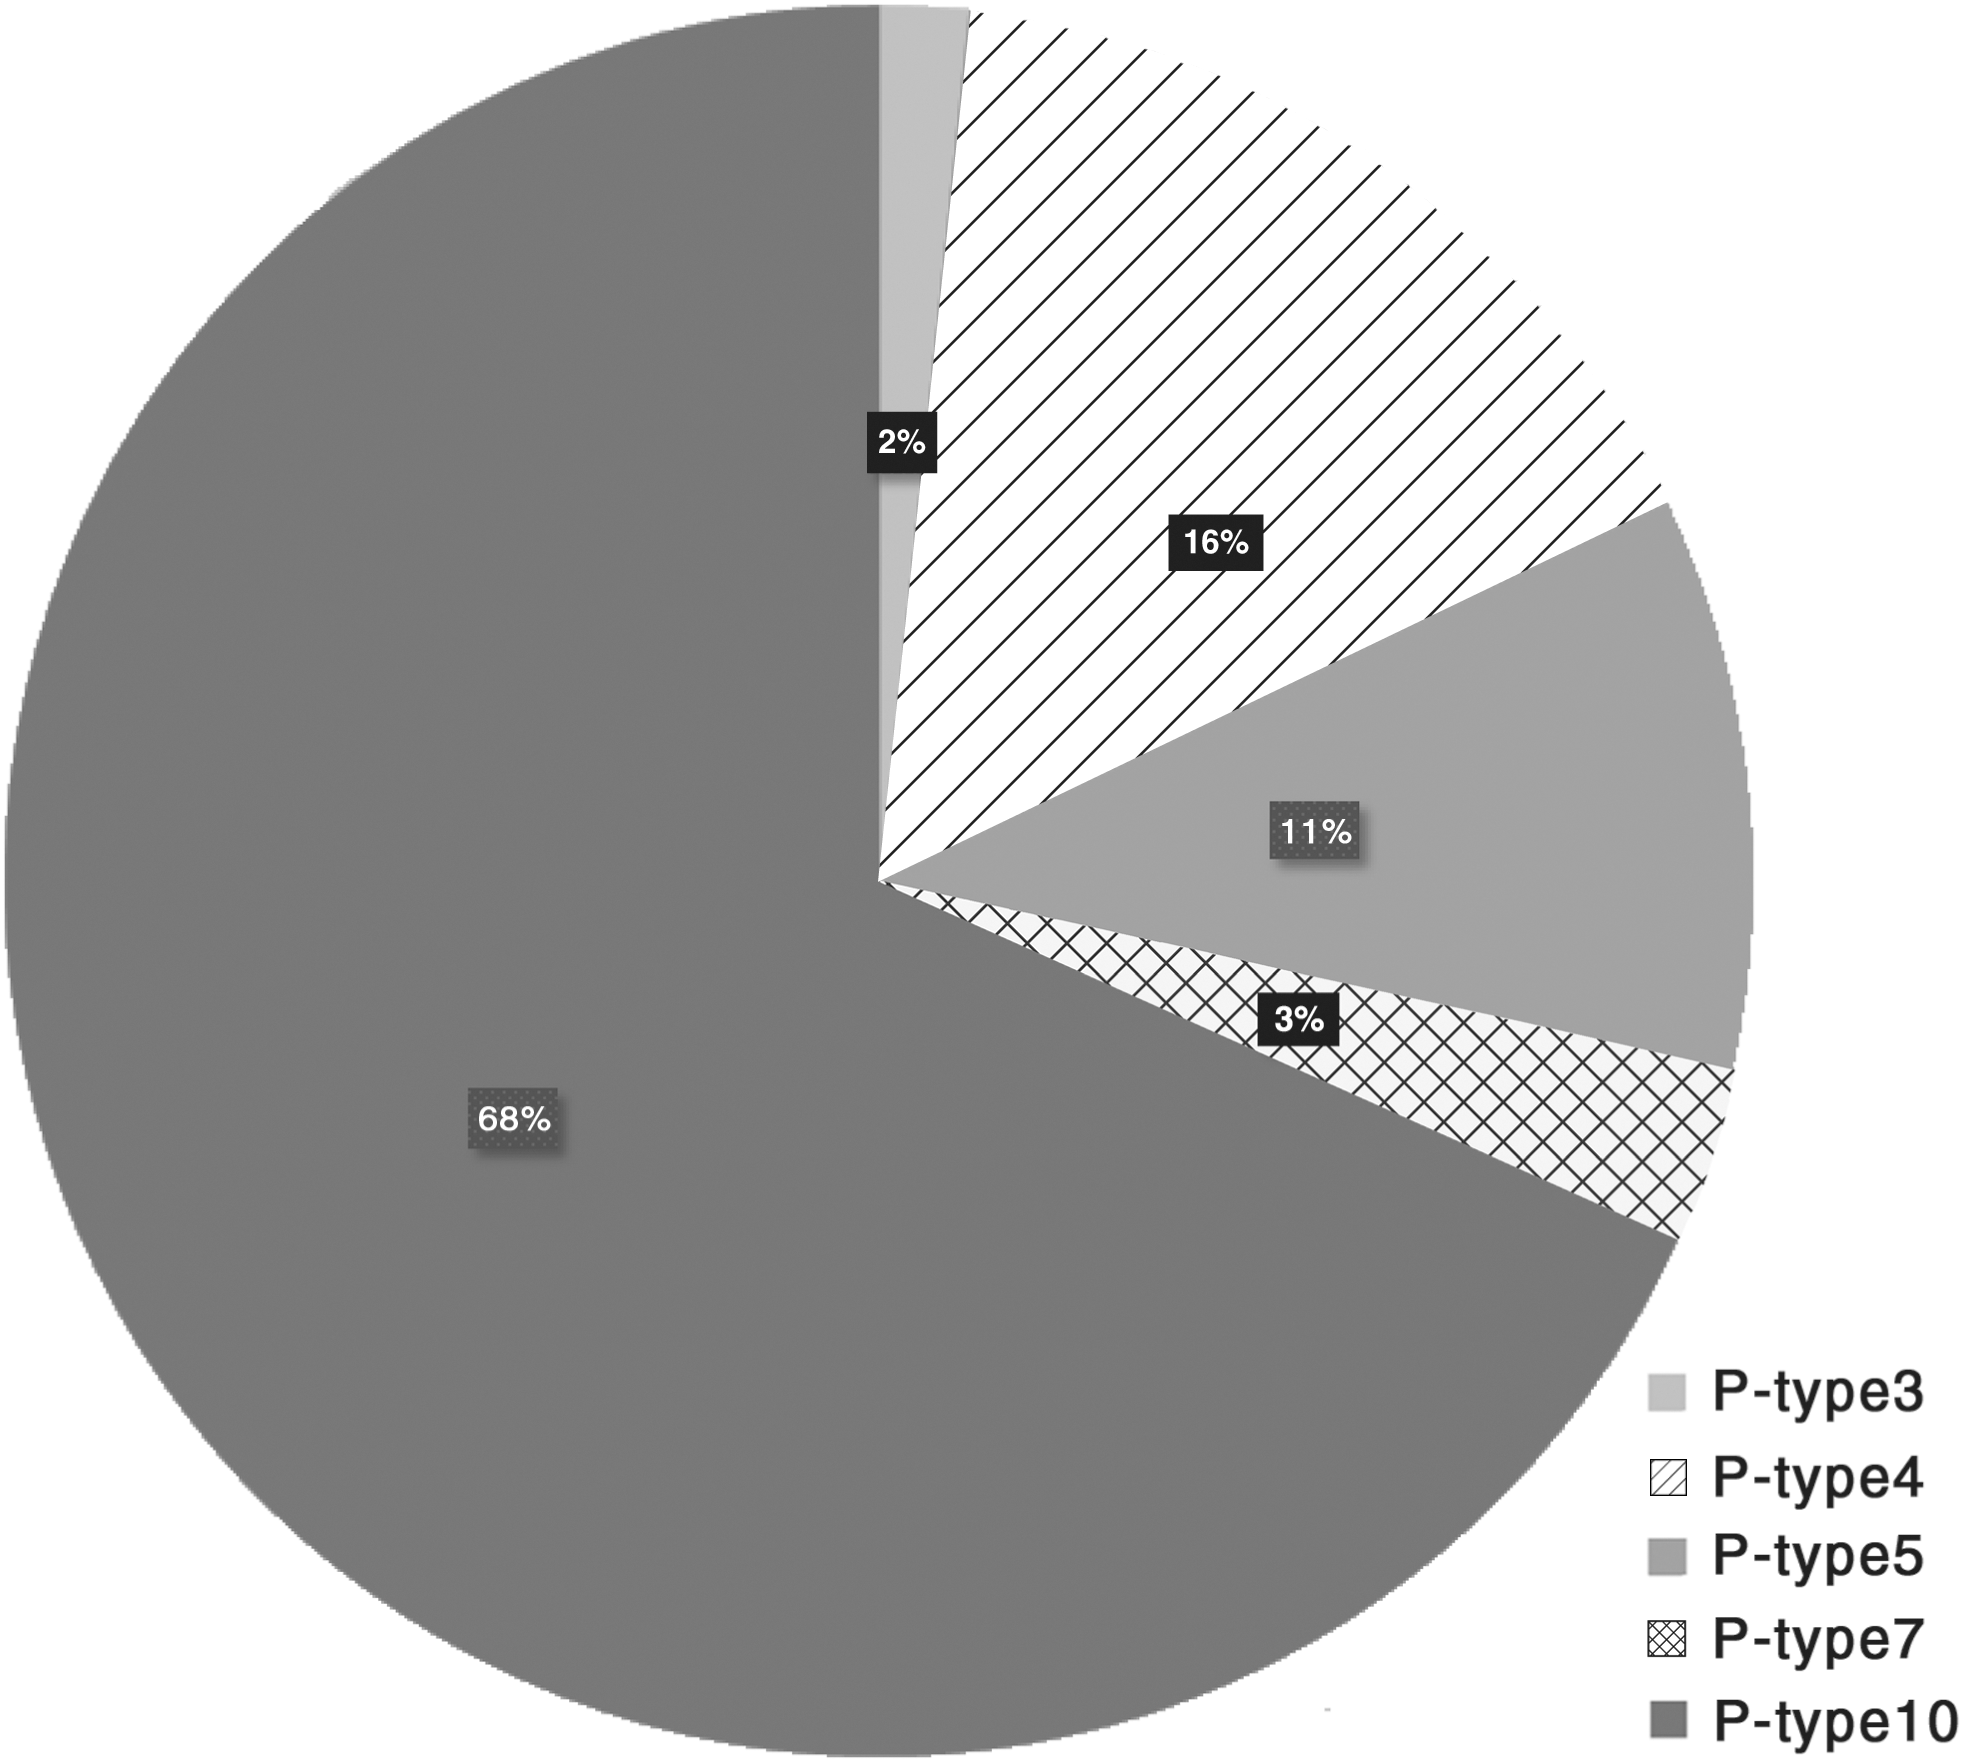
Distribution of the identified pathotypes (P-type) as determined according to the presence of toxin and virulence genes (i.e., cdtB, cadF, flaA, and pldA). P-type 3 (cadF–flaA); P-type 4 (cadF–flaA–pldA); P-type 5 (cdtB–cadF–pldA); P-type 7 (cadF–pldA); P-type 10 (cadF–flaA–pldA–cdtB).
Isolate discrimination
The DI of the applied typing methods ranged between 0.946 for MLST and 0.499 for P-type (Table 2). Both MLST and PFGE showed a DI higher than 0.90. Therefore, they both show a probability to discriminate C. jejuni isolates different from a genetic point of view higher than 90%. The DIs calculated for each different typing method were significantly different (p < 0.001).
Different superscript letters indicate DI values that are significantly different (p < 0.001).
CI, confidence interval; MLST, multilocus sequence typing; PFGE, pulsed-field gel electrophoresis; P-type, pathotype; R-type, resistotype.
Concordance among typing methods
The Wallace's coefficient (W) and the adjusted Wallace coefficient (AW) concerning unidirectional concordance between MLST, PFGE, R-type, and P-type (Table 3) showed a strong concordance (i.e., W and AW >0.86) between MLST and PFGE, as well as a good concordance (i.e., W and AW >0.73) between MLST and R-type. As explained in the Introduction, this result means that the classification, in terms of different or identical type strains obtained using MLST, can predict that found using PFGE and R-type. A sufficient level of concordance (i.e., W and AW >0.43) was observed also between PFGE and both MLST and R-type (Table 3). Finally, a very low degree of concordance (i.e., W and AW >0.097) was found between R-type and both MLST and PFGE. The P-type did not show concordance with the other typing methods, meaning that agreements between the results provided by P-type and one of the other methods is due to chance only (Table 3). In fact in Table 3, the Wi values calculated for the unidirectional concordance between P-type and MLST, PFGE and R-type are always included in the CI of the W coefficient for each combination of typing methods. Therefore, all the AW values are very low (Table 2). The results on the bidirectional concordance showed an AR >0.60 between MLST and PFGE only (Table 4). This AR value was significantly higher (p < 0.001) than the AR values for PFGE and R-type (AR 0.164) and MLST and R-type (AR 0.171). Finally, all the AR values between P-type and all the other typing methods were significantly lower (p < 0.001) of the AR values between the other combinations of typing methods.
Values in bold are those for which the correlation is significant and not due to chance alone.
Different superscript letters indicate that W and AW values are significantly different (p < 0.001).
AW, adjusted Wallace; CI, confidence interval; MLST, multilocus sequence typing; PFGE, pulsed-field gel electrophoresis; P-type, pathotype; R-type, resistotype; W, Wallace's coefficient.
Different superscript letters indicate AR values significantly different (p < 0.001).
CI, confidence interval; MLST, multilocus sequence typing; PFGE, pulsed-field gel electrophoresis; P-type, pathotype; R-type, resistotype.
Type strains identified
The isolates tested were assigned to different type strains according to their ST, R-type, pulsotype, and P-type (Table 5). Clonal relationships, referred to isolates belonging to the same type strain, were identified for 66.7% of the tested farms (Table 5). They referred mainly to isolates from the same farm. However, isolates belonging to the same type strain isolated in different farms of the same region were also detected (Table 5). Overall, the number of type strains identified within the same farm ranged between 2 and 8.
The type strains in bold were identified in different farms; the numbers in bold refer to isolates showing clonal relationships within the same farm.
Each type strain is defined by a combination of four numbers corresponding to the sequence type, pulsotype, resistotype, and pathotype, respectively.
Discussion
In this study, MLST and PFGE showed the better discriminatory ability, followed by R-type and P-type. Moreover, MLST and PFGE showed a good unidirectional and bidirectional concordance. A good unidirectional concordance was also observed between MLST and R-type, PFGE and both MLST and R-type, as well as R-type and the two investigated genotyping methods. These results seem to suggest that MLST only can be applied to trace clonal relationships between isolates. However, the isolates classified in the ST 3476, obtained in farms 5 and 15 displayed different pulsotypes and R-types; therefore, they would be improperly classified as clonal by MLST only. The same consideration can be extended to isolates with ST 50, collected in the farms 7 and 19, as well as to the isolates with ST 7496, from farms 6 and 52. This picture is important in order to approach the analysis of different typing data when available. However, the most promising technique in the analysis of outbreak-associated isolates, leading to faster and more precise source identification and to discriminate between alternative epidemiological hypotheses, is currently represented by whole-genome sequencing (WGS) (Harrison et al., 2013; Revez et al., 2014).
The CC21 identified in 23.4% of the turkey isolates included in this study has been previously described for chicken C. jejuni isolates (Ragimbeau et al., 2009; Sheppard et al., 2009; Colles and Maiden, 2012; Kittl et al., 2013). Moreover, additional CCs, such as CC443 and CC446, associated with 7.2% and 1.6% of the turkey isolates were already identified among chicken strains (Ragimbeau et al., 2008; Kittl et al., 2013). Interestingly, both CC21 and CC443, along with CC206 and CC257, associated with 4.8 and 12.1% of the turkey isolates, respectively, were already identified among human C. jejuni isolates and have been frequently associated with human diseases (Ragimbeau et al., 2008; Sheppard et al., 2009; de Haan et al., 2010; Colles and Maiden, 2012). The identification of CCs shared between turkey and human isolates suggests that turkeys could be a possible source of Campylobacter infection.
The 59.7% of the investigated isolates were resistant to two or more antimicrobials. Although the turkey isolates analyzed in this study were collected before the adoption of EU Regulation 1831/2003 banning the use of antibiotics as growth promoters in animal feeds, high occurrences of multidrug-resistant isolates in C. jejuni isolated from turkeys have been reported more recently. A high prevalence of tetracycline resistance in C. jejuni isolates from chickens and turkeys has been described (Andersen et al., 2006; Gu et al., 2009; Luangtongkum et al., 2009; Zhao et al., 2010). In this study, high resistance rates to (fluoro)quinolones were also observed. High level of tetracycline and (fluoro)quinolones resistances were also reported in C. jejuni human, animals, and food isolates in 2013 (EFSA, 2015).
Concerning the detection of virulence genes, the pathotype results do not correlate with other methods applied in this study; however, this research improves the knowledge on virulence genes of C. jejuni isolates from turkeys (Bang et al., 2004; Thorsness et al., 2008). The occurrence of the virulence genes observed in this study is in agreement with previous surveys performed on C. jejuni isolated from turkeys where cadF, pldA, and flaA genes resulted in the most conserved genes. The majority of our isolates were positive for all four virulence genes, in agreement with that observed by Thorsness et al. (2008), suggesting a potential ability of these Campylobacter to colonize turkeys and a potential capability to induce human Campylobacter infection (Konkel et al., 2000). However, infection is a multifactorial process, and studies on the regulation and expression of these genes in vitro and in vivo will be needed to better understand the role of these genes in the pathogenesis of campylobacteriosis.
Conclusions
The results of this study show that the population of C. jejuni isolates colonizing turkeys includes different-type strains within the same farm, which must be discriminated in order to make source attribution in case of human campylobacteriosis link to turkey or turkey products. Therefore, a representative number of animals and isolates must be collected during epidemiological investigations. Even if we already entered the WGS era, whenever an alternative typing method must be selected for typing C. jejuni, MLST is confirmed as the best choice. In fact, in this study MLST shows the best discriminatory ability and good correlation with PFGE and R-type. Even if this result seems to indicate to avoid running all methods on the same isolates, isolates sharing the same MLST profile with different PFGE and R-type were identified.
Footnotes
Disclosure Statement
No competing financial interests exist.