
Abstract
Contamination of beef products by Shiga toxin–producing Escherichia coli is a concern for food safety with a particular subset, the enterohemorrhagic E. coli (EHEC), being the most relevant to human disease. To mitigate food safety risks, preharvest intervention strategies have been implemented with the aim to reduce EHEC in cattle. One class of interventions that has been widely used in feedlots is direct-fed microbials (DFMs), which can contain various dosing rates of probiotic bacteria. Here we compare the use of two different doses of a commercially available DFM on total EHEC load in a commercial feedlot setting. The DFMs used were the standard 109 Propionibacterium freudenreichii and 106 Lactobacillus acidophilus colony forming units (CFUs)/head/day dose of Bovamine® (Nutrition Physiology Company, Guymon, OK) and the higher dose, Bovamine Defend™ (Nutrition Physiology Company), which is dosed at 109 P. freudenreichii and 109 Lactobacillus acidophilus CFUs/head/day. To analyze the total EHEC fecal concentration, 2200 head of cattle were assigned a DFM feed regimen lasting approximately 5 months. At harvest, 480 head of cattle were sampled using rectoanal mucosal swabs. A quantitative polymerase chain reaction assay targeting ecf1 was used to enumerate the total EHEC fecal concentration for 240 head fed the low-dose DFM and 240 head fed the high-dose DFM. No significant difference (p > 0.05) in the fecal concentration of total EHEC was observed between the two doses. This suggests that using an increased dosage provides no additional reduction in the total EHEC fecal concentration of feedlot cattle compared to the standard dosage.
Introduction
T
Current molecular-based EHEC screening methods target E. coli O157:H7 and the other top 6 serotypes (referred to as top 7, here forward) and detect a combination of the genes associated with serotype differentiation, intimin (eae), Shiga toxin variants (stx1/2) (Perelle et al., 2007; Jacob et al., 2012; Bibbal et al., 2014), and a set of genes with a propensity to be associated with EHEC (Delannoy et al., 2013). Using the current methodologies can result in false-negative or false-positive results when a polymicrobial sample, like feces, is analyzed (Verstraete et al., 2014). This is due to background bacteria independently possessing a target gene(s) within the sample (Feng, 2014). However, the effacing gene-positive conserved fragment 1 (ecf1) has been shown to be specific to pathogenic E. coli jointly possessing eae and stx1 and/or stx2 (Boerlin et al., 1998) and in some instances aEPEC (Livezey et al., 2015). By targeting ecf1, the total EHEC load associated with a sample can be assessed (Luedtke et al., 2014).
Cattle and other ruminants act as natural reservoirs of EHEC, transmitting the bacteria through fecal shedding. Super shedding cattle, which have been defined as releasing greater than 104 EHEC colony forming units (CFUs)/g of feces, (Matthews et al., 2006; Menrath et al., 2010), pose a concern for spreading EHEC among a herd and during the animal harvesting process (Arthur et al., 2010). The use of various preharvest intervention strategies has been implemented with the aim of controlling the transmission of EHEC (LeJeune and Wetzel, 2007). An intervention strategy that has been adopted among many feedlots is the use of probiotics termed direct-fed microbials (DFMs) that are composed of Lactobacillus strains and other genera (Wheeler et al., 2014).
The use of the standard dosage DFM marketed as Bovamine®, which is dosed at 106 Lactobacillus acidophilus CFUs/head/day, has been suggested to decrease the fecal shedding of O157:H7 (Brashears et al., 2003; McAllister et al., 2011). An additional formulation of Bovamine marketed as Bovamine Defend™, which has an increased dosage of 109 Lactobacillus acidophilus CFUs/head/day, is also available to cattle producers. Previous laboratory studies suggest that DFM reduce E. coli O157:H7 in a dose-dependent manner (Younts-Dahl et al., 2005). Little data exist, however, on the ability of a high-dose DFM to reduce the concentration of total EHEC in commercial feedlot cattle to an extent greater than the standard dose.
In this study, we sought to (1) compare the total EHEC load in feces from commercial feedlot cattle fed either a standard-dose or high-dose DFM and (2) provide an alternative method to analyze the efficacy of preharvest interventions in the mitigation of a broad range of EHEC serotypes.
Materials and Methods
Cattle and treatment assignment
Approximately 2200 steers were identified that arrived at a feedlot located in the Beef Industry Food Safety Council (BIFSCo) monitoring region 3 in March and early April of 2014 and scheduled for harvest in September. Incoming cattle from the same source were randomly split using a two-way sort at initial processing, resulting in paired pens across treatments. The majority of cattle came from BIFSCo regions 6 and 7 and were analyzed using this region classification.
Pens assigned the numbers 1, 2, 6, 9, and 10 were considered region 6 sourced cattle. Pens numbered 1, 6, 9, and 10 each contained cattle from a different supplier within that region, while pen number 2 had a mixture of cattle from one supplier in region 6 and one supplier in 7, but nevertheless was considered as a region 6 pen for this study. Pens assigned numbers 3, 4, 5, 7, and 8 were considered region 7 sourced cattle. Pens numbered 3 and 7 each contained cattle from a single different supplier within that region. Pens 4 and 8 contained cattle from two different sources within region 7 that were grouped before sorting, while pen number 5 had a mixture of cattle from one supplier in region 7 and one supplier in region 3 but was considered as region 7 pen for this study (Fig. 1). DFM treatments were assigned, such that five paired pens of cattle from each region were fed the standard-dose DFM (Bovamine; Nutrition Physiology Company, Guymon, OK) and five paired pens of cattle from each region were fed the high-dose DFM (Bovamine Defend; Nutrition Physiology Company). Pens were as close to each other as possible to minimize differences due to location (moisture, flies, traffic, other cattle).
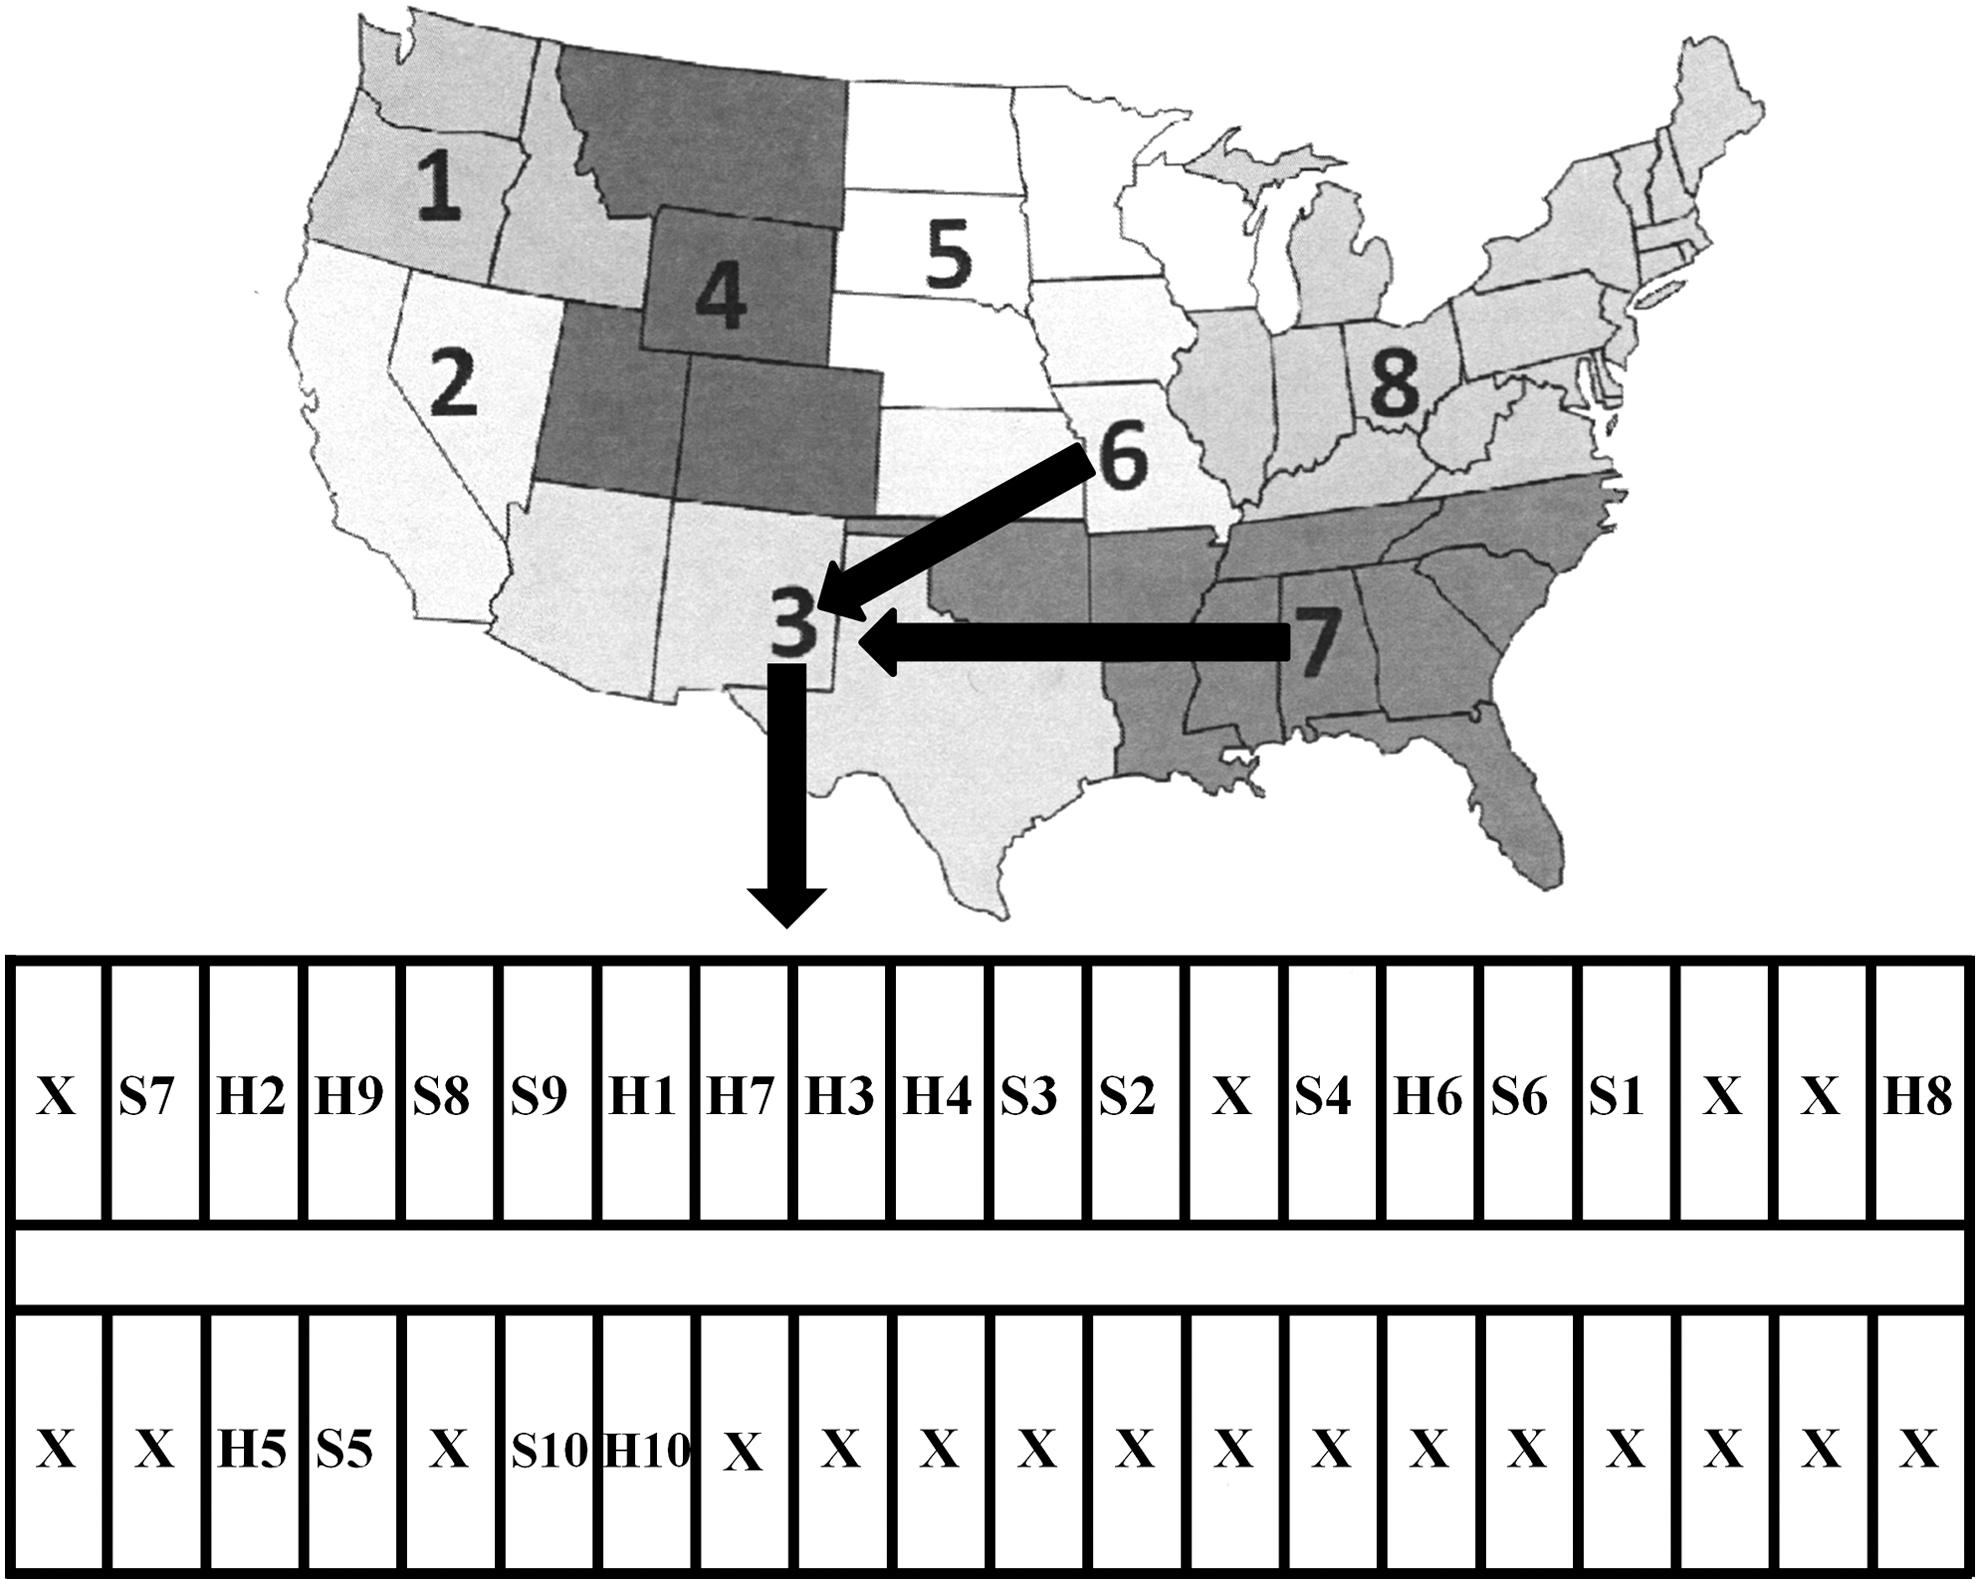
Map of the cattle origins using the BIFSCo monitoring regions and pen identification. Two hundred forty head of cattle from region 6 and 240 head from region 7 were placed on a feedlot in region 3. Pens were grouped based on origin with 10 paired pens from region 6 and 10 paired pens form region 7. Samples were collected from 24 head per pen. Each paired pen was assigned a number and a feed regimen of either the standard-dose (S) or high-dose (H) direct-fed microbials (DFM), for example, S1 or H1. Each row consisted of 20 pens. X, Pens not part of study.
Cattle feeding and rations
The standard-dose DFMs (109 Propionibacterium freudenreichii and 106 Lactobacillus acidophilus) and high-dose DFMs (109 P. freudenreichii and 109 Lactobacillus acidophilus) were fed according to the manufacturer's instructions through supplementation of the feedyard transition and finishing diets that included (dry matter basis) 31% flaked corn, 18% high-moisture corn, 12% corn gluten feed, 10% silage, 24% Sweet Bran, 3% tallow, and 2.0% vitamin/trace mineral mix.
Fecal swab sampling and DNA preparation
Fecal swabs were collected from 24 head per pen by swabbing the rectoanal junction of cattle at harvest in a commercial beef processing plant. Swabs were collected immediately following stunning and exsanguination. After collection, swabs were placed into 15-mL conical tubes containing 5 mL of tryptic soy broth (TSB, Difco; Becton Dickinson, Franklin Lakes, NJ) with phosphate buffer (TSB+PO4; 30 g of TSB, 2.31 g of KH2PO4, and 12.54 g of K2HPO4) per liter of solution and stored on ice for transport to the U.S. Meat Animal Research Center. Upon arrival at the laboratory, all tubes were vigorously mixed by vortex for 15 s and then a DNA preparation was made using a 20 μL aliquot of each fecal suspension, which was added to a respective tube containing 180 μL of the BAX® system lysis buffer supplemented with the BAX system protease (DuPont, Wilmington, DE). DNA from the samples was then prepared according to the manufacturer's instructions (DuPont) and stored at −20°C.
Quantitative polymerase chain reaction
The quantitative polymerase chain reaction (qPCR) was based on the detection of the ecf-1 and eae genes, in which a 5-log standard curve was developed using the E. coli O157:H7 reference strain EDL 932 (ATCC 43894) as previously described (Luedtke et al., 2014). The standard curve was run on each of the qPCR plates and the resulting Cq values for each dilution from across the plates were averaged to create a pooled standard curve for absolute enumeration as previously described (Sivaganesan et al., 2010). The DNA preparations were thawed completely and briefly mixed by vortex before qPCR analysis. All samples, no template controls, and the standard curve were run in duplicate reactions on an ABI 7500 Fast Real Time PCR machine (Applied Biosystems® by Life Technologies, Carlsbad, CA) using the previously described duplex qPCR assay targeting eae and ecf1 (Luedtke et al., 2014).
Statistical analyses
All statistical analyses were performed using GraphPad Prism 6 (GraphPad Software, La Jolla, CA). The pen was considered the experimental unit. To determine significant differences between more than two groups of cattle, a one-way ANOVA and the Tukey's post hoc test were used, while a paired t-test was used to compare two groups of cattle. A p < 0.05 was considered significant for all tests.
Results and Discussion
The standard curve was reproducible for each dilution across the reaction plate (Table 1). Using the pooled standard curve approach, the curve was consistent and the qPCR efficiency for both eae and ecf1 was 96% (Fig. 2). The no template controls were consistently negative for all reactions. These results are consistent with a previous report utilizing this assay to enumerate total EHEC directly from cattle feces obtained by rectoanal mucosal swab (RAMS) and provide an expected reliable limit of quantification of 1250 CFUs/mL (Luedtke et al., 2014).
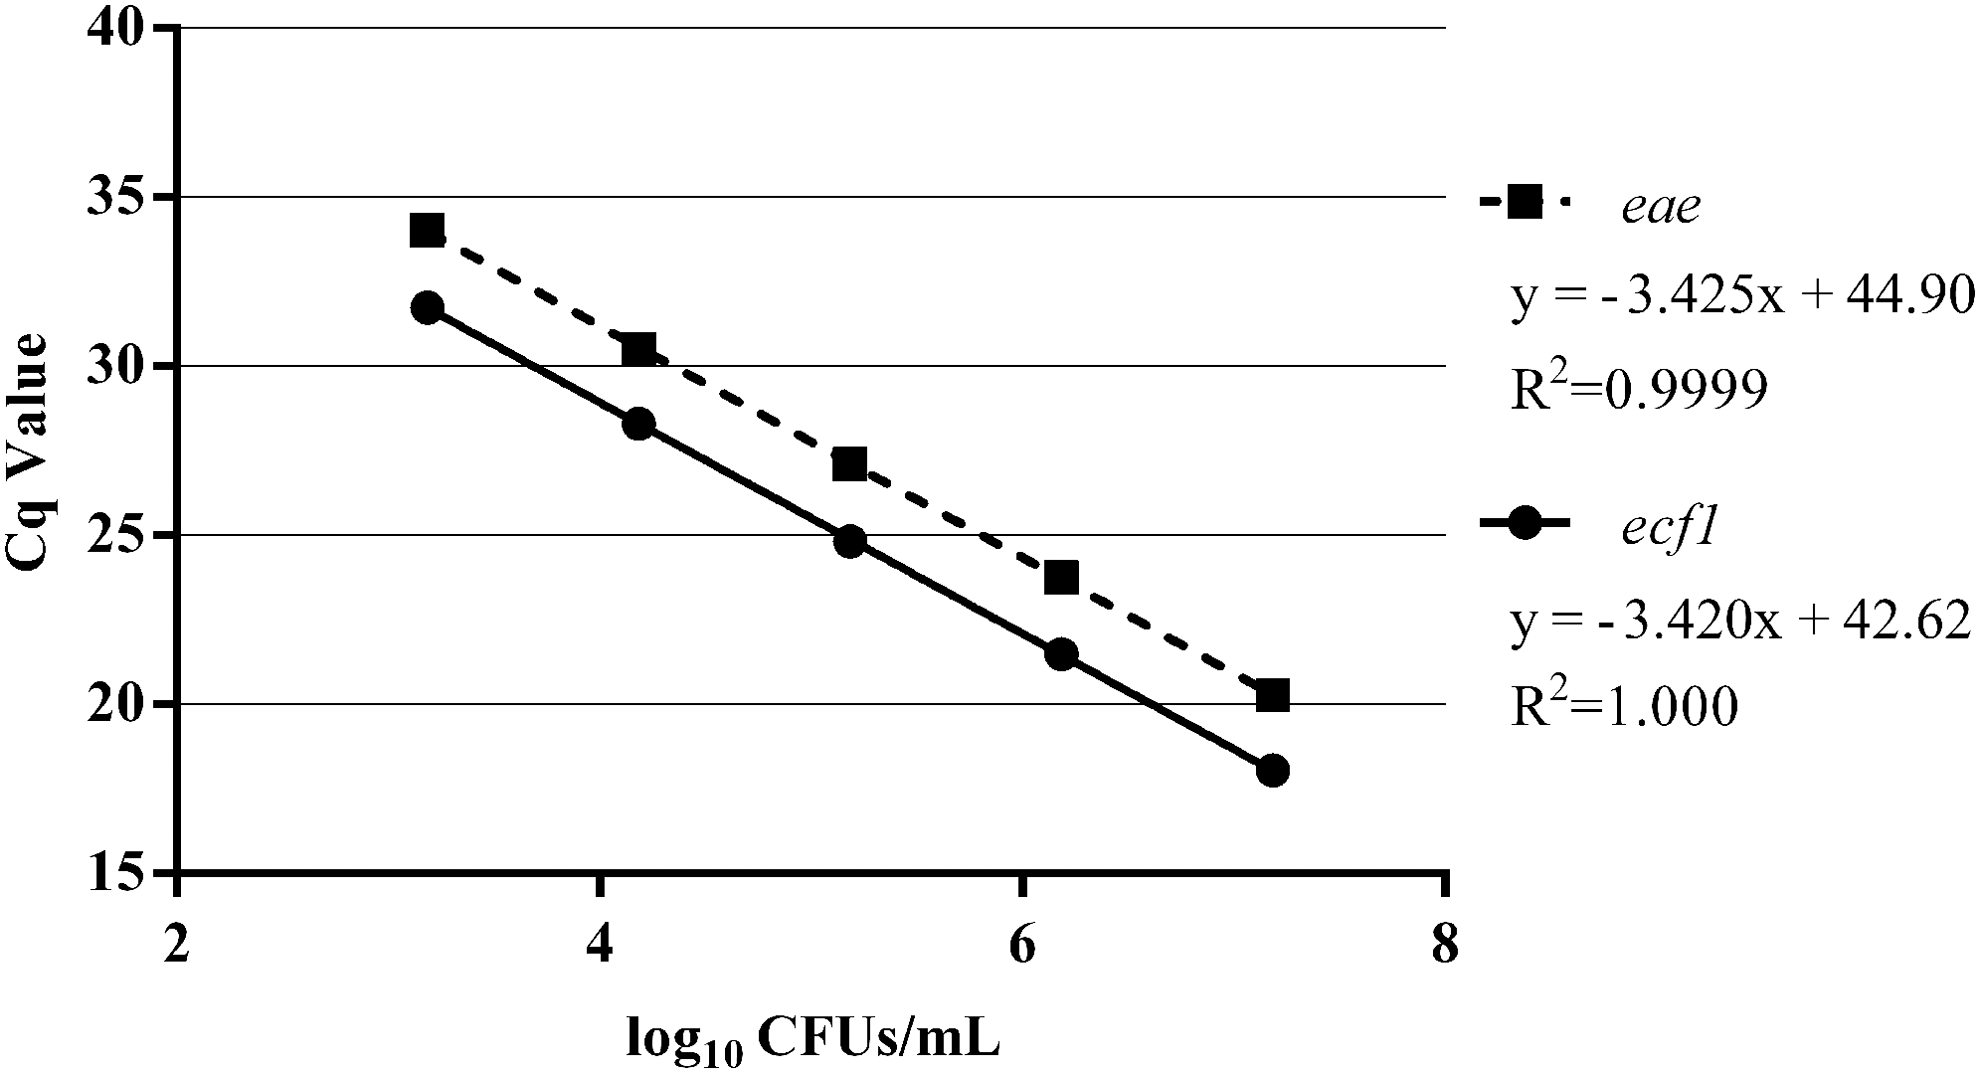
Pooled standard curve used for the enumeration of the total enterohemorrhagic Escherichia coli (EHEC) fecal concentration. A 5 log standard curve was run in duplicate for each reaction plate and the Cq values for the targets eae and ecf1 were pooled as described.
The average Cq value ± the standard deviation.
CFU, colony forming units; EHEC, enterohemorrhagic Escherichia coli; CV, coefficient of variation.
The use of RAMS and feces to evaluate the colonization and shedding level of EHEC by cattle has been documented in the literature (Rice et al., 2003; Greenquist et al., 2005; Niu et al., 2008; Cernicchiaro et al., 2011). While one study reported fair to moderate agreement (Kappa values of 0.36–0.45) between RAMS and feces results, with feces samples found more often positive for EHEC (Niu et al., 2008).
Other studies found RAMS samples were more sensitive than fecal samples for determining the prevalence of E. coli O157 in feedlot cattle (Greenquist et al., 2005) and concluded that RAMS more directly measured the relationship between cattle and EEHC, distinguishing between colonized cattle and those transiently shedding EHEC (Rice et al., 2003). When differences in the reported impact of diet and probiotics on the shedding of E. coli O157:H7 were found using RAMS and feces (Cernicchiaro, 2010), subsequent studies later showed that the differences between the two methods were not statistically significant (Cernicchiaro, 2011). The use of RAMS, however, provides results as log10 CFU/mL, and therefore, care must be taken when interpreting and comparing results with other results in the literature that may have directly tested feces and present units as log10 CFU/g (Omisakin et al., 2003).
As this study was performed in a commercial feedyard, animal handling was kept to a minimum to avoid production losses. While potentially providing additional information, repeated sampling over the course of the feeding would have required the animals to be handled more than what is typically done under commercial conditions and may have incurred production losses. To minimize pen-to-pen variation at the start of the study, animals from each incoming cattle lot were randomly sorted into the two treatments. The effects of DFM described in the literature have cumulative endpoint reductions in EHEC carriage and shedding (Brashears et al., 2003; McAllister et al., 2011); thus, our endpoint sample collection is a valid approach to evaluate the efficacy of the two probiotic dosages.
The concentration of total EHEC ranged from 0 to 107 CFUs/mL for cattle fed either the standard-dose or high-dose DFM. Fecal samples with total EHEC concentrations below 103 CFUs/mL were enumerable based on the standard curve but likely were influenced by a stochastic effect (data not shown), and subsequently, all samples were grouped based on the whole log10 CFUs/mL value. The highest frequency of 79 (33%) head in the 103 CFUs/mL range was observed for both the DFMs (Table 2). Cattle fed the standard dose had 74 (31%) head below 103 CFUs/mL, while cattle fed the high dose had 60 (25%) head below this level (Table 2). When looking at potential super shedding cattle, the cattle fed the standard dose had 87 (36%) head with a total EHEC load at a concentration greater than or equal to 104 CFUs/mL, while cattle fed the high dose had 99 (41%) head with a total EHEC load over the same range (Table 2). Since this qPCR assay does not differentiate between the different serotype concentrations that could be contained in a respective sample and the absence of research investigating if the total EHEC load influences downstream food contamination and human disease, labeling these cattle as super shedders is not definitive. However, the low infectious dose of 10–100 cells for O157:H7 and a speculated similar infectious dose for the non-O157:H7 (Pihkala et al., 2012) serotypes warrant future research to determine if cattle with increased loads of total EHEC are a significant contributor to environmental transmission.
n = 240 head of cattle.
Number of cattle with total EHEC concentration at each order of magnitude.
Average concentration of total EHEC ± the standard deviation within each order of magnitude.
N/A, Not applicable, the 0 log10 CFU/mL samples had no detectable amount of ecf1 and could not be enumerated.
CFU, colony forming units; DFM, direct-fed microbials; EHEC, enterohemorrhagic Escherichia coli.
The average total EHEC from feces of cattle fed either a standard dose or high dose was 3.61 ± 1.38 and 3.80 ± 1.45 log10 CFUs/mL, respectively. No significant difference (p > 0.05) was observed for the average total EHEC concentration determined for cattle fed either DFM. While there was no difference in the fecal concentrations between the two DFM treatments, differences were observed between cattle lots that arrived from different origins. Total EHEC concentration based on the location of origin for each pen of cattle was analyzed, to determine if a regional difference existed. Only the region 7 lots fed the high dose were significantly different (p < 0.05) from the region 6 lots fed the standard dose, with the region 7 lots having the higher concentration of total EHEC. When the feed regimen was not taken into account, the region 6 lots had an average total EHEC concentration of 3.49 ± 1.47 log10 CFUs/mL, while the region 7 lots had an average total EHEC concentration of 3.92 ± 1.33 log10 CFUs/mL. The difference in total EHEC concentrations between the two regions was significant (p < 0.05), however, the biological impact of these observed differences requires additional studies. At the pen level, significant differences (p < 0.05) in the total EHEC concentration were observed in paired pens numbered 1 and 5, with cattle fed the high dose having the higher concentration (Fig. 3). Across all 20 pens and the DFM used, multiple pens and DFM treatments were significantly different from each other (date not shown). As expected, cohorts with a higher prevalence of cattle with a total EHEC concentration above 103 CFUs/mL also had a higher average total EHEC concentration for the pen regardless of the DFM regimen (Table 3). These pen-level observations agree with previous data for the transmission and fecal load of O157:H7 among a pen in relation to the presence of super shedding cattle (Omisakin et al., 2003; Matthews et al., 2006; Cobbold et al., 2007; Arthur et al., 2009).
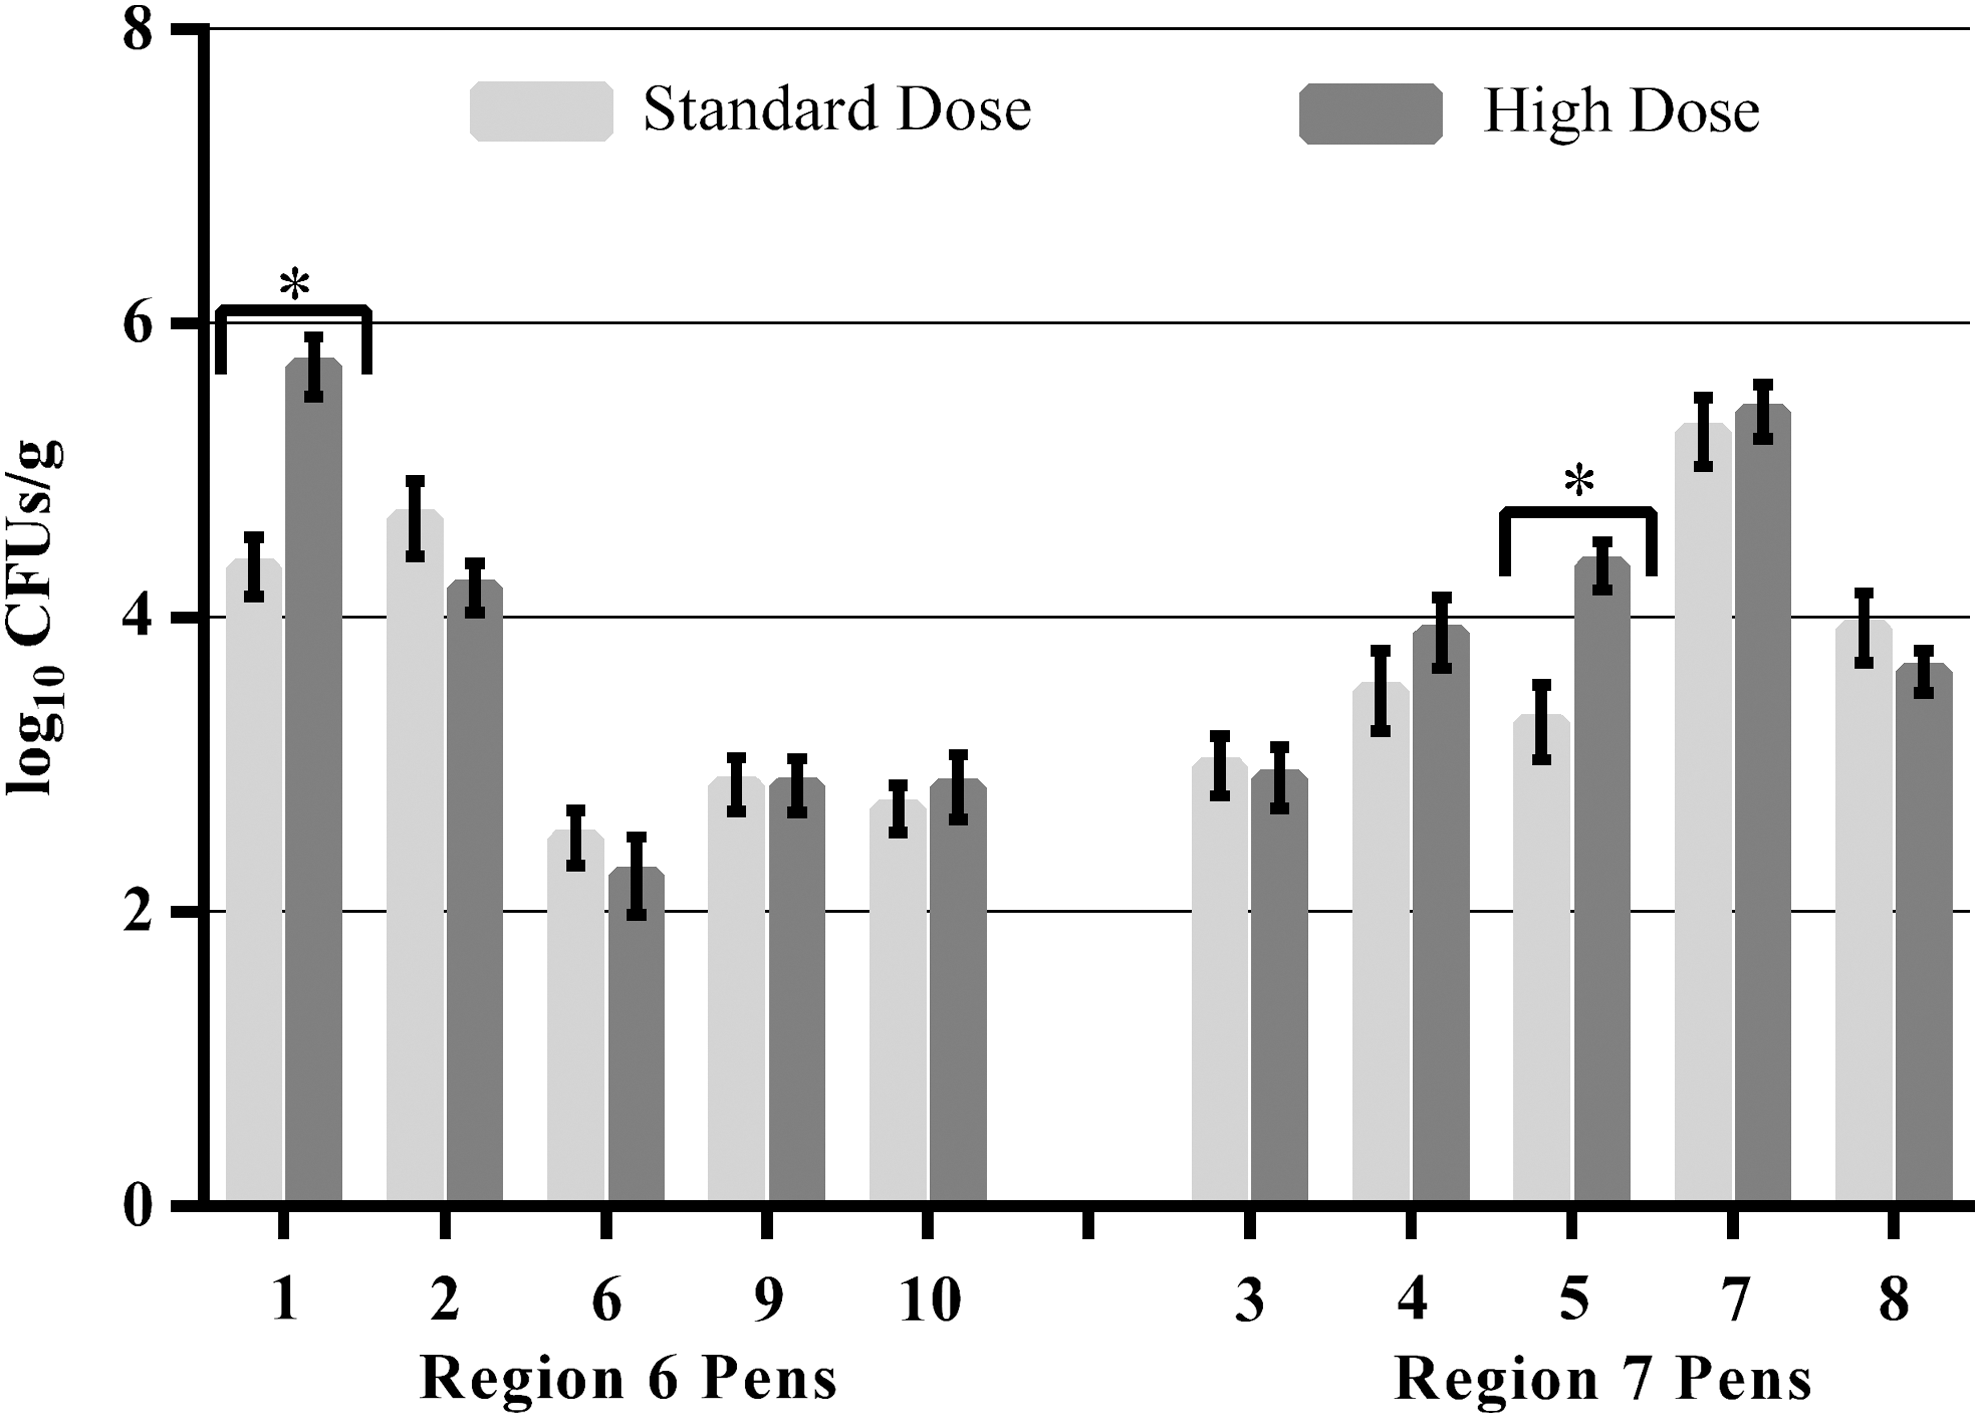
The average total enterohemorrhagic Escherichia coli (EHEC) concentration from cattle fed either a standard-dose or high-dose direct-fed microbials (DFM) based on paired pens. From each pen, 24 head of cattle were sampled. The results represent the average total EHEC concentration from the 24 head sampled in each pen. The error bars indicate the standard error of the mean. *Indicates a significant difference (p < 0.05) in total EHEC concentration between feed regimens for the pens.
n = 24 head of cattle per pen.
Number of cattle with a total EHEC concentration above 103 CFUs/mL.
Average concentration of total EHEC ± the standard deviation for the entire pen.
CFU, colony forming units; DFM, direct-fed microbials; EHEC, enterohemorrhagic Escherichia coli.
This is the first study to compare the efficacy of a high-dose DFM to reduce the fecal concentration of total EHEC in beef cattle compared to a standard-dose DFM. Previous studies have focused on the ability of DFMs to reduce the fecal prevalence of O157:H7 (Brashears et al., 2003; Peterson et al., 2007) and in a dose-dependent manner (Younts-Dahl et al., 2005), while other reports have shown that treatment of cattle with Bovamine does not significantly reduce the prevalence of O157:H7 (Cull et al., 2012) or the top 6 STEC serotypes (Cernicchiaro et al., 2014). To compensate for these varying results, it has been suggested that different concentrations of DFMs and the probiotic species composition have varying effects on foodborne pathogens and are application dependent (Callaway et al., 2013). In addition, measuring the reduction in EHEC prevalence may be misleading in terms of value to food safety (Callaway et al., 2013) as the fecal concentration has a greater impact on carcass contamination (Arthur et al., 2009).
Conclusion
The results of this study indicate that the use of the DFM dosed at 109 Lactobacillus acidophilus CFU/head/day does not provide a significant reduction in the fecal concentration of total EHEC over the use of the DFM dosed at 106 Lactobacillus acidophilus CFU/head/day. Also, this study highlights the utility of the described assay, which is capable of enumerating and detecting nontop 7 EHEC in addition to the top 7, thus providing a more complete picture of the total EHEC concentration in cattle feces. Use of this assay could facilitate the evaluation of other preharvest interventions and provide information relevant to food safety.
Footnotes
Acknowledgments
The authors thank the cooperating feedlots and processing plant for access to sample collection. Additional recognition goes to Frank Reno, Lawnie Luedtke, and Greg Smith for technical support and Jody Gallagher for secretarial assistance.
Disclosure Statement
No competing financial interests exist.