
Abstract
Studies have shown that irrigation water can be a vector for pathogenic bacteria. Due to this, the Food Safety Modernization Act's (FSMA) produce safety rule requires that agricultural water directly applied to produce be safe and of adequate sanitary quality for use, which may pose a challenge for some farmers. The purpose of this research was to assess the presence and concentration of Salmonella and generic Escherichia coli in irrigation water from distribution systems in a mixed produce production region of southern Georgia. Water samples were collected during three growing seasons at three farms irrigating crops with surface water (Pond 1, Pond 2) or groundwater (Well) during 2012–2013. Salmonella and generic E. coli populations were monitored by culture and Most Probable Number (MPN). Confirmed isolates were characterized by pulsed-field gel electrophoresis and serotyping. In Pond 1, Salmonella was detected in 2/21 surface, 5/26 subsurface, 10/50 center pivot, and 0/16 solid set sprinkler head water samples. In Pond 2, Salmonella was detected in 2/18 surface, 1/18 subsurface, 6/36 drip line start, and 8/36 drip line end water samples. Twenty-six well pumps and 64 associated drip line water samples were negative. The overall mean Salmonella concentration for positive water samples was 0.03 MPN/100 mL (range <0.0011–1.8 MPN/100 mL). Nine Salmonella serovars comprising 22 pulsotypes were identified. Identical serovars and subtypes were found three times on the same day and location: Pond 1-Pivot-Cantaloupe (serovar Rubislaw), Pond 1-Pivot-Peanut (serovar Saintpaul), and Pond 2-Drip Line Start-Drip Line End-Yellow Squash (serovar III_16z10:e,n,x,z15). Generic E. coli was detected in water from both farm ponds and irrigation distribution systems, but the concentrations met FSMA microbial water quality criteria. The results from this study will allow producers in southern Georgia to better understand how potential pathogens move through irrigation distribution systems.
Introduction
F
The Food and Drug Administration (FDA, 2015) recognizes this risk, and in its recently finalized “Standards for the Growing, Harvesting, Packing and Holding of Produce for Human Consumption” (hereafter referred to as the Produce Safety Rule), growers must ensure that agricultural water is safe and of adequate sanitary quality for its intended use. Agricultural water is defined as water that comes into direct contact with produce and includes irrigation water that is applied using direct water application methods, such as overhead sprinkler irrigation. Growers are required to establish an initial Microbial Water Quality Profile (MWQP) for each water source by collecting a minimum of 20 samples during time periods close to harvest over 2–4 years, followed by annual surveys. New online tools have been developed to assist farmers with these calculations (WCFS, 2016).
These requirements may be challenging for farmers using surface water sources, such as constructed farm ponds, commonly found on mixed-produce farms in the southeastern coastal plain (SECP) of the United States. In the SECP, a variety of irrigation sources are used, but the most common is the constructed farm pond, which is typically created by damming a second- or third-order stream. During the growing season, the ponds are used as irrigation sources and are replenished by the stream, direct surface runoff during precipitation events, and sometimes by ground water from nearby wells (Sheridan and Ferreira, 1992; Cho et al., 2010; Jang et al., 2013).
Recent studies conducted in the SECP have shown measurable concentrations of Shiga toxin–producing Escherichia coli, Campylobacter jejuni, and Salmonella in water samples (Rajabi et al., 2011; Gu et al., 2012, 2013; Luo et al., 2015). To better understand the modes of contamination of produce, our objective was to conduct a study to assess the presence and concentration of Salmonella and generic E. coli in irrigation water sources and different distribution systems on three mixed-produce farms.
Materials and Methods
Project area description
SECP is a subtropical low-elevation ecoregion situated between the Gulf of Mexico and the Atlantic Ocean (Fig. 1). It covers ∼143,843 km2, which includes portions of Louisiana, Mississippi, Tennessee, Alabama, Florida, Georgia, South Carolina, North Carolina, and Virginia. The combination of long frost-free periods of >240 days, plentiful water, and a long growing season has made this region an important vegetable production area. Southern Georgia is in the heart of SECP and has been identified by federal agencies and researchers as being representative of the agricultural practices, climate, and water resources of the SECP (USGS, 2014).
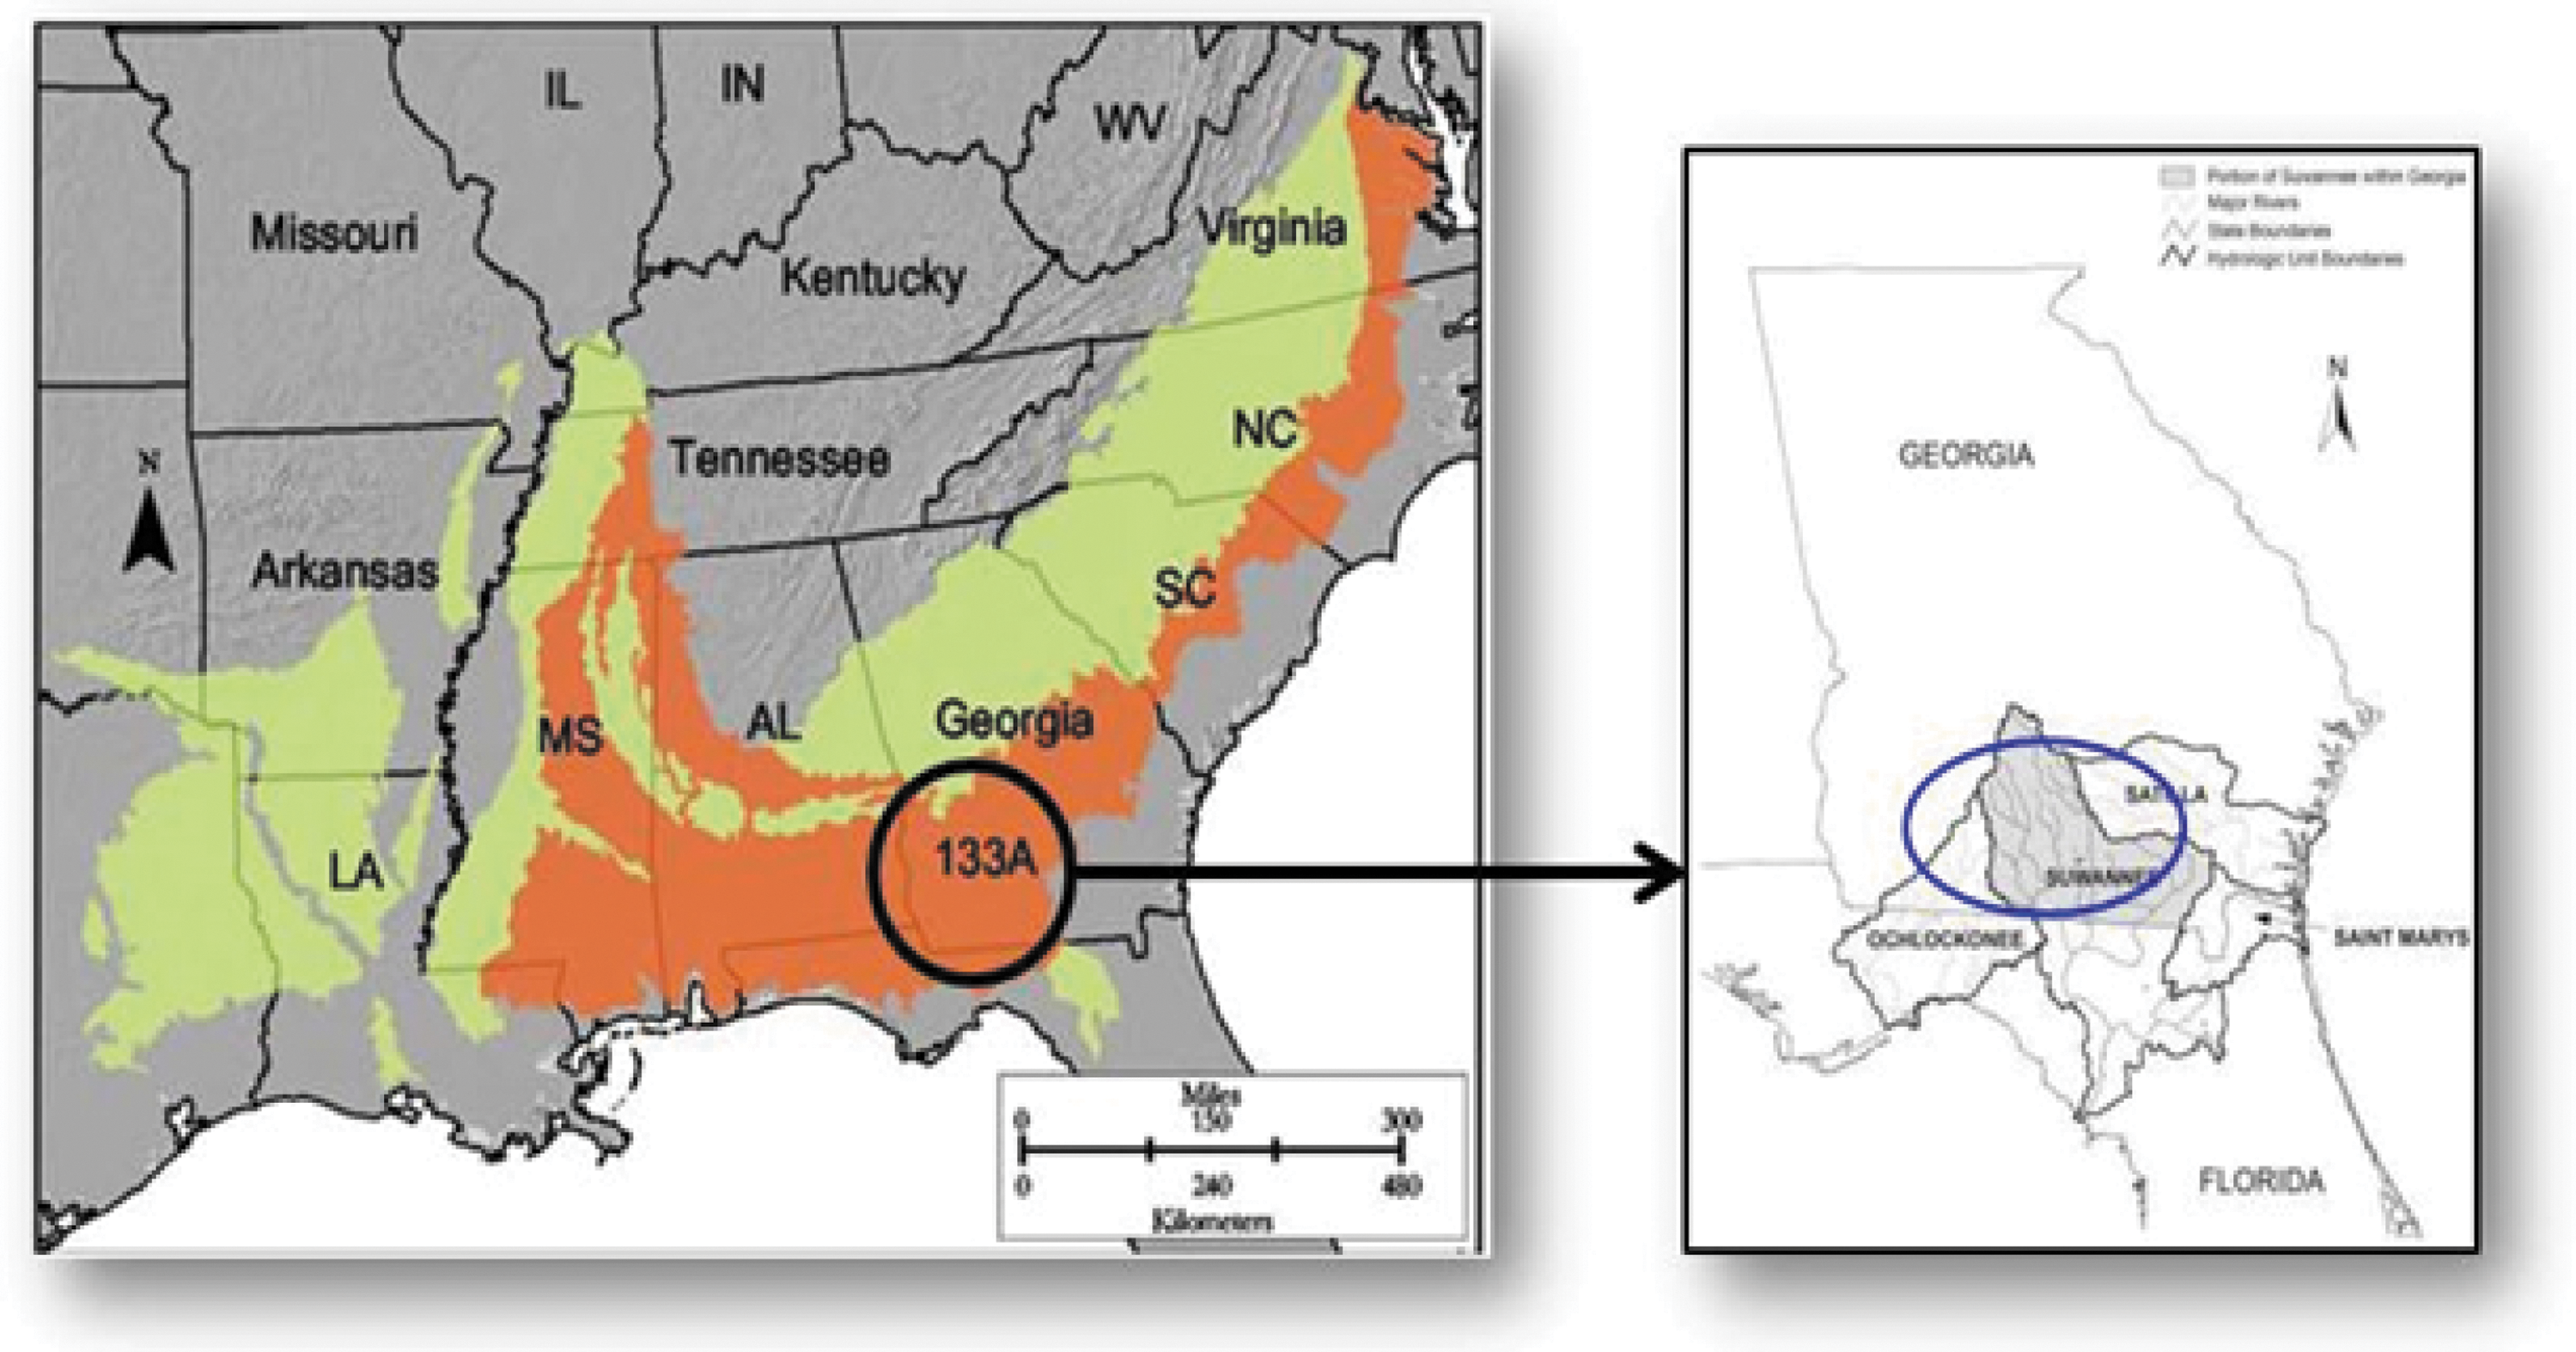
Map of the Southern Coastal Plain Land Resource Region, United States Department of Agriculture (USDA), Natural Resources Conservation Services (NRCS).
Sample distribution and collection
This research was conducted during three growing seasons on three farms within the southern Georgia region. Two were irrigated from either Pond 1 or Pond 2, while the third was irrigated from a deep groundwater well. Pond 1 fed a center pivot irrigation system and a solid set sprinkler system. Pond 2 fed three different drip irrigation systems. Figure 2 shows a typical pond–pivot or pond–drip distribution system for crop irrigation. Water was collected in sterile 1 L bottles from the surface and subsurface (1 m deep) of each pond near the water intake for the pump while the pump was running. Water samples were collected from the start and end of randomly selected drip lines, and center pivot or solid set sprinklers using sterile catch cups then and transferred to 1 L bottles. One liter samples of tailwater resulting from irrigation water runoff, as well as swabs from pivot sprinkler heads and biofilms from within the interior of the pivot's main pipe, were collected from the field irrigated by Pond 1. On the third farm, the deep groundwater well and the drip irrigation system it fed were also sampled using the methods described above. All samples were stored on ice and shipped overnight to the University of California, Davis, Western Center for Food Safety, for further analysis.
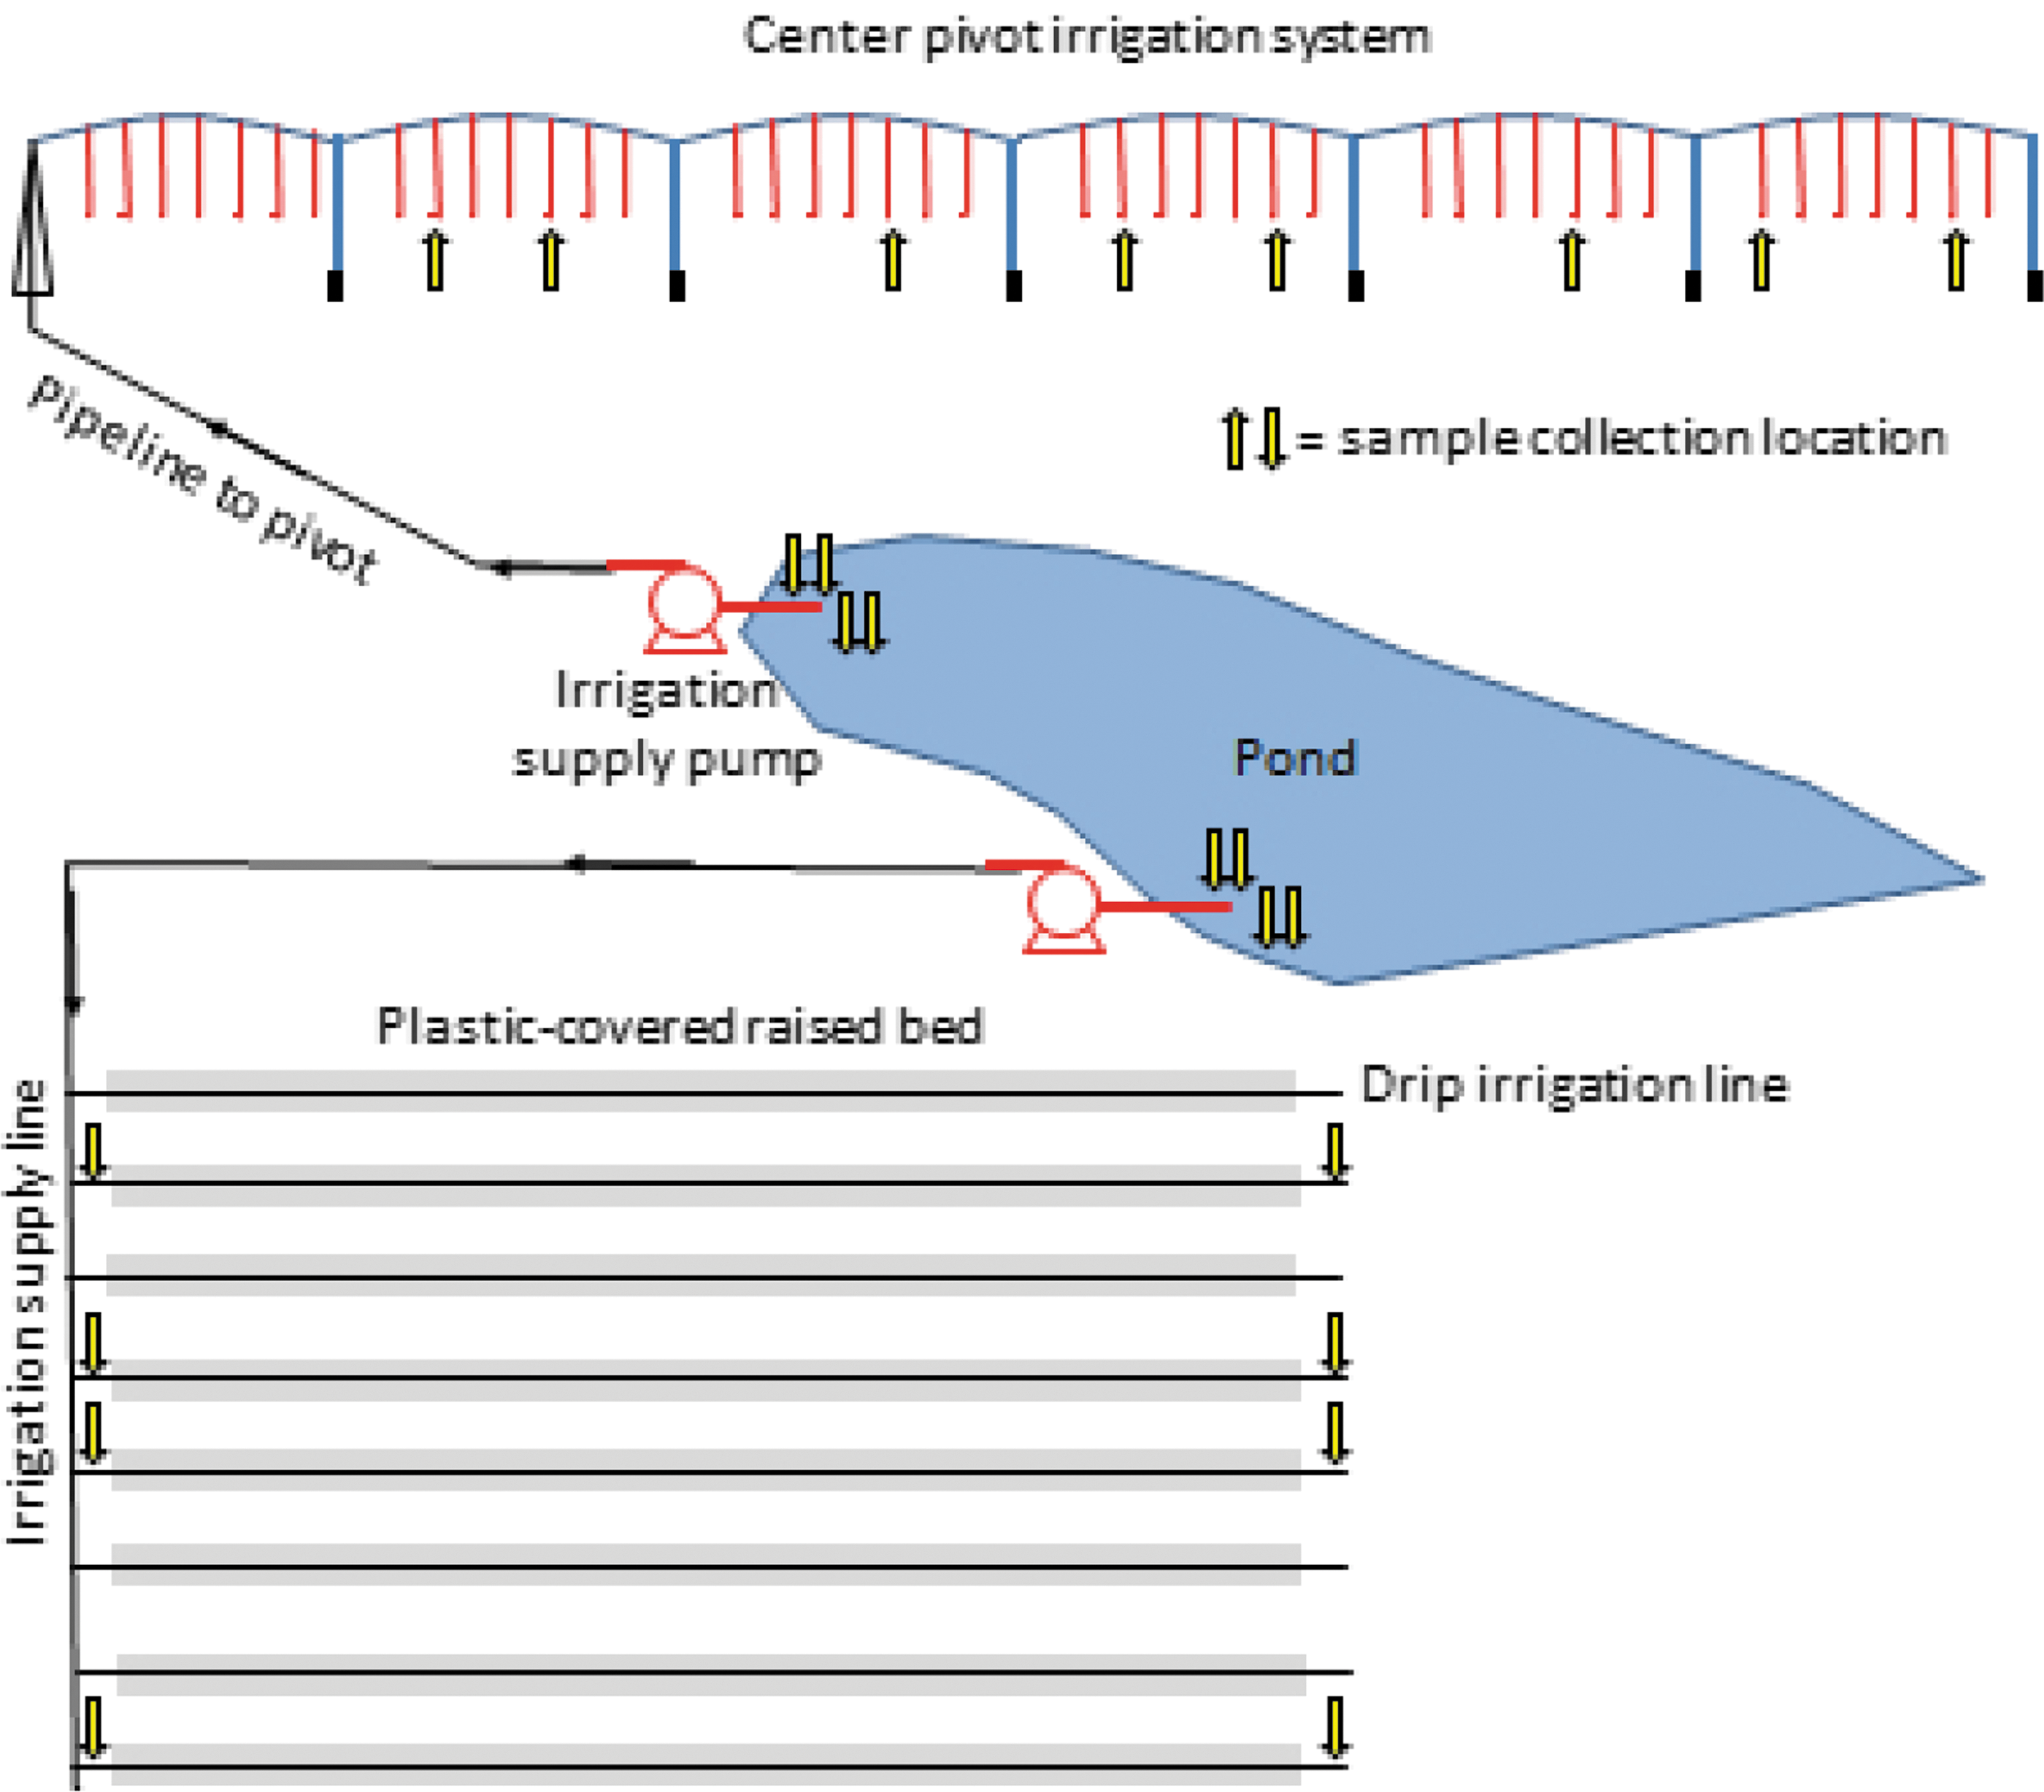
A general sampling schematic for a center pivot and drip line irrigation systems fed by a pond. Yellow arrows indicate the location points where water was collected from during this study.
Other parameters for analysis
During each sampling event, the temperature (°C), pH, dissolved oxygen concentration (DO Conc., mg/L), and turbidity (nephelometric turbidity units [NTU]) of the pond were measured with a multiparameter water quality sensor (YSI, Incorporated, Yellow Springs, OH). The type of crop that was being irrigated by each system was also recorded. Weather parameters, including total 5-day precipitation (mm) per 5-day period, average 5-day high/low temperature ranges (°C), and humidity (relative humidity, %), were collected from the nearest Georgia Weather Network weather station (GAEMN, 2015).
Pathogen isolation and quantification
Water samples were processed for the presence and quantification of Salmonella and generic E. coli. Salmonella was quantified using a Most Probable Number (MPN) method performed by filtering each 1 L sample at three different volumes: 2, 20, and 200 mL (880 mL in total), in quadruplicates. Each aliquot was vacuum filtered through a Millipore membrane (EMD Millipore, Billerica, MA) with a Sentino magnetic filter funnel (Pall, Inc., Cortland, NY), folded twice with sterile forceps and submerged into corresponding wells in a 12-well plate, which contained 3 mL of buffered peptone water (Remel, Inc., Lenexa, KS). The plates were enriched at 37°C for 20 h, shaking at 50 rpm. One hundred microliters of each volume was transferred into 1 mL of Rappaport-Vassiliadis R10 (RV) broth (Becton, Dickinson (BD) and Company, Franklin Lakes, NJ) in a 96-well deep plate and enriched for 48 h at 42°C. Five microliters from each RV well was streaked onto a square Xylose-Lysine Deoxycholate (XLD) agar plate (BD) and incubated for another 48 h at 37°C. Suspect Salmonella colonies were then streaked for isolation on a new XLD agar plate and incubated for 24 h at 37°C. Based upon the number of replicates and dilutions positive for Salmonella, the MPN values were determined using the MPN-Bacteriological Analytical Manual computer program (Atwill et al., 2015). Concentrations were expressed in MPN/100 mL with the lowest limit of detection being <0.0011 MPN/100 mL as determined by the range of the MPN analysis. Salmonella enterica serotype Braenderup H9812 was used as a positive control during processing (ATCC number = BAA-664).
For generic E. coli quantification, two different single volumes of 5 and 95 mL were filtered through the same process from the collected 1 L water samples. Membranes were transferred using sterile forceps to ChromeEC agar plates (CHROMagar, Springfield, NJ). ChromeEC plates were incubated overnight at 37°C, and colonies were counted and recorded from each dilution agar plate the next day as CFU/100 mL; plates that were too numerous to count were assigned an upper detection level of 3001 CFU/100 mL. In addition, using data from this study, we calculated a MWQP as defined in the Produce Safety Rule for Pond 1 (n = 47) and Pond 2 (n = 36) surface and subsurface irrigation water samples (WCFS 2016; Supplementary Data; Supplementary Data are available online at
Salmonella DNA extraction and polymerase chain reaction confirmation
Up to six suspect Salmonella colonies were chosen from each XLD plate to test for confirmation. Each colony was streaked onto a small Luria Agar broth plate (Fisher Scientific, Pittsburgh, PA) and incubated at 37°C overnight. A loop full of bacterial colonies was inoculated into a 1.5 mL microcentrifuge tube (USA Scientific, Orlando, FL) containing 100 μL of DNase-free water (Life Technologies, Grand Island, NY), boiled at 100°C for 20 min and centrifuged at maximum speed for 10 min. Salmonella was confirmed by polymerase chain reaction using a species-specific sequence within the HindIII DNA fragment as described previously (Kawasaki et al., 2005). Isolates were banked in microbank tubes (Pro-Lab Diagnostics, Round Rock, TX) and held at −80°C until further analysis.
Pulsed-field gel electrophoresis and serotyping
One Salmonella isolate from each positive sample was analyzed by pulsed-field gel electrophoresis using XbaI digestion and a Salmonella Braenderup ATCC BAA664 molecular size standard as described previously (Ribot et al., 2006). Isolates showing DNA smears were retested by digesting plugs with XbaI and adding 50 μM thiourea (Sigma-Aldrich, St. Louis, MO) to the running buffer of 0.5 × Tris-borate-EDTA (TBE). A dendrogram was constructed using band-based analysis with an optimization at 2.5%, band-matching tolerance at 1.5%, followed by unweighted-pair group method with arithmetic mean (UPGMA) method for clustering with BioNumerics software 7.1 (Applied Maths, Kortrijk, Belgium). Isolates were submitted to the California Animal Health and Food Safety Laboratory in San Bernardino, CA, for serotyping; “untypeable” strains were sent to the National Veterinary Services Laboratory in Ames, IA, for further testing.
Statistical analyses
Univariable analysis was used to explore the association between Salmonella presence in samples and individual variables, including season, weather, water source, type of distribution system, and physiochemical water parameters (pH, DO, temperature, turbidity). Quadratic forms of all continuous variables were analyzed to determine any nonlinear association. For multivariable binary logistic regression, a forward stepwise algorithm was used with p ≤ 0.05 to retain parameters in the final model with pond water source set as a fixed effect. All analyses were performed using STATA computer software version 12 (StataCorp LP, College Station, TX).
Results
In total, Salmonella was found in 34/285 (11.9%) water samples, including both ponds and associated pivot or drip line distribution systems (Table 1). Salmonella was not detected in solid set sprinkler water samples, tailwater, or swabs. Well pump and associated drip line water were also negative. The overall mean Salmonella concentration for positive water samples was 0.03 MPN/100 mL (range <0.0011–1.8 MPN/100 mL). The proportion of positive Salmonella samples was highest in the fall (15.3%; 11/72), compared with spring (10.3%; 7/68), summer (9.1%; 16/175), or winter (0.0%; 0/13) months, and the highest concentrations (1.4 and 1.8 MPN/100 mL) were also detected during the fall. However, there was no statistical difference by season (p-value >0.05). In the final model, detecting Salmonella from water was 3.7 times higher when an increase in water temperature occurred within the range of 17–25°C (p-value = 0.03), (Table 2).
<LOD, less than the limit of detection = 0.0011; too numerous to count assigned value of 3001 CFU/100 mL.
CFU, colony-forming unit; MPN, Most Probable Number.
Reference category.
CFU, colony-forming unit.
Generic E. coli was detected in both ponds and tailwater, but was not found in well water or swab samples from the pivot (Table 1). There was no relationship between the generic E. coli counts and the detection of Salmonella (p = 0.64). Using MWQP standards recently defined in the Produce Safety Rule (FDA, 2015) and a new Excel Tool (WCFS, 2016), surface and subsurface water from both ponds were below the criteria of 2.1 log E. coli CFU/100 mL geometric mean (GM) (0.6 log CFU/100 mL for Pond 1 and 0.53 log CFU/100 mL for Pond 2) and 2.61 log CFU/100 mL Statistical Threshold Value (STV) (1.72 log CFU/100 mL for Pond 1 and 0.91 log CFU/100 mL for Pond 2) (Supplementary Data).
Overall, nine serovars comprising 22 pulsotypes (Pond = 10, Pivot = 10, Drip line start = 6, Drip line end = 8) were identified (Fig. 3). No single serovar or pulsotype was dominant. The majority of serovars were found in only one of the two ponds, but three (Muenchen, Saint paul, III_60:r,e,n,x,z15) were isolated from both Pond 1 and Pond 2 on different dates. Several subtypes found in pond–pivot and pond–drip samples collected on the same day and location were indistinguishable. For example, Pulsotype 7 (serovar Rubislaw) was found on the same date (05/17/12) in Pond 1 subsurface and pivot water samples irrigating cantaloupes, as well as on two subsequent dates in pivot water fed by Pond 1 (Fig. 3). Likewise, serovar Saintpaul (pulsotype 21) was found in Pond 1 surface and pivot water irrigating peanuts on 06/24/13. In Pond 2, pulsotype 19 (serovar III_16:z10:e,n,x,z15) was found on the same day (10/16/12) along the entire drip irrigation chain during a yellow squash crop rotation.

Pulsed-field gel electrophoresis analysis following Xba1 digestion of selected Salmonella isolates from farm ponds and distribution systems. ID: laboratory identification code; Date: date when samples were collected; Rotation: crop grown at the time of collection; Source-Sample type: water irrigation source-site along irrigation system where samples were collected; Serovar: Salmonella serovar of isolate; Pulsotype: arbitrarily assigned number of different molecular fingerprints within the comparison, where fingerprints with the same pulsotype were considered indistinguishable.
Discussion
To better understand the potential modes of preharvest produce contamination, we assessed the presence and concentration of Salmonella and generic E. coli in irrigation water sources exiting different distribution systems on mixed-produce farms in southern Georgia. Salmonella was detectable in farm ponds and some of the irrigation systems they supplied for crop irrigation, whereas well water was not found to be a source of the pathogen.
Salmonella detection, concentration, and diversity
Although Salmonella prevalence was relatively high in our water samples, the mean concentration was low (Table 1). These values are similar to what was reported by Luo et al. (2015), who found that 28.2% of pond samples collected in the southeastern United States were positive for Salmonella, with an overall geometric mean concentration of 0.026 MPN/100 mL, even though quantitative methodology (number of replications with selective media) and sampling time were slightly different.
The highest proportions of positive samples and the highest concentrations of Salmonella were detected during the fall. This is consistent with the peak detections in September and October reported by Luo et al. (2015), as well as with the peak salmonellosis cases in Georgia (Boore et al., 2015). Not surprisingly, seasonal differences in our study area were different from what Cooley et al. (2014) reported in California, where the prevalence of Salmonella was lowest in the fall, increased during the winter, and was the highest in the spring and summer when there was decreased precipitation and increased temperature. In our study, air temperature and precipitation were not significant factors in the presence of Salmonella in the ponds and distribution systems, but differences between geographic regions may play a role in Salmonella survival.
In our final multivariable model, pond water temperature was the only covariate shown to have a positive relationship with the detection of Salmonella (Table 2). Haley et al. (2009) also reported water temperature being positively associated with the presence of Salmonella. The occurrence and persistence of Salmonella in ambient waters may be governed, in part, by parameters such as water temperature and water chemistry. Other reasons for seasonal patterns might include seasonal changes in pathogen shedding from human and animal hosts, as well as the survival rate of other competing bacteria in the environment. Although we did not study potential sources of Salmonella in the environment, wildlife activity was documented in this region during a previous study (Luo et al., 2015).
Molecular subtyping of isolates indicated that strains from Pond 1–pivot and Pond 2–drip systems collected on the same day and location were indistinguishable from each other (Fig. 3). These findings suggest that strains are being transported through the irrigation systems and could contaminate produce through direct contact with water or splash from contaminated soil. Other isolates found on different days or in different locations were also sometimes indistinguishable, possibly due to the persistence or reintroduction (Cooley et al., 2014; Li et al., 2015). Interestingly, we did not find a dominant serovar and only three samples contained Newport, a serovar previously described at high prevalence in this region (Li et al., 2014). The discrepancy may be due to methodological differences between our laboratories, or different environmental conditions at the time of sampling (e.g., wildlife activity, rainfall). For example, a previous survey detected some of the same Salmonella serovars (Muenchen, Newport, Rubislaw, Saintpaul) in amphibians and reptiles trapped in farm ponds in this region (Aminabadi P., unpublished data). Source tracking studies are needed to better define the connections between wildlife and other sources of Salmonella in farm ponds and produce fields.
The presence of Salmonella in farm ponds and movement of genetically related strains through irrigation water distribution systems imply a potential risk of human illnesses through contaminated produce. Among the distribution systems, Pond 1–Pivot and Pond 2–Dripline showed the highest prevalence, but concentrations were low. We speculated that Salmonella may be persisting in pivot biofilms, but swabs were negative. Of note, the Produce Safety Rule standards do not include surface water from drip line systems if it does not contact the harvestable portion of the produce (FDA, 2015). Li et al. (2014) found PulseNet patterns from outbreak-related isolates that were identical to Salmonella isolates from pond water isolates from the same region and time period, although no illnesses or recalls have been linked to produce from the SECP, to our knowledge. Whole genome sequencing and quantitative microbial risk analyses could shed more light on the predicted public health burden associated with this agriculture water. Growers may need to consider surface water disinfection to reduce the risk of microbial contamination of produce irrigated with farm pond sources, but there are limited options (e.g., copper sulfate) approved for this use, as well as the environmental concerns.
Generic E. coli levels and the produce safety rule
Generic E. coli was detected in farm pond water and associated irrigation distribution systems, but not in the well water systems (Table 1). These findings are not surprising as higher concentrations of generic E. coli are generally expected in untreated surface water compared with groundwater (FDA, 2015). As shown in previous studies, there was no correlation between pathogen detection and generic E. coli levels in water samples, although generic E. coli is still considered a good indicator of water quality (Benjamin et al., 2013; Luo et al., 2015). Since this study, FDA released MWQP criteria. To simulate a real-life assessment of untreated agriculture water, we entered our raw data into an online tool that calculates GM and STV (WCFS, 2016). This exercise demonstrated that by using the 2012–2013 data, both ponds met the regulatory criteria (Supplementary Data).
Conclusions
Our findings suggest that a low concentration of Salmonella moves through irrigation systems fed by farm ponds. Wells could be contaminated with enteric pathogens, but irrigation with surface water presents a higher risk of preharvest contamination. Knowledge resulting from this project will allow vegetable producers to better understand how pathogens migrate through irrigation distribution systems and to develop mitigation strategies. Future research will examine more locations, the potential for transfer of Salmonella to produce through different irrigation systems, detection of Salmonella on produce at harvest, and connection to human outbreak strains of Salmonella. In addition, the feasibility and effectiveness of water disinfection for farm pond irrigation systems used for fresh produce production need to be evaluated.
Footnotes
Acknowledgments
The authors are deeply grateful to the growers enrolled in the study. They would also like to thank Debbie Coker and Herman Henry at the University of Georgia, and Alexis Hake and Yingjia Bengson at the University of California, Davis, for their technical assistance. We also thank Rupinder Mashiana and Linda Harris for assistance with the MWQP excel tool.
Funding
Funds for this work were provided by the U.S. Food and Drug Administration (Project No. 5U01FD003572).
Disclosure Statement
No competing financial interests exist.
References
Supplementary Material
Please find the following supplemental material available below.
For Open Access articles published under a Creative Commons License, all supplemental material carries the same license as the article it is associated with.
For non-Open Access articles published, all supplemental material carries a non-exclusive license, and permission requests for re-use of supplemental material or any part of supplemental material shall be sent directly to the copyright owner as specified in the copyright notice associated with the article.