
Abstract
The objective of this study was to determine feedlot- and pen-level fecal prevalence of seven enterohemorrhagic Escherichia coli (EHEC) belonging to serogroups (O26, O45, O103, O111, O121, O145, and O157, or EHEC-7) in feces of feedlot cattle in two feeding areas in the United States. Cattle pens from four commercial feedlots in each of the two major U.S. beef cattle areas were sampled. Up to 16 pen-floor fecal samples were collected from each of 4–6 pens per feedlot, monthly, for a total of three visits per feedlot, from June to August, 2014. Culture procedures including fecal enrichment in E. coli broth, immunomagnetic separation, and plating on selective media, followed by confirmation through polymerase chain reaction (PCR) testing, were conducted. Generalized linear mixed models were fitted to estimate feedlot-, pen-, and sample-level fecal prevalence of EHEC-7 and to evaluate associations between potential demographic and management risk factors with feedlot and within-pen prevalence of EHEC-7. All study feedlots and 31.0% of the study pens had at least one non-O157 EHEC-positive fecal sample, whereas 62.4% of pens tested positive for EHEC O157; sample-level prevalence estimates ranged from 0.0% for EHEC O121 to 18.7% for EHEC O157. Within-pen prevalence of EHEC O157 varied significantly by sampling month; similarly within-pen prevalence of non-O157 EHEC varied significantly by month and by the sex composition of the pen (heifer, steer, or mixed). Feedlot management factors, however, were not significantly associated with fecal prevalence of EHEC-7. Intraclass correlation coefficients for EHEC-7 models indicated that most of the variation occurred between pens, rather than within pens, or between feedlots. Hence, the potential combination of preharvest interventions and pen-level management strategies may have positive food safety impacts downstream along the beef chain.
Introduction
F
Although a variety of food commodities (e.g., leafy vegetables, game meat, beef, dairy, pork, and fruits or nuts) are linked to these non-O157 STEC outbreaks and human infections (Luna-Gierke et al., 2014), cattle are recognized as the primary reservoir for STEC and intermittently shed these bacteria in their feces (CDC, 2014; FSIS, 2014). As a result, the fecal to hide to carcass contamination pathway provides a unique opportunity for STEC transfer with the potential for contamination of beef during the harvest process (Ferens and Hovde, 2011; Painter et al., 2013). In addition to the major public health concerns, the economic impact of STEC in the beef industry has been profound (NCBA, 2012), indicating the need for effective preharvest and postharvest interventions against STEC pathogens along the beef industry.
STEC are characterized by the presence of an O antigen and Shiga toxin virulence genes (stx1 and/or stx2). Enterohemorrhagic E. coli or EHEC are a subset of STEC that also possess the intimin gene (eae). Although the majority of research has focused on STEC O157, there is a growing body of scientific literature on the effects of E. coli non-O157 prevalence and transmission in commercial feedlot operations.
Recently, published literature has reported prevalence estimates of non-O157 STEC and EHEC in cattle feces, ranging from 0.0% to 16.9% and from 0.0% to 10.5%, respectively (Cernicchiaro et al., 2013, 2014; Baltasar et al., 2014; Ekiri et al., 2014; Paddock et al., 2014; Dewsbury et al., 2015). However, these studies were limited to reporting prevalence estimates of non-O157 STEC from range cattle or feedlot cattle in a single operation. Although one study indicated a high pen-to-pen variability of non-O157 STEC shedding in cattle feces (Dewsbury et al., 2015), additional studies are needed to understand fecal shedding dynamics for effective interventions to reduce the fecal load of non-O157 STEC in cohorts of cattle.
Processors have successfully applied postharvest interventions to hides and carcasses that have significantly reduced foodborne pathogens in beef. Understanding sources of variability and drivers of STEC shedding in cattle production environments will help with the identification and implementation of needed preharvest interventions. The objective of this study was to determine the feedlot- and pen-level prevalence of seven serogroups of EHEC (O26, O45, O103, O111, O121, O145, and O157) in feces of commercial feedlot cattle in two major cattle feeding areas of the United States.
Materials and Methods
Study population and fecal sampling
Samples were collected from eight commercial feedlot operations in two major U.S. cattle feeding areas from June to August, 2014. Cattle were managed following standard operating procedures of the respective study feedlot operations. This observational study followed a repeated cross-sectional design. Study area A consisted of four feedlots within a 150-mile radius in northwest Texas, whereas study area B consisted of four feedlots within a 100-mile radius in central Nebraska. Feedlot eligibility criteria were based on proximity (within 150 miles of each other within each area) to study areas (A and B), having cattle on a finishing diet during the summer months, and willingness to complete a questionnaire to gather demographic and management data in each visit.
A priori sample size estimates were generated by data simulation and power calculations; assumptions included 10% mean differences in within-pen fecal prevalence in pens with and without cattle shedding EHEC O157 and differences of up to 5% prevalence for non-O157 EHEC shedding in cattle between pens, 20% Type II and 5% Type I errors.
Feedlots were visited once per month for 3 months (three visits per feedlot). Up to 16 pen-floor fecal samples from each of four to six pens per feedlot, per visit, were collected. Samples (∼30 g) of freshly defecated individual fecal pats were collected in individual plastic bags (WHIRL-PAK®; Nasco, Fort Atkinson, WI) using single-use plastic spoons from multiple areas throughout the pen; care was taken to avoid ground contamination. Each week, the total number of pens per feedlot sampled was determined based on the availability of pens in which cattle were within 2 weeks of harvest, as pens were not resampled throughout the study. Samples were transported on ice packs, making sure samples remained cold during transit, to the Pre-Harvest Food Safety Laboratory (College of Veterinary Medicine, Kansas State University, Manhattan, KS) where they were refrigerated (4°C) for 14–16 h, followed by processing and testing.
Laboratory protocols for detection of EHEC
Approximately 2 g of feces were mixed into 18 mL of E. coli broth (EC; Difco, ThermoFisher, Waltham, MA) and incubated at 40°C for 6 h (Paddock et al., 2012). A 980-μL aliquot of enriched fecal suspension was subjected to an immunomagnetic separation (IMS) procedure using Abraxis® beads (Abraxis, LLC, Warminster, PA). The IMS procedure consisted of three separate IMS runs, one with individual O157 beads and two with separate sets of pooled non-O157 serogroup beads: (1) O26, O45, and O111, and (2) O103, O121, and O145 (Noll et al., 2016).
A 50-μL aliquot of the O157 bead suspension was spread plated onto sorbitol MacConkey agar with cefixime (0.05 mg/L) and potassium tellurite (2.5 mg/L; CT-SMAC), and a 50 μL of bead suspension for pooled non-O157 serogroups was spread plated onto a modified chromogenic Possé medium (MP; Possé et al., 2008; Noll et al., 2016) for each of the two pooled procedures. Plates were incubated for 20–24 h at 37°C.
Six sorbitol-negative colonies from CT-SMAC and 10 chromogenic colonies (e.g., blue, purple, or mauve) from each MP plate were randomly picked and individually streaked onto blood agar plates, then incubated for 18–24 h at 37°C. Isolates obtained from CT-SMAC plates were tested for the presence of the O157 antigen using latex agglutination (Oxoid Ltd., Basingstoke, United Kingdom); if positive, isolates were then tested for indole production.
Confirmation of EHEC O157 isolates included a six-gene multiplex polymerase chain reaction (PCR) assay for identification of the rfbE (O157), eae (intimin), stx1 (Shiga toxin 1), stx2 (Shiga toxin 2), ehxA (enterohemolysin), and fliCH7 (H7 flagella) genes (Bai et al., 2010). Ten isolates from each non-O157 IMS procedure were pooled and tested by an 11-gene multiplex PCR assay that detects 7 serogroups (O26, O45, O103, O111, O121, O145, and O157) and 4 major virulence genes (stx1, stx2, eae, and ehxA) as a screening procedure (Bai et al., 2012). If pooled colonies were positive for an O serogroup and stx gene, then each isolate (total of 10 isolates/MP plate) was tested individually by an 11-gene multiplex PCR assay to confirm the O serogroup and virulence genes. A sample was defined as EHEC positive if at least one individual colony tested positive for one of the seven O serogroups, stx gene (stx1 and/or stx2), and eae gene.
Questionnaire
A questionnaire was pretested in four of the eligible feedlot managers before the start of the study. Modifications to the questionnaire were made based on their feedback to eliminate confusing or misleading questions.
The questionnaire was written in English and consisted of open-ended (e.g., fill in the blank) and closed-ended (e.g., multiple choice) questions to obtain information on demographic and management variables at the feedlot and pen levels. The questionnaire was administered in person to feedlot managers at the time of each sampling visit. Information collected on demographic and management factors at the feedlot level included distiller's grain percentage (<10%, 10–30%, and >30% of the diet on an as-fed basis), one-time feedlot capacity (total number of cattle that can be accommodated in the feedlot at one time), implementation of preharvest interventions [yes or no, name of the product(s), and dose], and manure storage management (on site: pen-floor fecal material stored at the feedlot, or off site: pen-floor fecal material stored outside the feedlot). Information gathered at the pen-level included days on feed (DOF), sex composition of the pen (heifers only, steers only, or both), pen size (number of animals per pen), sampling month (June, July, or August), and type of fed cattle (beef, dairy, or both).
Statistical analysis
Proportion of positives for E. coli O serogroups and EHEC was calculated at the sample level, across all pens, as the number of samples that tested positive for an E. coli O serogroup (O26, O45, O103, O111, O121, O145, and O157) and EHEC serogroup (O serogroup and stx1 and/or stx2 and eae virulence genes) divided by the total number of samples collected. Cumulative pen- and feedlot-level percentage positives were calculated as the number of pens or feedlots that had at least one positive sample for each EHEC serogroup of interest, divided by the total number of pens or feedlots, respectively.
Model-adjusted cumulative within-pen prevalence estimates and their 95% confidence intervals were evaluated from model intercepts through generalized linear mixed models (GLMMs) that included random effects of sampling week and feedlot within study area. Outcome variables, modeled using a binomial distribution, consisted of the number of tested positive samples within each pen divided by the number of samples collected and tested per pen. Independent models were fitted for each of the seven EHEC serogroups, and for all non-O157 EHEC serogroups collectively. Fixed effects for feedlot and study area were added, in independent models, to estimate mean within-pen prevalence of each of the EHEC-7 serogroups in each of the study feedlots and study areas: random effects for sampling week or feedlot were included, respectively. Models were fitted using Proc Glimmix (SAS Version 9.3; SAS Institute, Inc., Cary, NC) using a logit link function, restricted pseudo-likelihood estimation, and Kenward–Rogers degrees of freedom approximation.
Similar GLMMs were used to determine associations between potential risk factors (pen- and feedlot-level factors) with the within-pen or within-feedlot fecal prevalence of EHEC. Initially, all independent variables were examined in a univariable screen. Independent variables included into the univariable screening included DOF (<100, 100–200, 200–300, and >300 DOF/pen), sex of cattle in the pen (heifer, steer, or both), pen size (<100, 100–200, 200–300, and >300 animals/pen), sampling month (June, July, and August), and type of fed cattle (beef and dairy) at the pen level. Feedlot-level explanatory variables tested included use of a direct fed microbial (DFM, yes vs. no), ration percentage of distiller's grains (<10%, 10–30%, and >30%), feedlot capacity (<25,000 and ≥25,000 animals), and manure storage management (on site or off site). The linearity assumption between continuous predictors and the outcome (on a logit scale) was assessed graphically. If there was evidence of nonlinearity, independent variables were categorized based on quartiles (Dohoo et al., 2009). The Spearman's rank correlation statistic was used to identify possible collinearity between variables; if the value of the correlation was greater than |0.8|, then only one of the variables was selected for inclusion in the multivariable model (Dohoo et al., 2009). All independent variables that were significantly associated with the outcome at p < 0.20 were considered for inclusion in a main effects model. These variables were then fitted in a multivariable model where a manual backward elimination procedure was conducted until only statistically significant (p < 0.05) variables and confounders were kept. Model diagnostics were assessed based on visual examination of best linear unbiased predictors and residual plots. The Tukey–Kramer procedure was used to prevent inflation of Type I error because of multiple comparisons. Model-adjusted means and corresponding 95% confidence intervals were reported.
Covariance parameter estimates for pen and feedlot were evaluated from model intercepts through GLMMs. The outcome variables included the number of samples that tested positive for EHEC O157 or for all non-O157 EHEC serogroups, in independent models. Non-O157 EHEC serogroups were collapsed because of problems of convergence caused by the small number of positives for some of the non-O157 EHEC serogroups. Intraclass correlation coefficients (ICCs) for EHEC O157 and non-O157 EHEC were computed for pens and feedlots (Dohoo et al., 2009) and calculated using the latent variable technique (Dohoo et al., 2009) as follows:
where
Results
Study population and sample collection
The overall one-time feedlot capacity and pen size of the study feedlots ranged from 8000 to 85,000 animals and 30 to 582 cattle/pen, respectively (Table 1). Most of the study feedlots fed beef cattle only (n = 5), one fed dairy cattle only, and two fed both beef and fed dairy cattle. Seventy-five percent (95/126) of the study pens consisted of fed beef and 24.6% (31/126) fed dairy cattle. Three feedlots reported to keep their cattle in the same pens from arrival to the end of the finishing period, two feedlots reported comingling of cattle, and four feedlots combined comingling of cattle in pens with some cattle being kept in the same pen throughout the finishing period.
Type of fed cattle: beef, cross-bred cattle; dairy, Holstein; both dairy and beef.
Manure storage: on site (pen-floor fecal material stored at the feedlot) and off site (pen-floor fecal material is not stored at the feedlot).
Cattle were fed a DFM product as reported by the feedlot manager at each visit: yes (animals received DFM) and no (indicates no DFM was fed).
DFM, direct fed microbial.
The number of DOF of cattle in the study pens ranged from 11 to 382 d (Table 1). Cattle were fed a corn-based finishing diet, representing 34–65% of the as-fed ration, with 87.5% (7/8) of the feedlots utilizing a wet distiller's grain within their ration. DFMs were fed to cattle, from arrival to harvest, in 75% (6/8) of the feedlots (Table 1). Products used included 1 × 10⁹ colony-forming unit (CFU) of Lactobacillus acidophilus strain NP51 and Propionibacterium freudenreichii (Bovamine Defend®; Nutrition Physiology Company, Guymon, OK) or 106 CFU of L. acidophilus strain NP51 and P. freudenreichii (Bovamine Defend ; Nutrition Physiology Company) per cow, daily. Preharvest food safety vaccines for E. coli were not used in any of the study feedlots. Manure management consisted of monthly cleaning (n = 2 feedlots), cleaning after cattle leave the pen (n = 4), and without a specific schedule (n = 2). Manure was stored in stock piles onsite (n = 3 feedlots), stock piles offsite (n = 4), or was composted (n = 1).
A total of 1886 fecal samples were collected from a total of 126 pens (62 pens from study area A and 64 pens from study area B) in 8 feedlots (4 feedlots in each of the study areas) between June and August, 2014 (Table 1). Of the total number of samples (n = 1886), 100% (1886) of samples that were tested for non-O157 EHEC and 73.9% (1393) of samples that were tested for EHEC O157 were included in the analysis. The remaining 26.1% (493) of samples that were tested for EHEC O157 were not utilized in the analysis because of extensive bacterial overgrowth on the CT-SMAC plates that rendered them unreadable. These samples corresponded to all samples (n = 12) from one entire pen of animals (sampled on June 16, 2014), and between 1 and 15 samples, per pen, distributed across 72 other pens (collected across 7 weeks).
Sample-level percentage positives for E. coli O serogroups and EHEC
Out of the total number of fecal samples, 20.4% (384/1886) tested positive for at least one of the six non-O157 serogroups. Serogroup-specific proportion of positives is as follows: 4.6% (86/1886) for O26, 4.7% (88/1886) for O45, 14.1% (266/1886) for O103, 0.4% (7/1886) for O111, 1.8% (34/1886) for O121, and 1.3% (25/1886) for O145. Overall, EHEC (O serogroup + stx1 and/or stx2 + eae) O157 was the most frequently isolated EHEC serogroup (18.7%), whereas fewer samples (3.3%) tested positive for non-O157 EHEC serogroup (Table 2). Among EHEC O157-positive samples, 0.0% (0/260), 56.5% (147/260), and 43.5% (113/260) tested positive for stx1 alone, stx2 alone, and both stx1 and stx2, respectively, whereas for non-O157 EHEC tested positive samples, 79.4% (50/63), 11.1% (7/63), and 9.5% (6/63) tested positive for stx1, stx2, and both stx1 and stx2 virulence genes, respectively.
Study area A comprised four feedlots in a 150-mile radius in northwest Texas and study area B comprised four feedlots in a 100-mile radius in central Nebraska.
Cumulative sample-level percentage positives were calculated as the number of samples that tested positive for each EHEC, divided by the total number of samples tested.
Cumulative pen-level percentage positives were calculated as the number of pens that had at least one positive sample for each EHEC, divided by the total number of pens sampled.
Cumulative feedlot-level percentage positives were calculated as the number of feedlots that had at least one positive sample for each EHEC, divided by the total number of study feedlots.
EHEC, enterohemorrhagic Escherichia coli.
Crude and model-adjusted pen-level prevalence
At the pen level, 62.4% (78/125) and 31.0% (39/126) of the pens had at least one sample testing positive for EHEC O157 and non-O157 EHEC, respectively (Table 2). The crude cumulative prevalence varied greatly between pens. More specifically, the percentage of positive samples within a pen ranged from 0.0% to 12.5% for EHEC O26, 0.0% to 6.5% for EHEC O45, 0.0% to 68.7% for EHEC O103, 0.0% to 33.3% for EHEC O111, 0.0% to 0.0% for EHEC O121, 0.0% to 41.7% for EHEC O145, and 0.0% to 83.3% for EHEC O157. Cumulative model-adjusted (95% confidence intervals) within-pen prevalence estimates of EHEC serogroups were as follows: 0.1% (0.0–4.5%) for EHEC O26, 0.1% (0.0–4.5%) for EHEC O45, 1.5% (0.0–4.5%) for EHEC O103, 0.1% (0.0–5.6%) for EHEC O111, 0.0% (0.0–0.0%) for EHEC O121, 0.5% (0.0–3.8%) for EHEC O145, and 17.2% (14.5–19.9%) for O157 (Fig. 1).
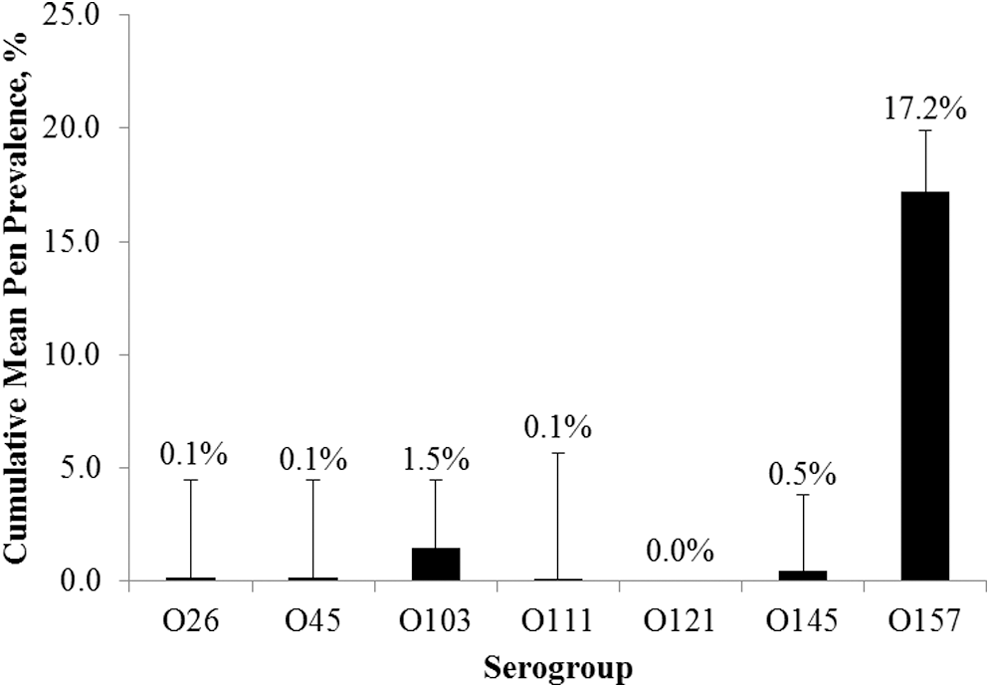
Cumulative model-adjusteda within-pen prevalence estimates of EHEC O26, O45, O103, O111, O121, O145, and O157 in cattle feces. Error bars indicate the upper limit of the 95% confidence interval of model-adjusted prevalence mean estimates.
Crude and model-adjusted feedlot-level prevalence
All study feedlots (n = 8) had at least one fecal sample testing positive for EHEC O157 or non-O157 EHEC. EHEC serogroup-specific crude prevalence percentages are as follows: 0.0% for EHEC O121; 25.0% for EHEC O26, O45, and O111; 62.5% for EHEC O145; and 100.0% for EHEC O103 and O157 (Table 2). Model-adjusted mean within-pen prevalence estimates for EHEC O157 varied significantly (p < 0.01) by feedlot; however, no significant differences (p > 0.05) were observed for prevalence of non-O157 EHEC serogroups among feedlots (Table 3).
From GLMMs using a binomial distribution, logit link, fixed effect for feedlot, and random effect for sampling week.
GLMM, generalized linear mixed model; SEM, standard error of the mean.
Crude and model-adjusted study area prevalence
Each study area had at least one fecal sample testing positive for EHEC O157 or non-O157 EHEC. Cumulative model-adjusted (95% confidence intervals) within-pen prevalence estimates by study area are as follows: 16.2% (9.1–27.2%) for EHEC O157 and 2.7% (1.2–6.1%) for non-O157 EHEC in study area A, whereas study area B prevalence estimates were 18.5% (10.6–30.3%) for EHEC O157 and 2.1% (1.0–4.9%) for non-O157 EHEC. However, there were no significant differences in the prevalence of EHEC O157 (p = 0.71) and non-O157 EHEC (p = 0.56) between study areas.
Evaluation of pen- and feedlot-level risk factors
Pen-level variables significantly associated with the within-pen prevalence estimates of EHEC O157 and non-O157 EHEC (all non-O157 grouped) based on univariable analyses (p < 0.20) included sampling month, size of the pen, and sex composition of the pen for EHEC O157, and sampling month and sex composition of the pen for the non-O157 EHEC outcome (Table 4). Only sampling month remained significantly associated (p < 0.01) with the within-pen prevalence of EHEC O157 in the final model. Cumulative model-adjusted within-pen prevalence estimates (95% confidence intervals) for EHEC O157 were 35.4% (22.1–51.4%) for June, 11.4% (6.3–19.8%) for July, and 18.6% (10.7–30.4%) for August, with significant within-pen prevalence differences between June and July (p < 0.01), June and August (p < 0.01), and July and August (p < 0.01). Sampling month (p < 0.01) and sex composition of the pen (p = 0.02) were significantly associated with the within-pen prevalence of non-O157 EHEC. Model-adjusted within-pen prevalence estimates (95% confidence intervals) for non-O157 EHEC were 2.8% (1.1–7.1%) for June, 1.5% (0.6–3.7%) for July, and 0.6% (0.1–1.8%) for August, with significant within-pen prevalence differences between June and July (p = 0.03), June and August (p < 0.01), and July and August (p = 0.04). Model-adjusted within-pen prevalence estimates (95% confidence intervals) for non-O157 EHEC were 1.1% (0.3–3.8%) for heifer-based pens, 3.1% (1.3–7.1%) for steer-based pens, and 0.5% (0.2–2.8%) for mixed pens (i.e., both steers and heifers), with significant within-pen prevalence differences between steer and mixed pens (p = 0.02).
From GLMMs using a binomial distribution and logit link.
GLMM included a fixed effect for month and a random intercept for feedlot within study area.
GLMM included a fixed effect for sex composition of the pen and random intercepts for sampling week and feedlot within study area.
GLMM included a fixed effect for pen size and random intercepts for sampling week and feedlot within study area.
CI, confidence interval.
With non-O157 EHEC, separate models were fitted for EHEC O103 and O145. Model-adjusted mean within-pen prevalence varied significantly by month for EHEC O103 (p = 0.03) and EHEC O145 (p < 0.01). Within-pen prevalence estimates (95% confidence intervals) for EHEC O103 were 0.1% (0.0–1.7%) for June, 2.1% (1.0–4.4%) for July, and 2.4% (1.1–5.4%) for August, with significant within-pen prevalence differences between June and August (p = 0.01) and between July and August (p = 0.02). Within-pen prevalence estimates (95% confidence intervals) for EHEC O145 were 1.5% (0.0–4.7%) for June, 0.2% (0.0–1.0%) for July, and 0.2% (0.0–1.6%) for August, with a significant difference in within-pen prevalence between June and July (p < 0.01).
None of the feedlot-level demographic or management variables (DFM, distiller's grains percentage, feedlot capacity, and manure management) were significantly associated with the cumulative within-pen prevalence of EHEC O157 and non-O157 EHEC by feedlot in univariable analyses (all p values >0.20).
Intraclass correlation coefficients
The ICC describing the correlation between fecal samples within pens for EHEC O157 was 0.26, and was 0.31 for non-O157 EHEC, indicating that most of the variability occurred between pens rather than within pens. The ICC for EHEC O157 (0.08) and non-O157 EHEC (0.04) for samples within feedlots indicated that most of the variability occurred within rather than between feedlots. ICCs for individual non-O157 EHEC serogroups (O26, O45, O103, O111, O121, and O145) were not computed because of lack of model convergence.
Discussion
Our findings provide insight into the regional-, feedlot-, and pen-level differences of EHEC-7 shedding in cattle feces, which enhances our knowledge of the epidemiology and distribution of EHEC in the feedlot environment and provides a better understanding of the level at which preharvest interventions could be effective. By lowering the pathogen load before harvest, transmission along the contamination pathway (i.e., fecal to hide to carcass pathway) can be reduced. In this study, all study feedlots had at least one sample positive for EHEC O157 and non-O157. Furthermore, ∼31% of the study pens had one or more fecal samples that tested positive for non-O157 EHEC, whereas 62% of pens tested positive for EHEC O157. Although recently multiple studies have reported non-O157 EHEC fecal prevalence in cattle (Cernicchiaro et al., 2013; Baltasar et al., 2014; Ekiri et al., 2014; Paddock et al., 2014; Dewsbury et al., 2015; Stanford et al., 2016), the current study provides the most comprehensive assessment of feedlot- and pen-level prevalence of EHEC-7 serogroups in feces of commercial feedlot cattle, before harvest, from several feedlots in two main U.S. cattle feeding areas.
Although there are slight differences between demographic and management characteristics of study feedlot operations, we believe these operations are representative of commercial feedlot operations in the region. The low prevalence of non-O157 EHEC found in our study pens is consistent with findings from recent reports in summer-fed commercial feedlot cattle, despite key differences in diagnostic methods, case definitions, and study populations (Cernicchiaro et al., 2013; Dargatz et al., 2013; Baltasar et al., 2014; Ekiri et al., 2014; Dewsbury et al., 2015). Other potential reason for the observed low within-pen prevalence includes possible microbial stress because of temperature changes during sample collection and/or transportation.
Twenty-six percent of samples that were tested for EHEC O157 were unreadable because of microbial overgrowth and were not included in the analysis. When not all samples or observations can be included in the analysis, results may be biased; however, our prevalence and risk factor analyses were conducted at the pen level, as binomial outcomes (events/trials). Hence, estimates of prevalence account for the total number of test positive samples over the total number of samples tested in each pen, and as such, confidence intervals for pens where fewer samples were tested for EHEC O157 are wider, accounting for the smaller sample size.
To date, the published literature has indicated well-established diagnostic methods for detection of EHEC O157 (Omisakin et al., 2003; LeJeune et al., 2006; Fox et al., 2008); however, given the lack of a reference method of detection for non-O157 EHEC, and the potential limitation of currently available tests in terms of sensitivity of detection, several diagnostic methods are used, which makes the comparison of prevalence estimates across studies challenging (Bettelheim, 2007; Cernicchiaro et al., 2013; Baltasar et al., 2014; Ekiri et al., 2014; Dewsbury et al., 2015; Noll et al., 2016). In this study, we used a selective medium (Possè et al., 2008), evaluated and validated for the isolation and identification of non-O157 STEC (Paddock et al., 2014; Noll et al., 2015; Stromberg et al., 2015 and 2016) and pooled IMS beads. As reported by Noll et al. (2016), pooling IMS beads resulted in higher throughput of samples, and a less labor-intensive procedure that has shown to have similar detection capabilities than single IMS bead procedures.
To our knowledge, there are only a few studies that have reported prevalence estimates for EHEC-7 from several commercial feedlot operations in the United States. This study demonstrated that the overall frequency of detection of non-O157 EHEC was three times lower than EHEC O157 among pens. Moreover, as also seen in previous studies (Cernicchiaro et al., 2013; Dargatz et al., 2013; Baltasar et al., 2014; Ekiri et al., 2014; Dewsbury et al., 2015), prevalence varied greatly between pens in all study feedlots for both non-O157 EHEC and EHEC O157. Although a multifeedlot (n = 21) and multistate (n = 4) study reported fecal prevalence of EHEC-7 (Dargatz et al., 2013), prevalence was based on pooled samples from up to 40 animals before PCR-only confirmation that identifies serogroup only, not STEC. In our study, we utilized individual fecal pats that were tested for the presence of EHEC-7 by both culture and PCR methods.
Despite the fact that multiple risk factors for STEC O157 prevalence have been identified in commercial feedlot cattle (Sargeant et al., 2004; Renter et al., 2005; Smith et al., 2005; Fox et al., 2008; Callaway et al., 2014; Smith, 2014), associations between those risk factors with non-O157 STEC prevalence have not been yet demonstrated (Smith, 2014). In this study, significant differences in fecal prevalence between June, July, and August were identified for EHEC O157, EHEC O103, and EHEC O145. Although variation in prevalence of STEC O157 has been reported in weeks within a season (Renter et al., 2005; Smith et al., 2005), the reason behind this phenomenon is still unknown. The temporal effects of EHEC shedding in cattle cohorts may be attributed to animal housing, pen, precipitation, and temperature conditions at time of sample collection. In addition, our study found significant differences in the overall non-O157 EHEC prevalence based on the sex composition of the study pens. Potential environmental disturbances (e.g., stress, behavioral dynamics, and dietary differences) affecting cattle in pens of mixed sex composition may modify conditions of their lower gastrointestinal tract, allowing non-O157 EHEC to outcompete other organisms. In contrast, feedlot management factors were not significantly associated with the prevalence of EHEC-7 serogroups, likely because of either the small number of feedlots sampled (n = 8) or perhaps because most of the variability occurred within versus between feedlots, which prevented us from detecting significant differences. However, given the cross-sectional nature of our study design, we are unable to separate factors that are associated with the establishment of new EHEC infections or their duration.
Variance components indicated a higher variability between than within pens for both fecal prevalence of non-O157 EHEC and EHEC O157; for feedlots, the variability was higher within than between feedlots. Hence, preharvest interventions targeted at the pen level would likely have higher impact on EHEC-7 fecal shedding than those targeted at the feedlot level. Management factors such as size and gender composition of the pen, manure management, diet, location, and characteristics of the pen (e.g., slope of the pen surface and orientation) within the feedlot are specific to the pen and they can vary across pens within a feedlot.
To target specific pens, the manager would need prior information regarding EHEC status. However, we consider that by identifying potential risk factors and controlling/modifying those in all relevant pens, feedlot managers can decrease prevalence of EHEC without prior knowledge of prevalence status. Although Sargeant et al. (2004) reported similar results for pen and feedlot of STEC O157, the effects of non-O157 STEC have not been reported.
We found a widespread distribution of EHEC-7 in feces from cohorts of finishing cattle fed during the summer months, with EHEC O157, O103, and O145 being the serogroups most frequently detected in this study population. Furthermore, sampling month and sex composition of the pen were identified as potential risk factors for non-O157 EHEC and EHEC O157. Thus, the potential combination of preharvest interventions and pen-level management strategies may have positive food safety impacts. Moreover, data on preharvest fecal prevalence at different hierarchical levels provide necessary estimates to input into quantitative risk assessment models to assess potential human risks associated with EHEC-7 along the beef chain.
Footnotes
Acknowledgments
This material is based on work that was supported by the National Institute of Food and Agriculture, U.S. Department of Agriculture, under award number 2012-68003-30155 (STEC CAP grant), and by the College of Veterinary Medicine, Kansas State University. Additional thanks are given to Neil Wallace, Xiaorong Shi, Sailesh Menon, participating feedlots, and students from West Texas A&M University and Kansas State University.
Disclosure Statement
No competing financial interests exist.