




Abstract
We investigated the contribution of litter to the occurrence of Campylobacter on three broiler farms, which were known to have low (LO) and high (HI-A and HI-B) Campylobacter prevalence. For this purpose, we collected litter samples (n = 288) during and after two rearing cycles from each farm. We evaluated the occurrence of Campylobacter (using selective enrichment and quantitative real-time polymerase chain reaction [q-PCR] analysis) in the litter samples as well as the litter's pH and moisture content. Ceca from each flock (n = 144) were harvested at slaughter age and used to quantify Campylobacter colony-forming units (CFUs). Campylobacter was only retrieved from 7 litter samples that were collected from HI-A and HI-B during the growing period, but no Campylobacter was isolated from LO farms. The q-PCR analysis detected Campylobacter in pooled litter samples from all three farms. However, in litter collected during the same rotation, Campylobacter levels were significantly higher (p < 0.05) in HI-A and HI-B litter samples in comparison to those in LO. Cecal samples from HI-A and HI-B yielded relatively high numbers of Campylobacter CFUs, which were undetectable in LO samples. Litter's pH and moisture did not affect the overall occurrence of Campylobacter in litter and ceca on any of the farms. Our data suggest that Campylobacter was generally more abundant in litter that was collected from farms with highly colonized flocks. Therefore, better approaches for assessing the occurrence of Campylobacter in litter might be warranted in order to reduce the dissemination of these pathogens on and off poultry farms.
Introduction
B
The ability of some of these pathogens to persist in multiple environments and hosts and their complex biology have placed them among the most problematic pathogens in food animal production, including poultry production. Of particular concern in broiler production is the proliferation of Campylobacter spp. (mainly Campylobacter jejuni and Campylobacter coli) that have been a leading cause of foodborne gastroenteritis worldwide (Sahin et al., 2015; Kassem et al., 2016a). Campylobacter colonizes the chicken gut in high numbers (106–108 colony-forming units [CFUs], per gram of cecal content) and can survive for prolonged periods in reused litter in comparison to fresh and partially used litter (Kassem et al., 2010). Consequently, Campylobacter can readily contaminate broiler chickens and subsequent carcasses during processing; and campylobacteriosis has been frequently linked to the consumption of contaminated and undercooked poultry products (Allos, 2001; Sahin et al., 2015; Kassem et al., 2016a). The absence of commercially available vaccines and the high adaptation of Campylobacter to the chicken environment necessitate an investigation into management practices that might affect important on-farm Campylobacter reservoirs, including litter.
It is a common practice in the United States to employ built-up/reused litter for rearing multiple broiler flocks (Wheeler et al., 2008). In comparison to the complete replacement of litter between each growth cycle, reusing litter might be attractive because of the rising cost of litter material, its decreasing availability, and environmental impacts associated with the disposal of used litter (such as land applications and subsequent phosphorus runoff) (White et al., 2009). Furthermore, because of the high nutrient content, litter can be used as animal feed or as an organic fertilizer for soil amendments in agricultural lands (Moore et al., 1995; Gerber et al., 2007). The latter is notable when considering the large amounts of litter/manure that can be produced in modern broiler production. For example, in the United States, it is estimated that 41.1 billion pounds of ready-to-cook broiler meat will be produced in 2017, which is significantly higher than the 1.4 billion pounds that was generated in 1950 (National Chicken Council, 2016). Subsequently, it is not surprising that more than 14 million tons of chicken litter is estimated to be produced annually in the United States (Chen et al., 2015). Therefore, the removal, storage, and postfarm applications of contaminated litter can potentially pose environmental and public health risks through offsite transport of chemicals and potential pathogens, including Campylobacter (Piddock et al., 2000; Cook et al., 2006). Consequently, the judicious management of litter is necessary both during broiler production and waste disposal.
Although poorly managed litter has been established as a potential Campylobacter reservoir, it should be noted that the assessment of litter contamination with these pathogens using traditional culturing techniques might result in false negatives (Pearson et al., 1993; Kassem et al., 2010; Smith et al., 2016). For example, real-time polymerase chain reaction (PCR) analysis and indirect fluorescent antibody tests indicated the occurrence of Campylobacter in high numbers (1 · 8 × 106–2 · 4 × 107 cells g−1) in litter samples that were negative using traditional culturing techniques (Pearson et al., 1993; Cook et al., 2006). While this might be partially explained by the ability of Campylobacter to form viable, but nonculturable cells (VBNCs) (Rollins and Colwell, 1986; Kassem et al., 2013), it also suggests that the role of litter as a reservoir of Campylobacter might be underestimated. Certainly, some culture-based studies reported that Campylobacter spp. were not isolated from used litter that was collected from positive broiler houses (Jacobs-Reitsma et al., 1995; Zweifel et al., 2008). Underestimation of the role of litter in Campylobacter dissemination might have serious consequences, because of (1) the aforementioned risks associated with using contaminated litter in a variety of on- and off-farm applications and (2) misinformation that might adversely impact litter management practices. Therefore, in this study, our objective was to investigate the occurrence of Campylobacter in built-up litter on broiler farms under common management practices. For this purpose, we used traditional culturing techniques and quantitative real-time polymerase chain reaction (q-PCR) analysis to assess Campylobacter loads in litter samples from 3 broiler farms, which were previously known to have low and high Campylobacter prevalence. We also monitored the pH and moisture content of the litter and Campylobacter loads in cecal samples from the subsequent flocks. Our results highlighted the need to better assess and control the risks associated with litter in dissemination of Campylobacter between flocks and the off-farm environment.
Materials and Methods
Farm properties and sampling scheme
We selected three commercial broiler farms for this study based on the following: (1) Campylobacter prevalence was known to be low on one farm (LO) and high on the other two farms (HI-A and HI-B), (2) each farm had four same-size grow-out houses with a similar number of birds (about 20,000 birds/house and a stocking density of 0.075 square meter per bird), and (3) all the farms had identical litter management practices with ∼2 weeks downtime and in situ drying of litter by hot air (∼34°C) 48 h before the introduction of the new flocks. The farms were monitored during two rearing/grow-out cycles (R1 and R2) and two downtime periods (D1 and D2) that directly preceded the introduction of the flocks. Pooled litter samples (∼500 g) were collected from each house (six pooled samples per house, two samples from the front, middle, and end of the house, respectively) immediately before the introduction and at the removal (slaughter) of the flocks (total number of litter samples = 288). Cecal samples (n = 144) were aseptically collected (six cecal samples per house/flock) at slaughter. The samples were transported to the laboratory on ice and processed within 24 h after receiving.
Measurement of litter pH and moisture content
Litter pH and moisture contents were measured as described in Chinivasagam et al., (2012) with minor modification. For pH, 1 g of each litter sample was suspended in 10 mL 1 × phosphate-buffered saline (PBS, pH = 7 · 0). The suspensions were mixed using a vortex for 30 s and left standing for 15 min. The pH was then measured using a calibrated pH meter (Accumet™ AB15 Basic pH meter, Fisher Scientific). For moisture content, 2 g of each litter sample was placed in an incubator ( ∼45°C) for 48 h and the dry weight was measured. The moisture content (%) was calculated using the following equation: (wet–dry weight) × 100/wet weight.
Culture-based enrichment of litter and enumeration of Campylobacter in cecal samples
To qualitatively detect Campylobacter in litter, 1 g of each litter sample was suspended in 9 mL Preston enrichment broth that contained Campylobacter growth supplements (SR0117 and SR0232; Oxoid) (Williams et al., 2012; Kassem et al., 2016b). The suspensions were enriched under microaerobic conditions (5% O2, 10% CO2, and 85% N2) at 42°C for 48 h. An aliquot of each enrichment (100 μL) was spread onto modified charcoal cefoperazone deoxycholate agar (mCCDA) plates that contained a Campylobacter selective supplement (SR0015, Oxid). After incubation under microaerobic conditions for 48 h, the plates were inspected for Campylobacter colonies (Kassem et al., 2010; Williams et al., 2012).
To enumerate Campylobacter in cecal samples, the ceca were weighed and suspended in 5 mL sterile 1 × PBS. The samples were homogenized for 30–60 s and serially diluted 10-fold in 1 × PBS. Aliquots (100 μL) were spread onto mCCDA plates, which were then incubated at 42°C under microaerobic conditions. After 48 h, Campylobacter CFU were counted and the numbers were reported per gram of cecal content (Kassem et al., 2014).
Detection of Campylobacter in litter using q-PCR
Litter samples (5 g) from each farm were pooled to obtain three separate litter samples that represented a farm and a sampling event. For example, litter samples from LO at R1 (n = 24) were combined into 3 pooled litter samples. Specifically, the 24 samples were equally divided into 3 separate groups (8 samples/group), which were then individually subsampled to produce the final 3 representative pooled samples. Subsequently, DNA from the pooled litter samples from all the farms (n = 36) was isolated using the FastDNA™ SPIN Kit for soil (MP Biomedicals) as described by the manufacturer. The quality and quantity of the DNA were determined using a spectrophotometer (Nanodrop, Thermo scientific). DNA (50 ng per reaction), primers targeting a Campylobacter-specific 16S rRNA gene fragment, and the SensiMixPlus SYBR RT-PCR Kit (Quantace) were used in the q-PCR reactions (Kassem et al., 2014; Kashoma et al., 2016). C. jejuni 81–176 (wild type) and reactions with no DNA template were used as positive and negative controls, respectively. To transform Ct values to a proxy of CFU numbers, a standard curve was constructed by using litter (autoclaved thrice, subjected to UV, and tested by q-PCR for residual Campylobacter contamination) that was then spiked with serial 10-fold dilutions of predetermined C. jejuni 81–176 CFU numbers (108–103 CFU/g litter) (Gosselin-Théberge et al., 2016). The spiked litter was processed for DNA and analyzed by q-PCR as described earlier. The estimated CFU numbers were averaged from the analysis of three samples per farm per sampling event.
To check for specificity, we assessed the melting curves for the q-PCR products, which were also resolved using electrophoresis in 1% agarose gels that contained ethidium bromide. A 1Kb DNA ladder (Promega) was used to determine the size of the amplicons from each sample, which were also compared to amplicons generated from positive controls.
Statistics
Data were expressed as mean ± standard deviation and one-way analysis of variance followed by Tukey's post-test and the Mann–Whitney rank sum test were used in statistical analysis. CFU data obtained by culturing or derived from qPCR were normalized using log10-transformation before analysis. A p value of <0.05 was considered statistically significant.
Results and discussion
Campylobacter CFUs were detected in all the cecal samples that were collected from HI-A and HI-B (Fig. 1), indicating that Campylobacter occurred in every house and flock on these farms. The average number of Campylobacter CFUs was not statistically different between the houses on these farms (p > 0.05). Furthermore, Campylobacter CFUs were not detected in cecal samples from LO samples. These results confirmed the previous observations on the low and high prevalence of Campylobacter on these farms and were consistent with studies that reported that these bacteria can occur in 100% of the flocks on contaminated broiler farms (Shreeve et al., 2000). High prevalence on contaminated farms can be explained by the ability of Campylobacter to be rapidly transmitted between birds, contaminating an entire flock within days after the onset of colonization (Shreeve et al., 2000).
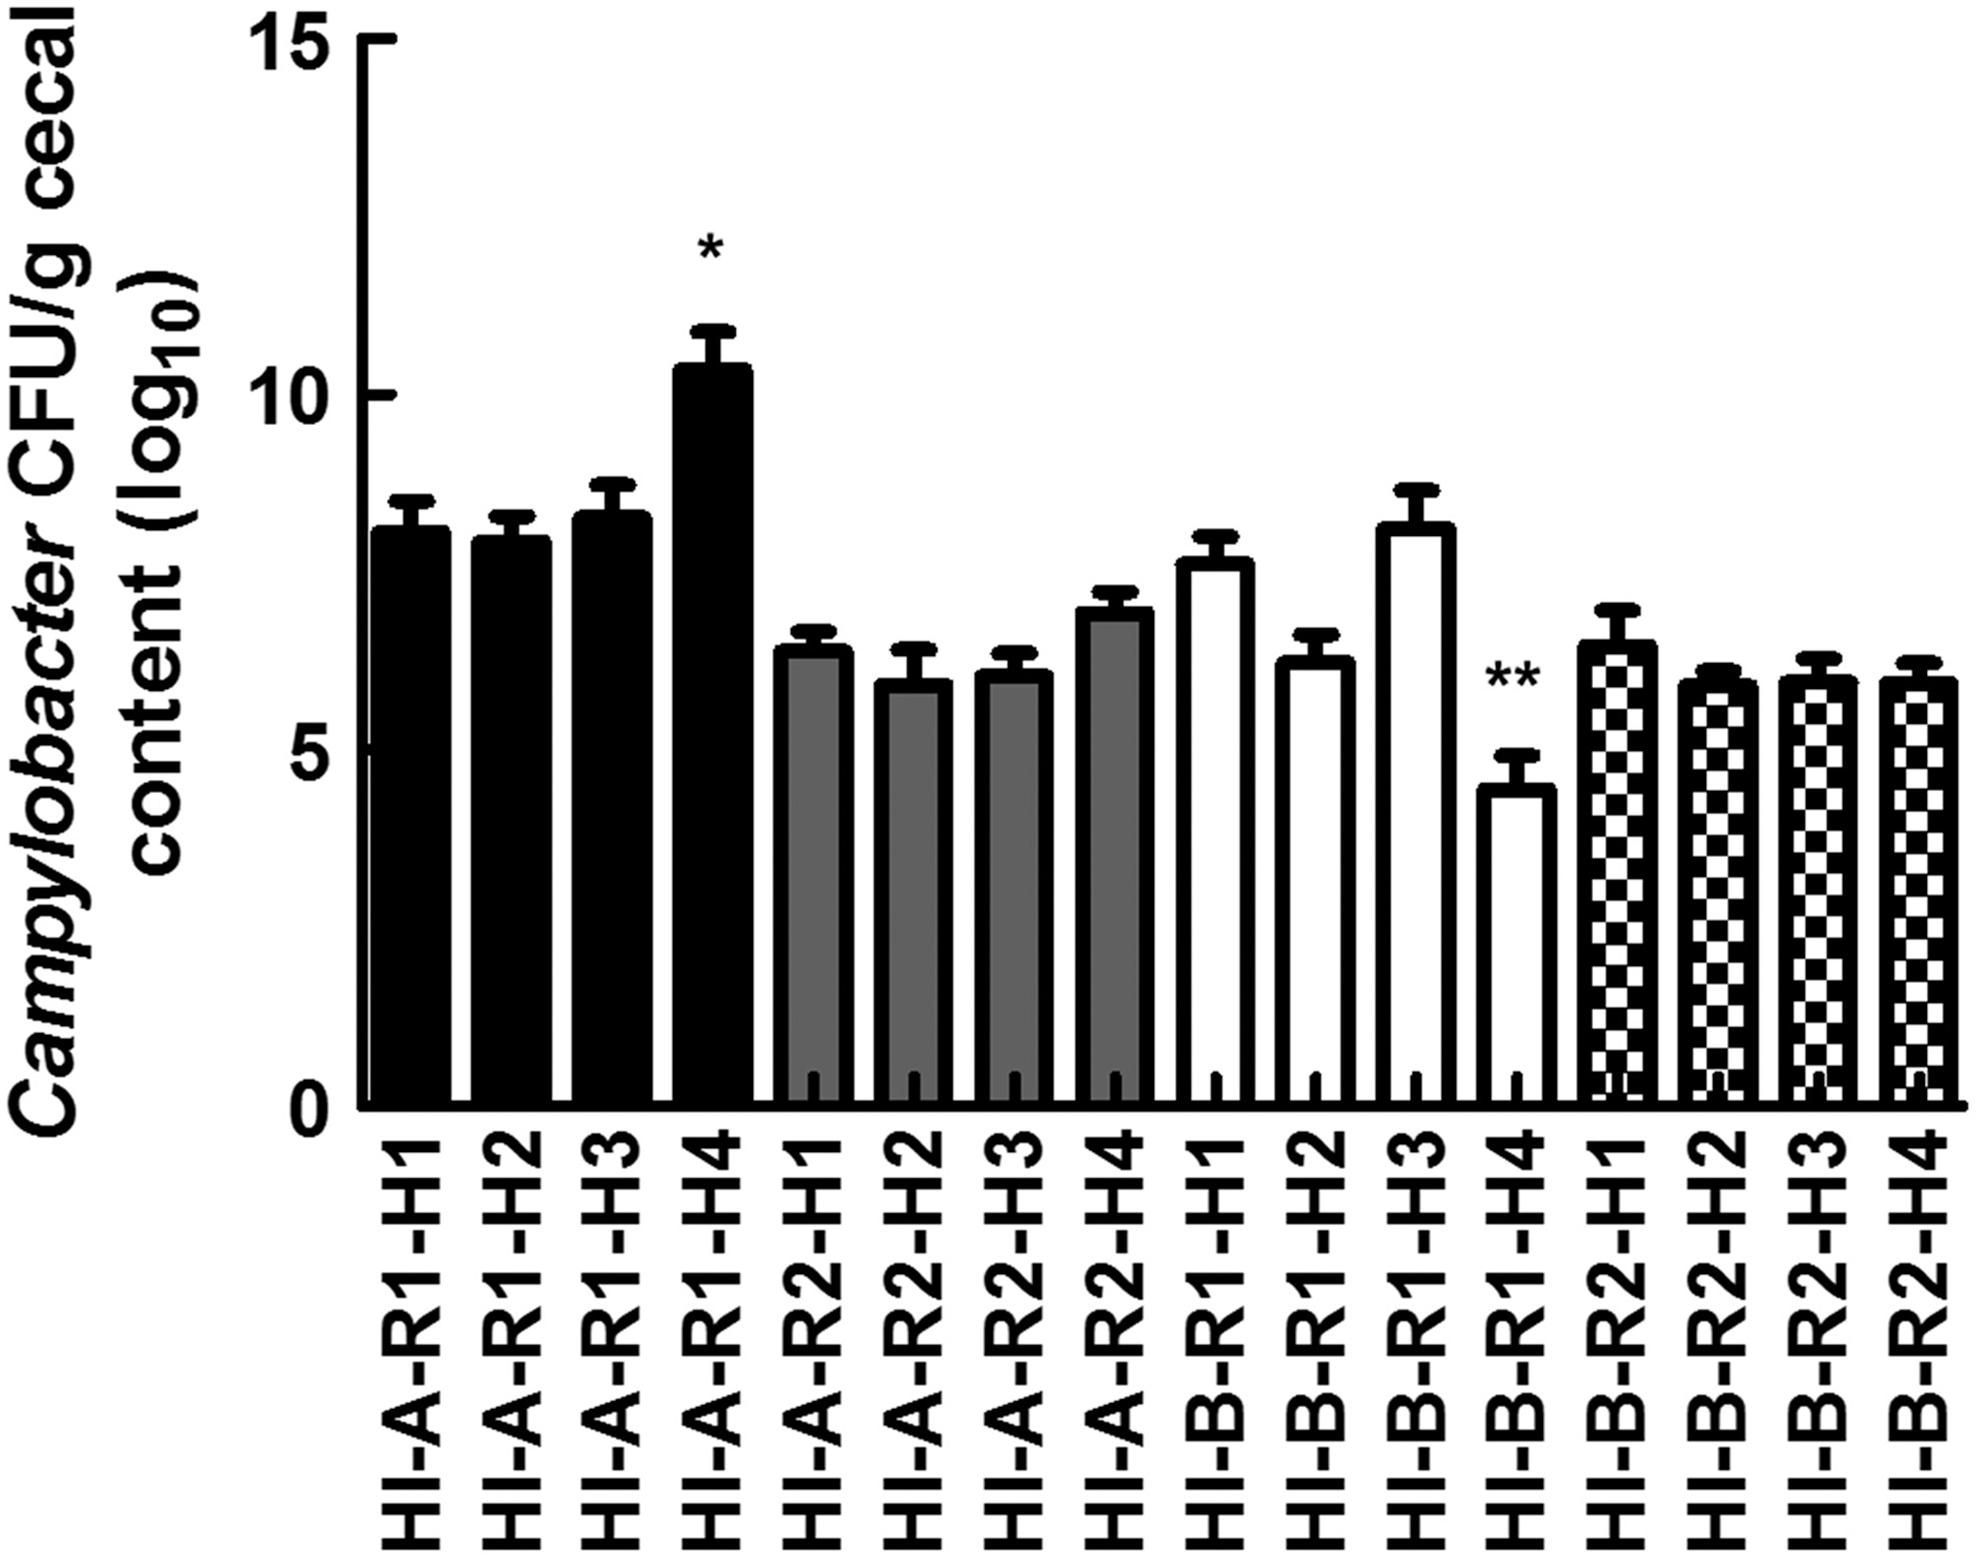
Enumeration of Campylobacter in cecal sample using serial dilution and spreading onto mCCDA plates. Each data point represents the average of Campylobacter CFUs per g cecal content from six individual slaughter-age chickens per house/flock. HI-A and HI-B: high prevalence farms; R: grow-out cycle; H: broiler house. * and ** indicate the significantly highest and lowest means, respectively (p < 0.05). CFUs, colony-forming units; mCCDA, modified charcoal cefoperazone deoxycholate agar.
Enrichment and selective plating showed that only 7 litter samples from H1-A and H1-B during the grow-out phase were Campylobacter positive (Table 1). Therefore, it initially appeared that litter was not a major source of Campylobacter on these high prevalence farms. While these results aligned with some culture-based studies that did not detect Campylobacter in litter from contaminated farms (Jacobs-Reitsma et al., 1995; Zweifel et al., 2008), they contradicted the role of litter as a potential risk factor for the transmission and proliferation of Campylobacter in flocks (Berndtson et al., 1996; Newell and Fearnley, 2003; Robyn et al., 2015; Smith et al., 2016). One possible explanation for this discrepancy might be associated with the properties of the litter. For example, wetness of the litter and its pH might promote the survival of Campylobacter in used litter (Berndtson et al., 1996; Line and Bailey, 2006; Line, 2006; Kassem et al., 2010). Therefore, we measured the pH and moisture content of the litter samples. The pH in all litter samples ranged between ∼7.2 and 8.5 (Fig. 2A), which was well in the pH range (4.9–9.0) that does not inhibit Campylobacter. The average moisture content was significantly lower (p < 0.05) in LO-D2 samples in comparison to all other samples (Fig. 2B), while it was the highest in samples from HI-B-R1 (Fig. 2B). However, there was no significant difference in the moisture content when samples from LO-R1 and LO-D1 were compared to those from HI-A-D1, HI-A-R2, HI-A-D2, HI-B-D1, and HI-B-D2, respectively. Similarly, moisture content LO-R2 was comparable to that in HI-A-R1, HI-A-R2, HI-B-R1, and HI-B-R2. Notably, the litter samples that were Campylobacter positive belonged to HI-A-R1, HI-B-R1, and HI-B-R2 that had relatively higher moisture content. However, Campylobacter was only retrieved from a subset of these samples, despite the remarkably similar moisture content in all samples from HI-A-R1, HI-B-R1, and HI-B-R2. Based on these observations, it might be concluded that the pH and moisture content might not have directly affected/explained the low occurrence of Campylobacter in enriched litter samples. Previous studies have reported that Campylobacter might not be readily detected in litter using traditional culturing techniques (Pearson et al., 1993; Kassem et al., 2010; Smith et al., 2016). This is plausible because Campylobacter has been shown to form VBNCs, which, by definition, cannot be cultured and allow the bacteria to prolong their survival under adverse conditions (Rollins and Colwell, 1986; Gangaiah et al., 2009; Kassem et al., 2013). Whether VBNCs are capable of resuscitating and infecting the host is debatable (Kassem et al., 2013), but this raises the possibility that Campylobacter might be occurring in litter samples in a nonculturable state.
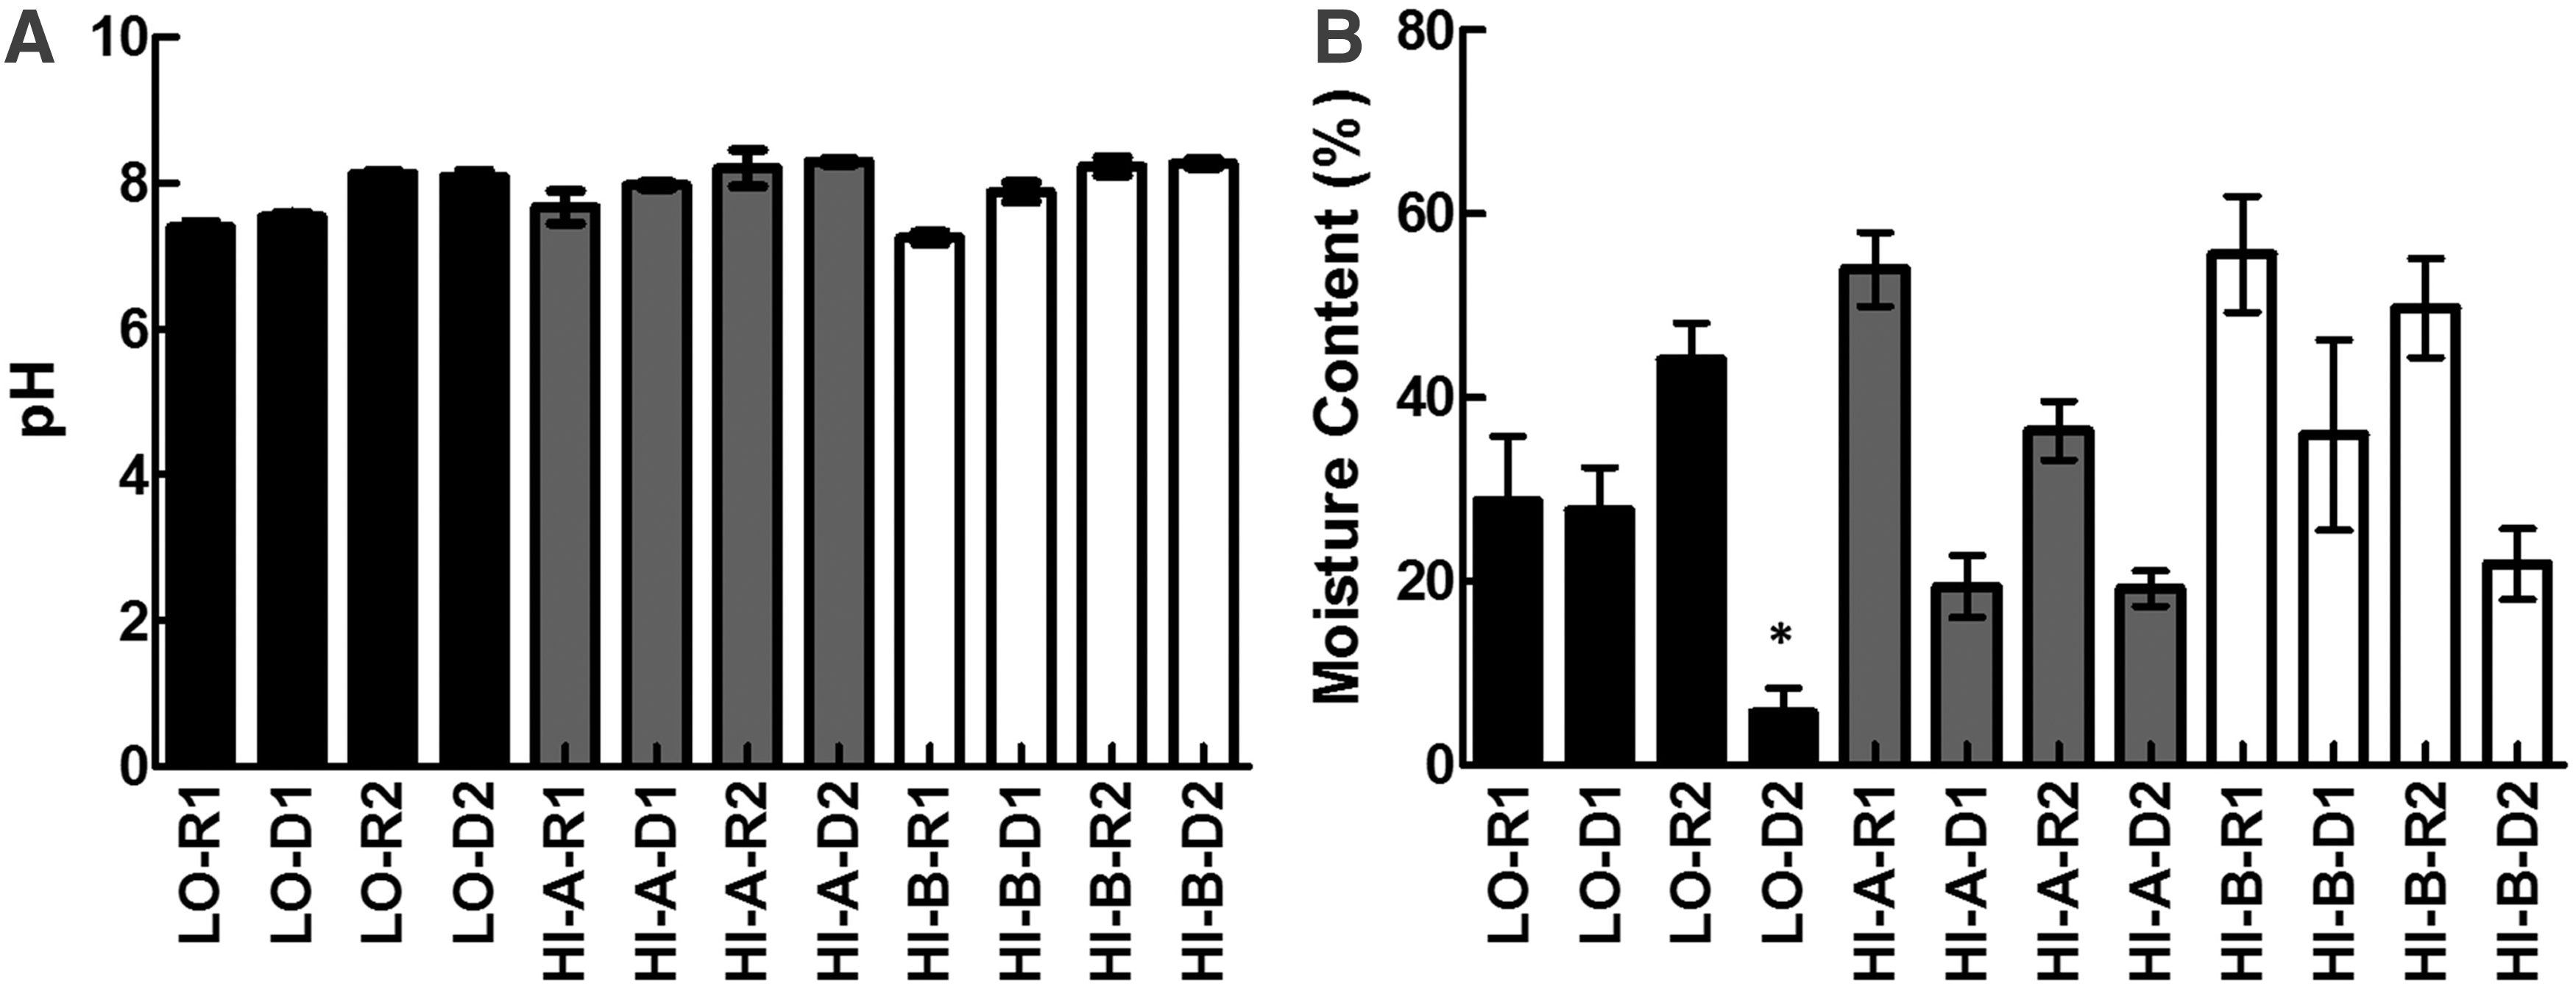
LO, Low prevalence farm; HI-A and HI-B, high prevalence farms; R, grow-out cycle; D, downtime (no flocks).
To gain further insights, we performed q-PCR analysis that targeted Campylobacter in the litter samples. Interestingly, Campylobacter signals were readily detected in all litter samples from the high prevalence farms. Using standard curves, the estimated CFU numbers of Campylobacter in litter samples collected during the same rotation stages were significantly higher (p < 0.05) in HI farms in comparison to LO (Fig. 3). The detection of DNA by the q-PCR analysis might represent both nonviable cells and VBNCs, which has significant implications for the role of litter as a reservoir for Campylobacter. It should be noted that the DNA was detectable in relatively high abundance with a strong and specific q-PCR signal, even in samples collected during the 2-week downtime period after the removal of the flocks. Regardless, the detection of Campylobacter in litter using q-PCR analysis should be evaluated further to better assess the contribution of litter to the transmission of Campylobacter in broiler farms. Previous studies have attempted to control Campylobacter in broiler farms by the acidification of litter with aluminum sulfate and sodium bisulfate; pH-reducing agents are also commonly used to reduce ammonia emissions (Line and Bailey, 2006). However, these chemicals only caused a slight delay in Campylobacter colonization of broiler chickens and did not significantly reduce the pathogen on whole carcasses at the end of production. It was concluded that using these chemicals reduced the litter pH only for a limited time during the grow-out phase, after which the effect on the pH was lost (Line and Bailey, 2006). Using q-PCR analysis in these studies might have led to a better assessment of the impact of acidification on the overall survival of Campylobacter in litter.
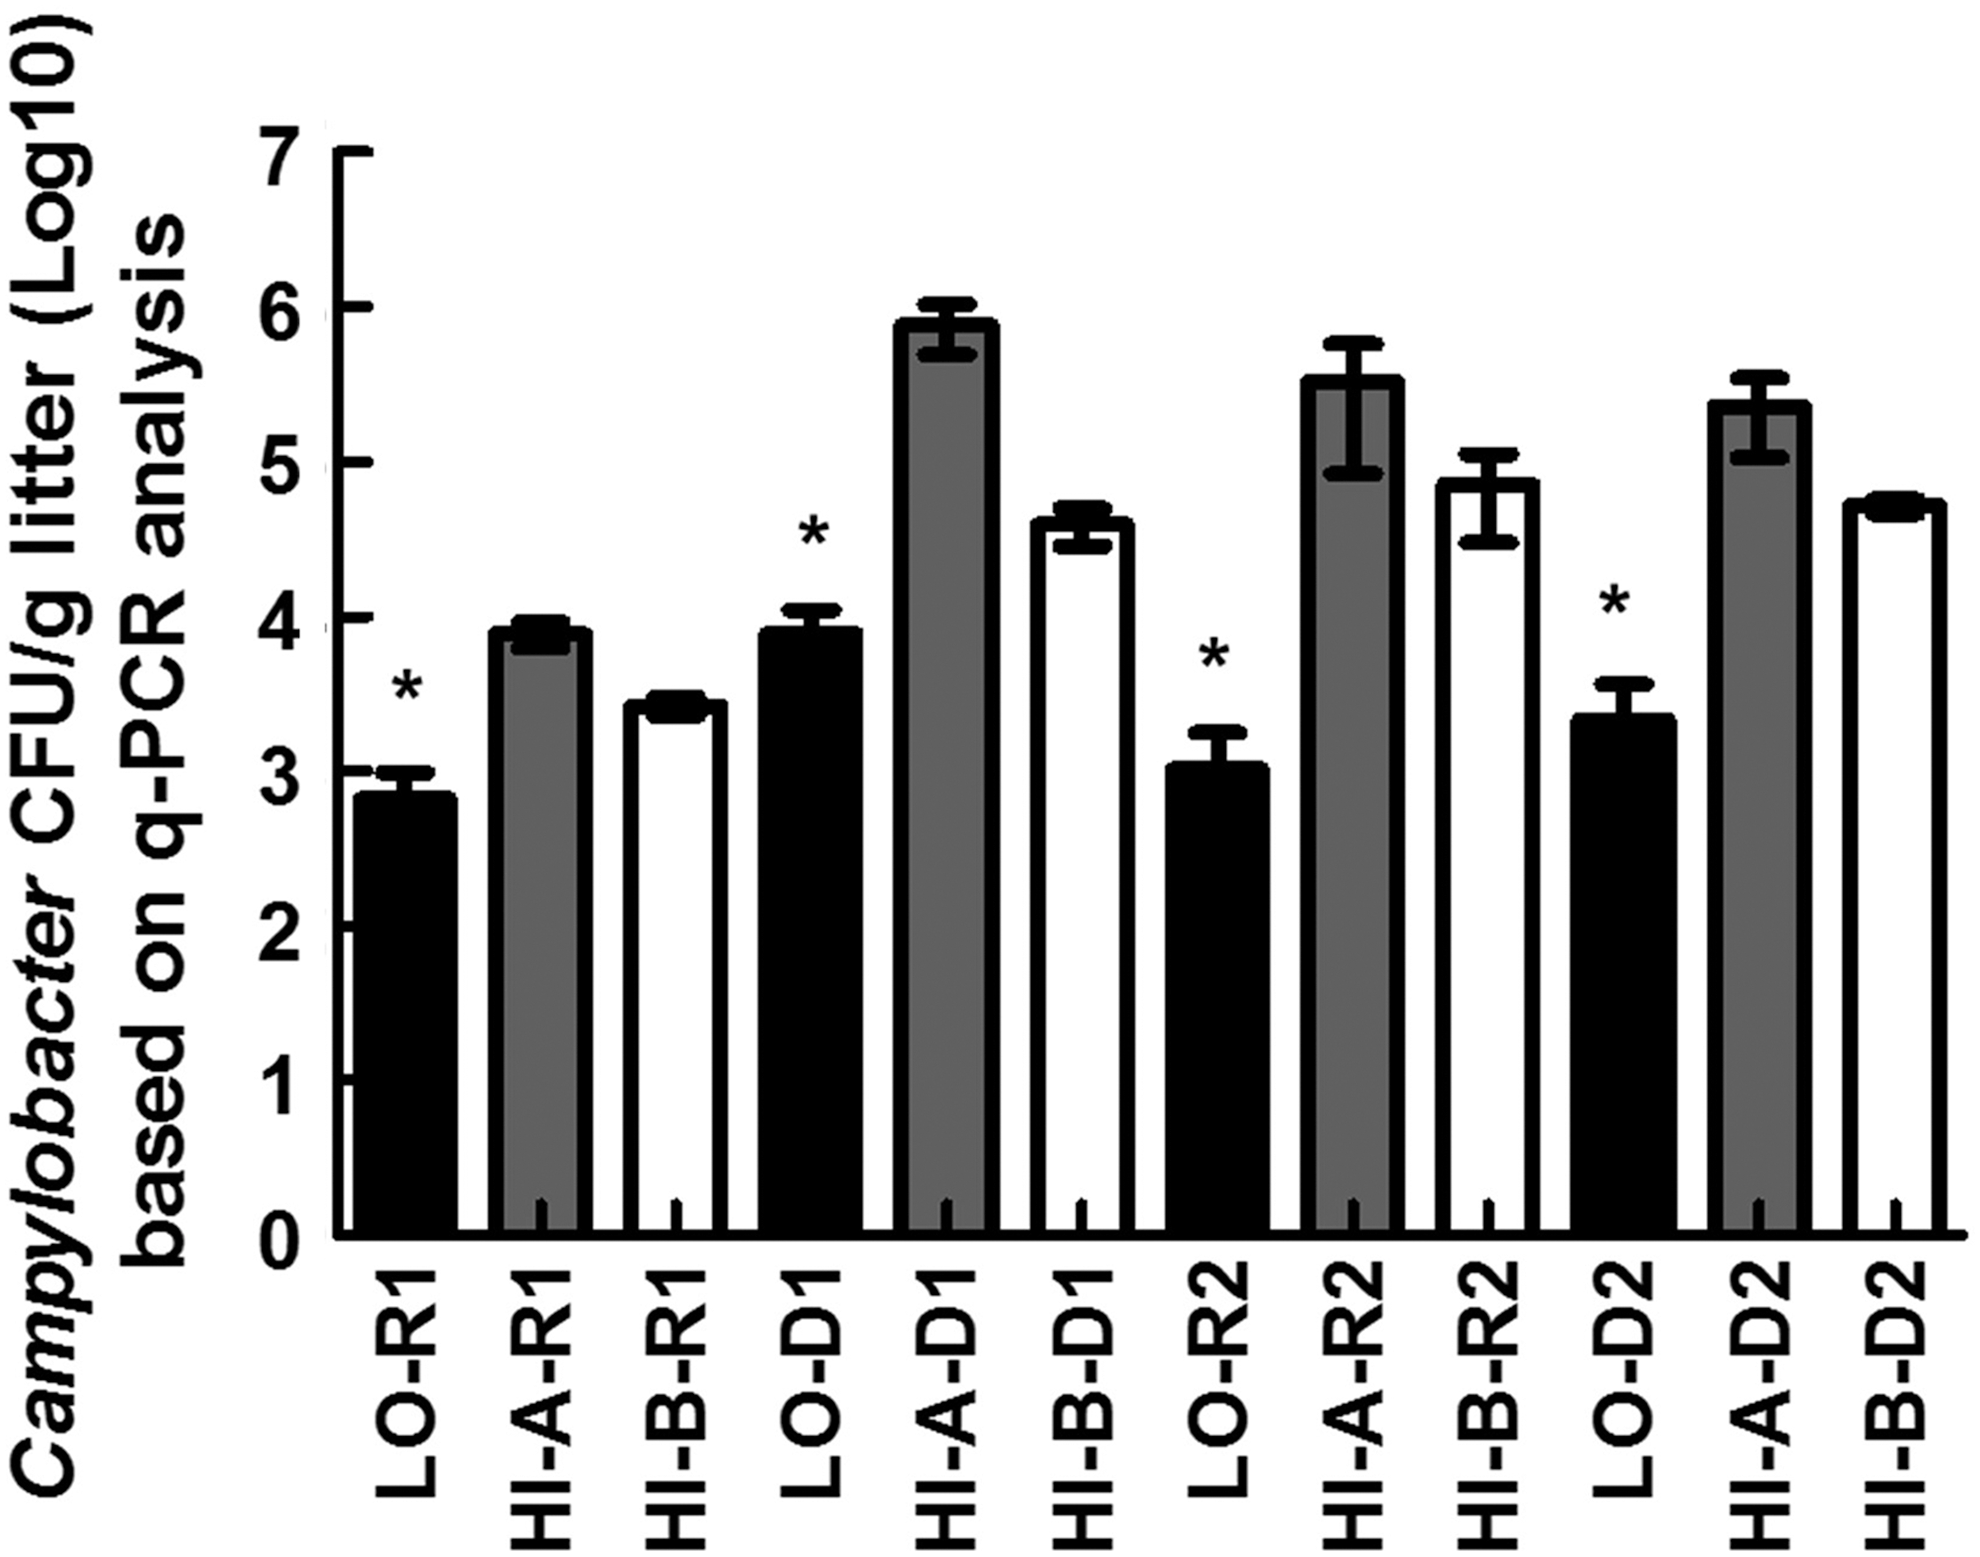
Campylobacter CFUs in pooled litter samples as determined by q-PCR and standard curve analysis. Each column represents the average from three pooled litter samples (8 litter samples/pool). LO: Low prevalence farm; HI-A and HI-B: high prevalence farms; R: grow-out cycle; D: downtime (no flocks). * indicates the significantly lowest mean (p < 0.05) between LO and HI farms within R1, D1, R2, and D2, respectively.
The persistently high prevalence of Campylobacter on broiler farms suggests a need for a deeper understanding and examination of the bacteria and their potential reservoirs. Broiler litter is a valuable resource that can affect production and off-farm transmission of pathogens and important genetic material, such as antibiotic resistant genes. Therefore, assuming the absence of a pathogen or a genetic marker might encourage the mismanagement of litter material, which in turn might lead to exacerbating Campylobacter problems associated with the production of broiler chickens.
Footnotes
Acknowledgments
Research in the Rajashekara laboratory is supported by funds from the Agriculture and Food Research Initiative (AFRI, U.S. Department of Agriculture, Grant No. 2012-68003-19679), the Ohio Agricultural Research and Development Center, and the Ohio State University.
Disclosure Statement
No competing financial interests exist.