
Abstract
Understanding the epidemiology of foodborne disease outbreaks (FBDOs) is important for informing investigation, control, and prevention methods. We examined annual summary FBDO data in the United States from 1938 to 2015, to help understand the epidemiology of outbreaks over time. Due to changes in reporting procedures, before 1998, the mean number of annual outbreaks was 378, and after that, it was 1062. A mean of 42% had a known etiology during 1961–1998; since then the etiology has been identified in ∼65%, with a marked increase in the number of norovirus outbreaks. From 1967 to 1997, a mean of 41% of FBDOs occurred in restaurant settings, increasing to 60% in 1998–2015. Concurrently, the proportion of outbreaks occurring at a home decreased from 25% to 8%. The mean size of outbreaks has decreased over time, and the number of multistate outbreaks has increased. Many social, economic, environmental, technological, and regulatory changes have dramatically affected the epidemiology of foodborne disease over time.
Introduction
T
While reviews of FBDO data over limited and recent periods have been published (Gould et al., 2013; Centers for Disease Control and Prevention, 2017), none has included data from long and remote periods of time. We examined FBDO investigation data over several decades to provide a historical perspective, explore reasons for changes over time, better understand the current status of foodborne outbreak epidemiology, and the challenges that lay ahead for surveillance.
Materials and Methods
We examined publicly available annual summary data on reported FBDOs in the United States from 1938 to 2015 (Frank, 1940; Fuchs, 1941; Feig, 1950; Dauer, 1952, 1958, 1961a, 1961b; Dauer and Sylvester, 1954, 1955, 1956, 1957; Dauer and Davids, 1959, 1960; Centers for Disease Control and Prevention, 2017).
The total number of foodborne outbreaks reported annually included all outbreaks due to food, milk, or milk products. Outbreak etiology was classified as bacteria, chemical, parasite, virus, multiple pathogens, or unknown. For years, without clearly differentiated etiology data, only total numbers of outbreaks (not broken down by pathogen group) were reported. When data were available, etiology was further classified by pathogen, including Salmonella (Typhi and nontyphi), Escherichia coli., Clostridium perfringens, Staphylococcus (including S. aureus), and botulinum toxin (botulism). Because they are currently of substantial interest and have sufficient data available, the mean size of Salmonella and E. coli outbreaks was calculated in 5-year increments, using the total number of outbreaks and total illnesses per each 5-year period.
Outbreak setting was determined based on the place of acquisition (1967–1975), place where food was eaten (1976–1997), or location of preparation (1998–2015), depending on the data available during those periods. Setting was categorized as restaurant (which included cafeterias, delicatessens, or any restaurant subtype), home (which included home or private residence), other (which included any other known setting), or unknown. For years, in which setting data combined other and unknown outbreaks in aggregate totals, these outbreaks were classified as unknown. For years, in which multiple locations could be reported, outbreaks were classified as restaurant if any reported location fit the restaurant criteria, and home if the only reported location was a private residence.
Results
A total of 39,493 FBDOs were reported through annual summaries in the United States between 1938 and 2015. The number of FBDOs reported annually varied over time, with a pronounced increase in 1998. Before that year, the mean number of annual outbreaks was 378, and since then, it has been ∼1062 (Fig. 1).
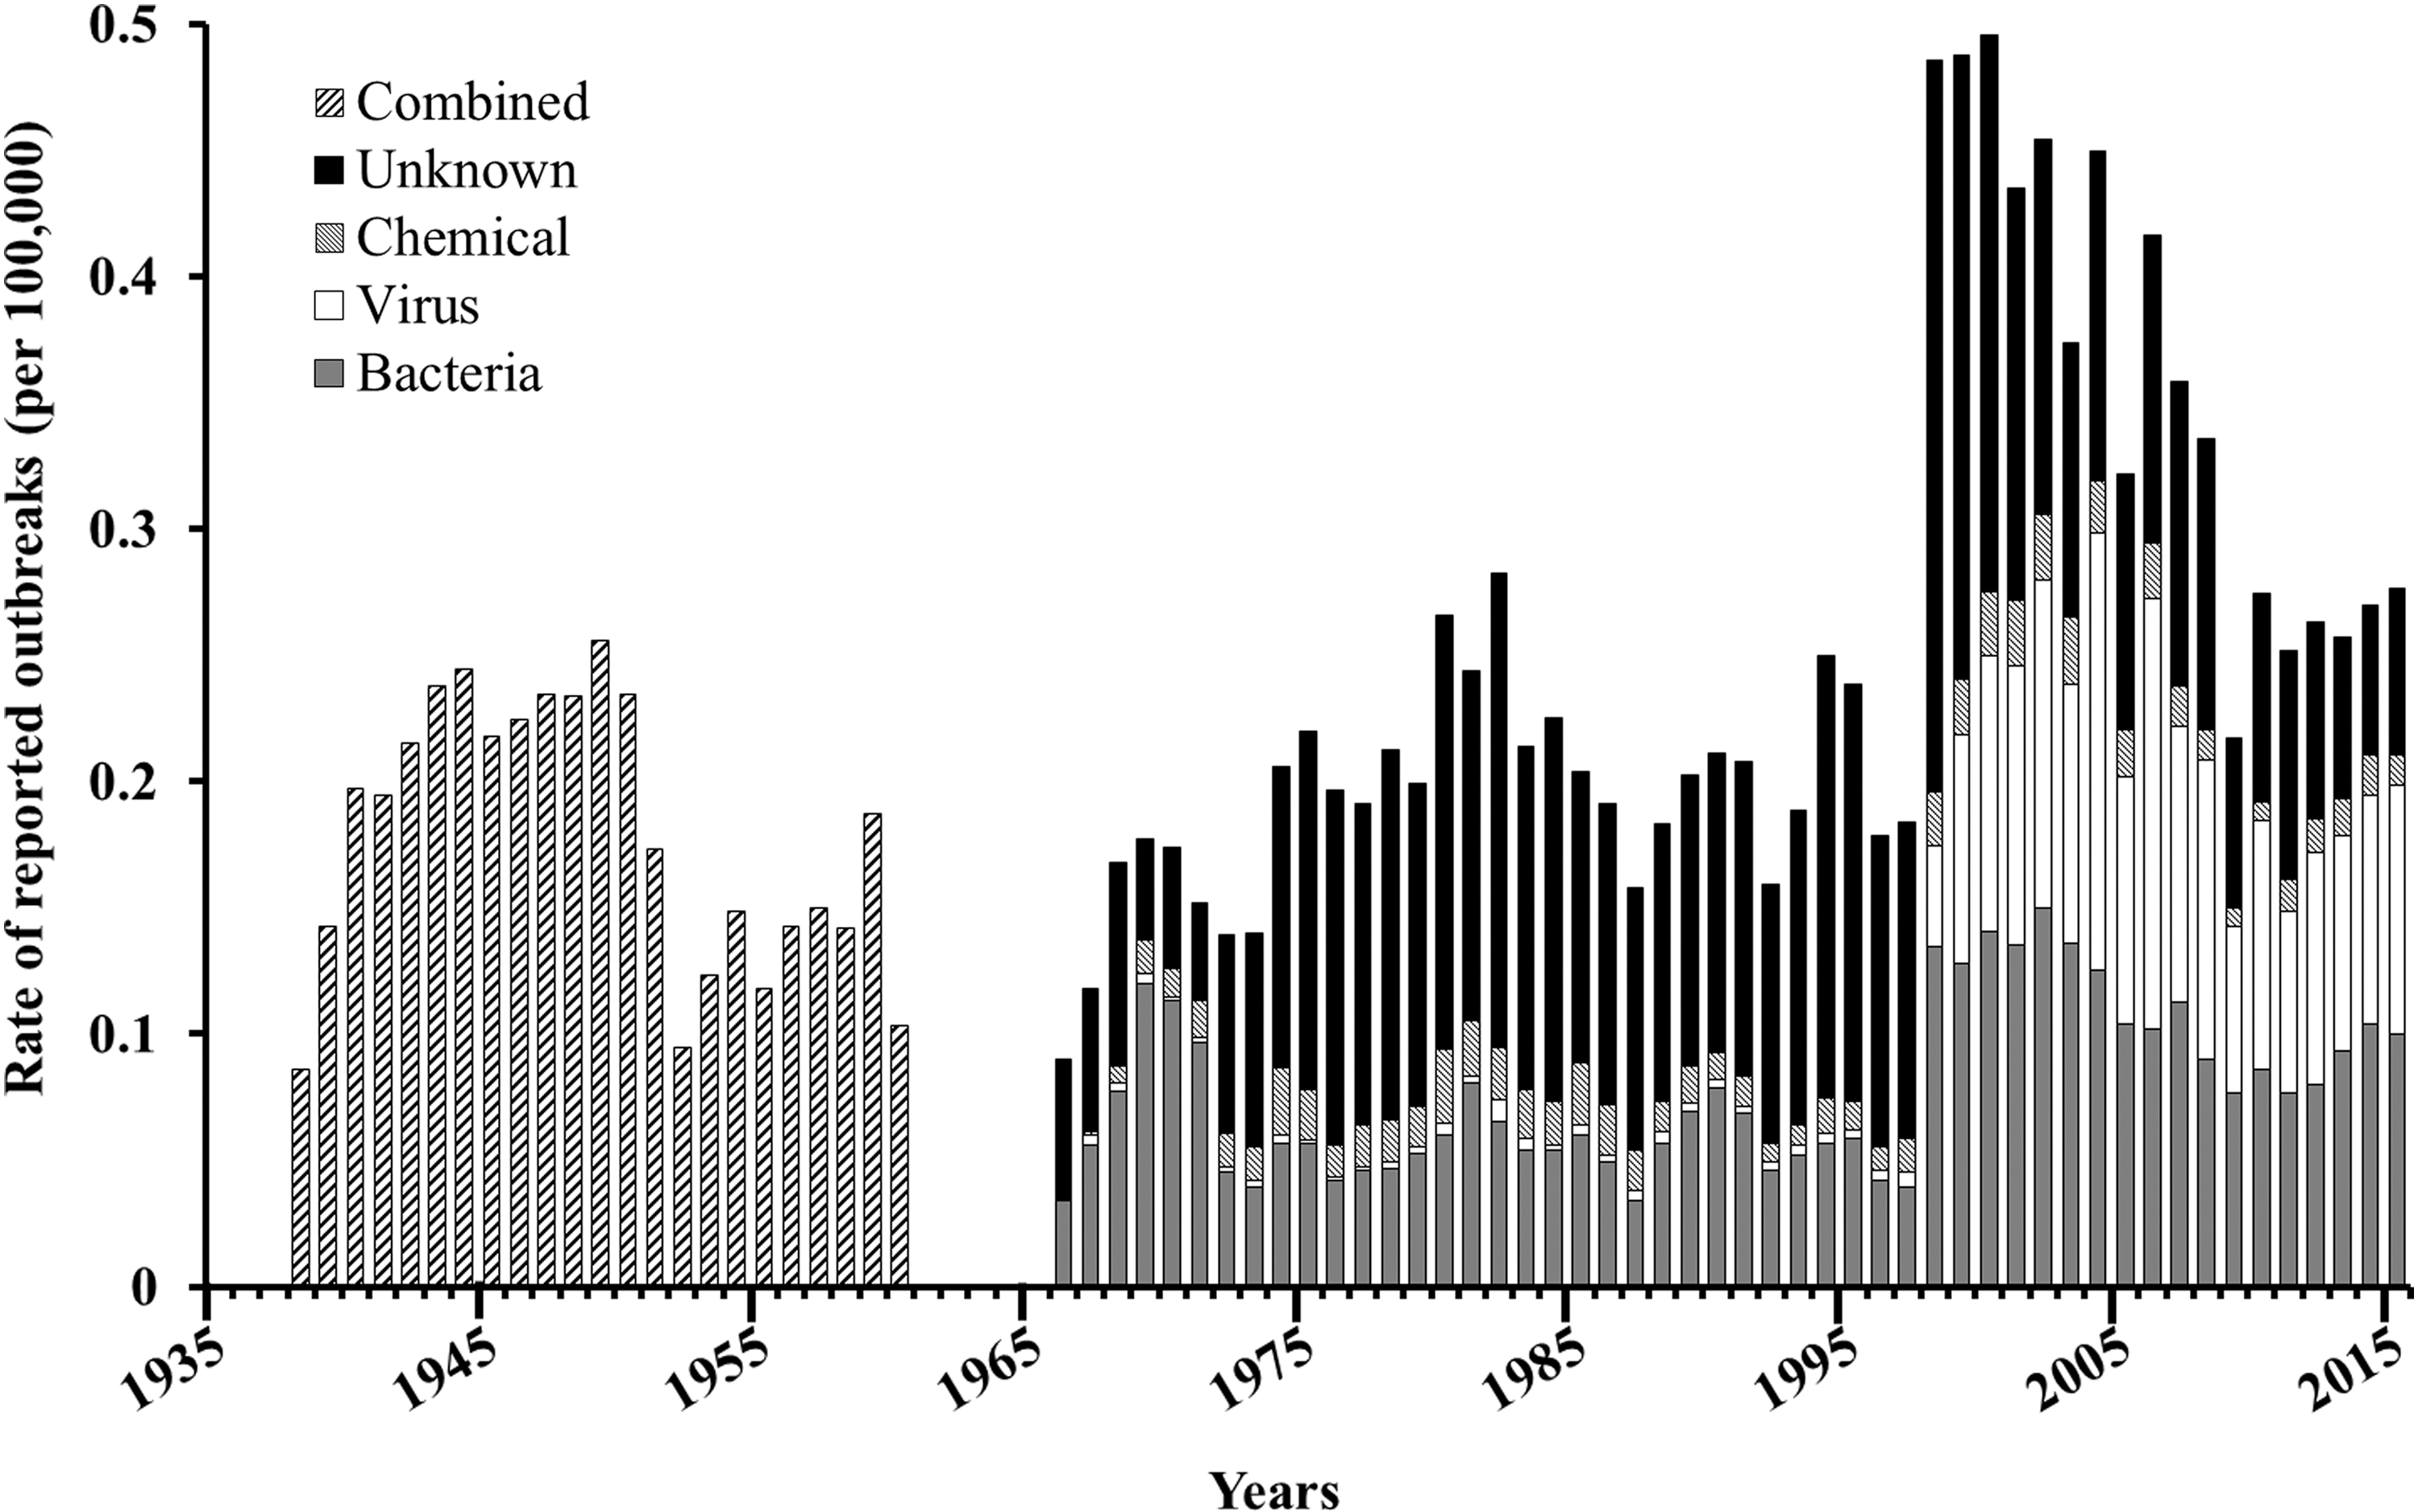
Reported foodborne outbreaks by pathogen, United States, 1938–2015. Because of very small numbers, outbreaks due to parasites or multiple pathogens were excluded.
Concomitant with that increase, norovirus outbreaks have constituted a substantial (and fairly stable) proportion of the total number of FBDOs reported since 1998. Diagnostic testing for norovirus became widely available in state laboratories around this time. Among reported outbreaks, a mean of 42% had a known etiology during 1961–1998; since then, the etiology has been identified in ∼65%. Reliable data were not available to calculate overall trends in FBDOs associated with specific pathogens before 1966. Since that time, the absolute number of outbreaks due to Salmonella has increased steadily, while the number due to E. coli increased acutely in 1998, and the number of botulism outbreaks declined substantially in 1992 (Fig. 2). Toxin-mediated outbreaks due to C. perfringens and S. aureus mirrored each other noticeably, with marked peaks in 1970 and 2002.
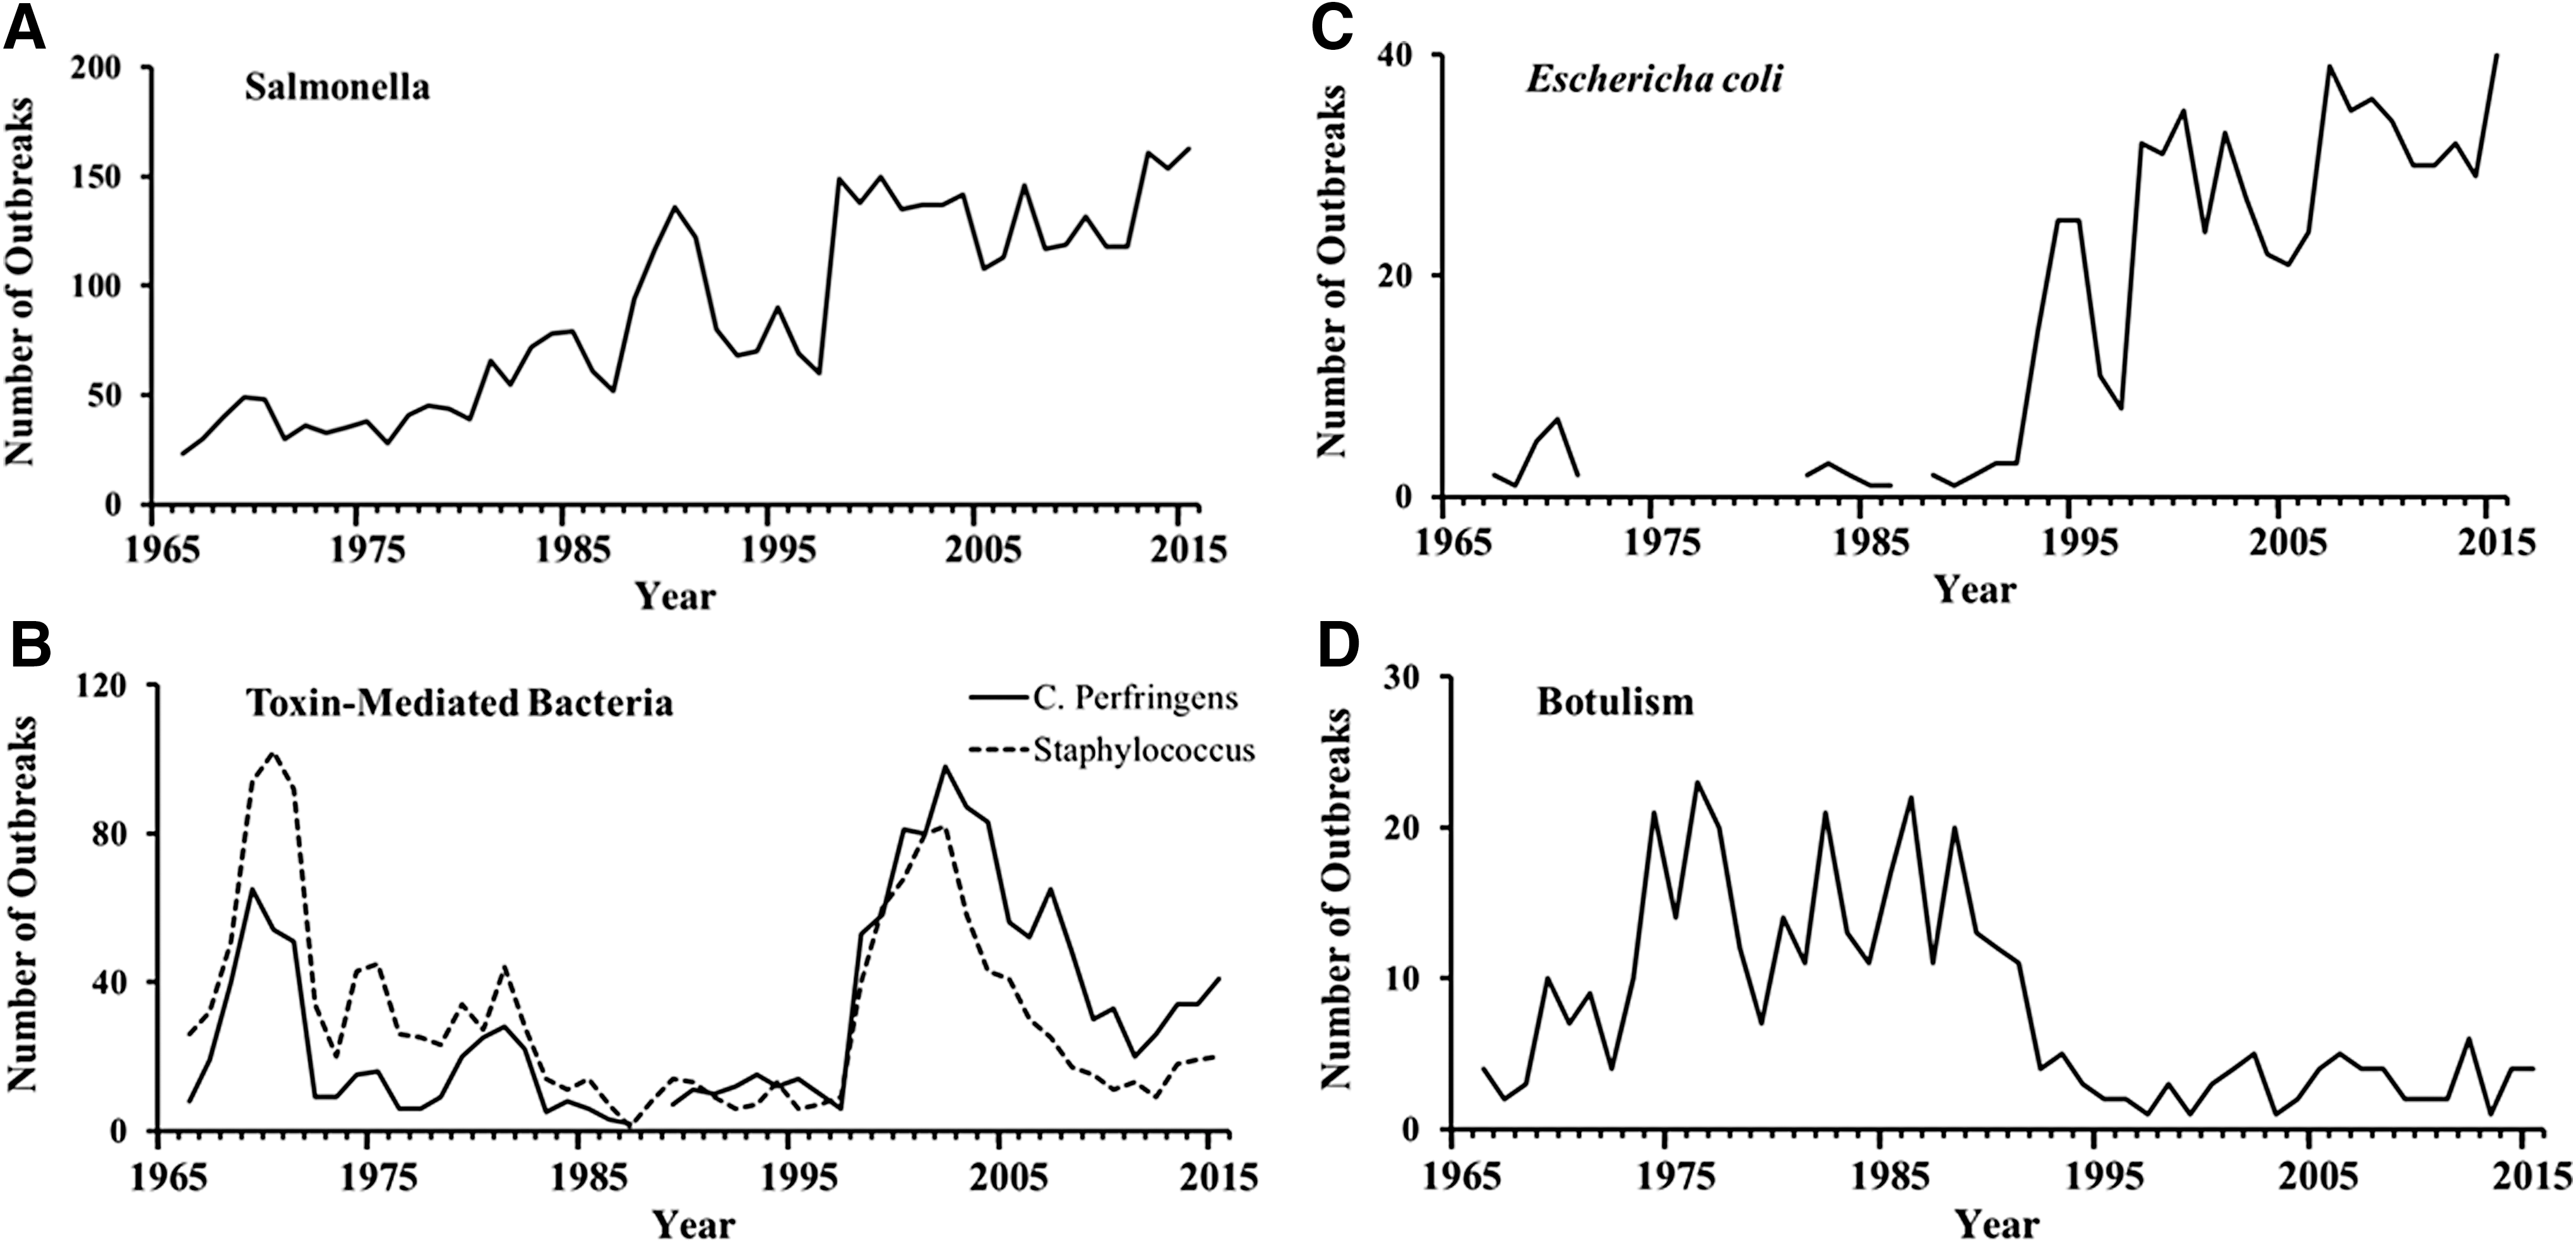
Number of foodborne outbreaks due to selected pathogens, United States, 1966–2015.
Information about the vehicle of transmission in FBDOs has become increasingly available over time, with granular and well-categorized data only reported in recent years. Standardization of methods for attribution of illnesses to specific commodities has similarly improved (Painter et al., 2013; Richardson et al., 2017). In the early years of reporting outbreak data, milk-associated outbreaks were reported as a distinct group. From 1938 to 1944, ∼40 dairy food outbreaks were reported annually, with 5 reported in 1960, 15 in 1970, 8 in 1980, 10 in 1990, 22 in 2000, and 37 in 2009–2010. During 1945–1947, 16% of Salmonella outbreaks were reported to be associated with poultry, increasing to 25% in 1960 (and 27% in 1970, 18% in 1980, 9% in 1990, 15% in 2000, and 5% in 2009–2010). Data on the proportion of all outbreaks attributable to poultry, beef and produce show very small and stable numbers (in the single digits), largely due to the very large number of outbreaks for which etiology and vehicle were unknown or not reported.
Data on the setting in which an outbreak occurred have improved over time, with more detailed data available beginning in 1967. From 1967 to 2015, a mean of 92% of outbreaks annually had a known setting (range 75–100%). Before 1959, cumulative data on specific settings were not reported. In 1959, 30% of FBDOs occurred in “public establishments,” and 28% occurred in “private homes” (28% and 24%, respectively, in 1960). From 1967 to 1997, a mean of 41% occurred in restaurant settings, steadily increasing to 60% in 1998–2015 (Fig. 3). Concurrently, the proportion of outbreaks occurring at a home or private residence decreased, from 25% in 1967–1997 to 8% in 1998–2015.
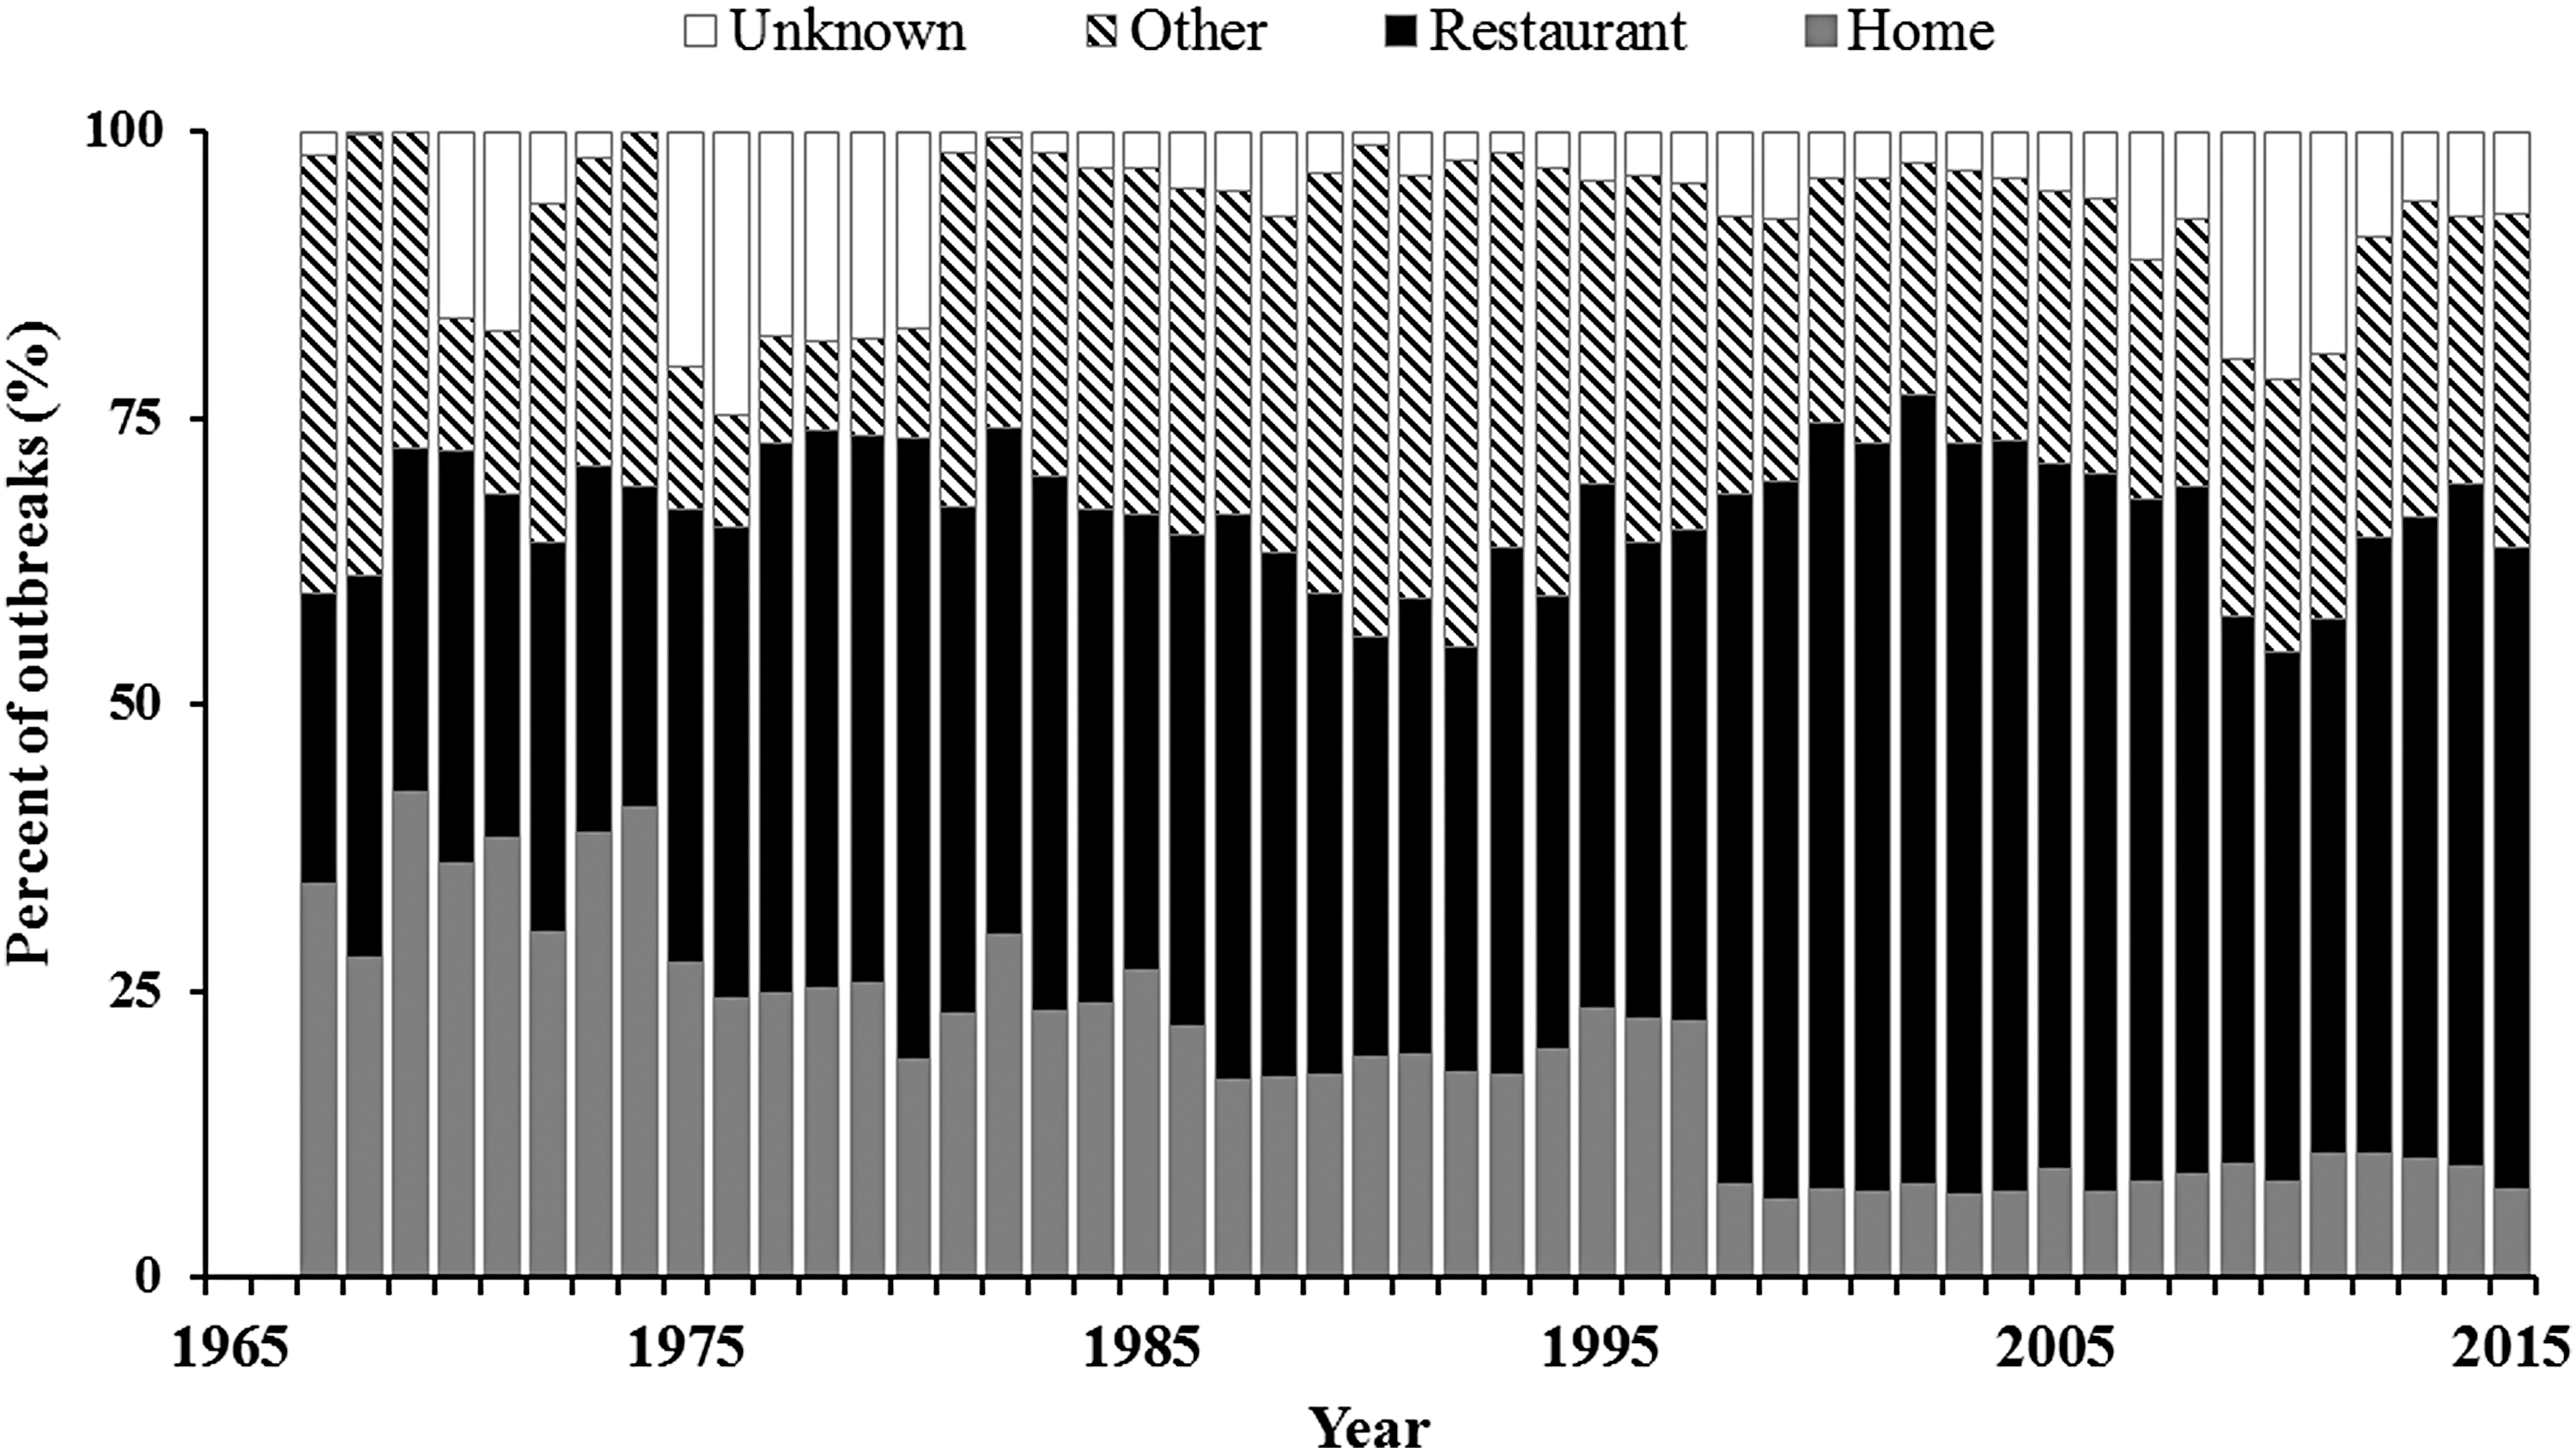
Proportion of foodborne outbreaks by reported location, United States, 1967–2015.
The mean size of reported outbreaks has decreased over time (Fig. 4). During 1966–1970, the mean number of cases in Salmonella outbreaks was 115, decreasing fairly steadily to a mean of 15 cases during 2011–2015. For E. coli outbreaks, the mean number of cases declined from 81 during 1981–1985 to 15 during 2011–2015.
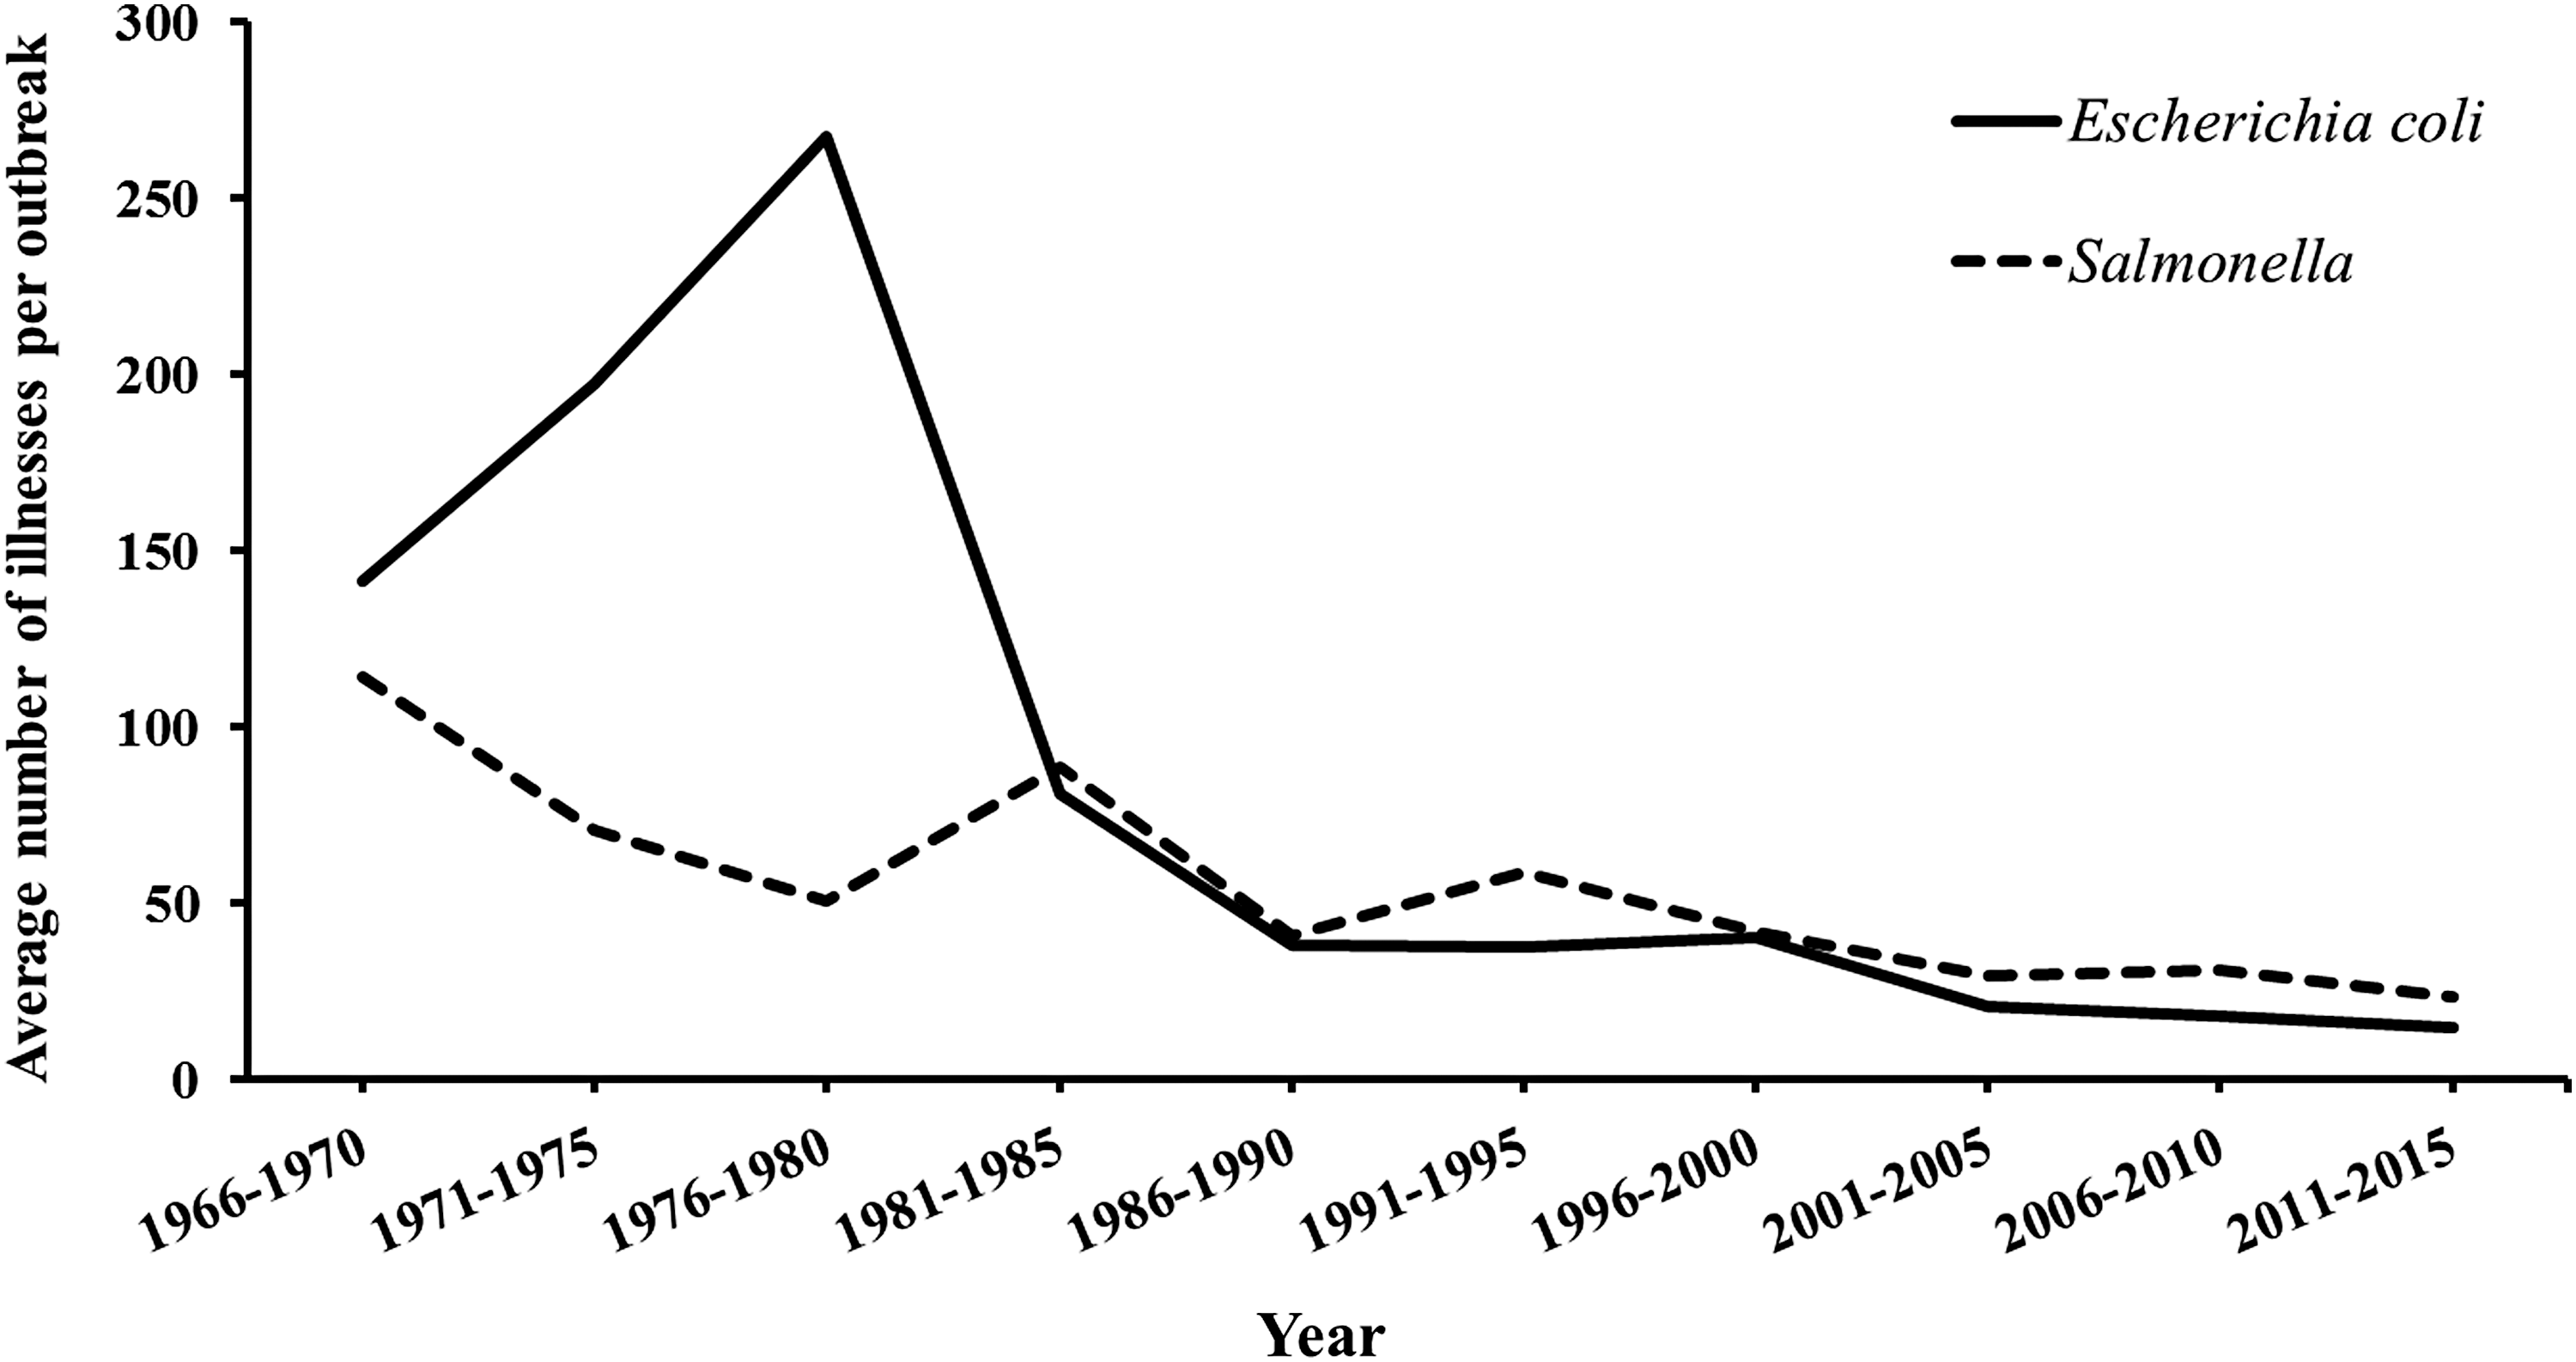
Average number of illnesses per outbreak, United States, 1966–2015.
The total number of multistate outbreaks identified increased from 15 in 1998 (the first year in which data were available) to 28 in 2015 (range 8–30), although they remain a very small fraction of total number of reported outbreaks. The number of illnesses associated with multistate outbreaks also increased during this time period from 1186 illnesses in 1998 to 1850 in 2015 (range 315–2863).
Discussion
Understanding FBDOs is critical for informing investigation, control and prevention methods, as well as helping elucidate the epidemiology of sporadic (not associated with a recognized outbreak) disease. The completeness and level of detail of collected data have improved dramatically since systematic reporting began in the 1930s, as laboratory and epidemiologic methods and technologic tools have improved. On cursory examination, it would appear that, in many respects, the volume and nature of FBDOs have remained disappointingly unchanged, although much of this is due to improvements in disease surveillance, outbreak detection, and resources available for investigation and response.
National policies regarding FBDO reporting have changed over time. In 1973, the CDC implemented the current Foodborne Disease Outbreak Surveillance System (FDOSS), with states reporting individual outbreaks via paper forms. In 1998, the Electronic Foodborne Outbreak Reporting System (eFORS) was launched, with revised forms, and by 2001 all states were using the system. The sudden large and sustained increase in total number of FBDOs in 1998 is largely attributable to the institution of eFORS that year. In 2009, an enhanced platform, the National Outbreak Reporting System (NORS), began allowing web-based reporting of enteric disease outbreaks from water and other vehicles in addition to food. In addition, the institution of PulseNet in 1996 has had a significant impact on the ability to link cases and recognize FBDOs.
Public health epidemiologic data are intended to provide actionable information for both the investigation at hand and the broader context of disease prevention and response. The timeliness and completeness of FBDO reports have improved dramatically over time (Biggerstaff, 2015). During the early decades of reporting, summaries of data from individual years were published in Public Health Reports. More recently, annual and multiyear cumulative reports have been published in the Morbidity and Mortality Weekly Report (MMWR). Currently, line-list level data from 1998 onward are accessible directly to the public via the CDC FOOD tool (
While FBDOs have been reported for decades, it was only in 2011 that they were added to the list of events required to be reported to CDC. While there is currently a clear definition of FBDOs for reporting purposes (
Despite the limitations of available data, a number of observations are evident. As expected, the number of outbreaks due to milk and dairy products decreased dramatically, concomitant with widespread implementation of voluntary, then U.S. Food and Drug Administration (FDA)-required pasteurization of milk via the Grade “A” Pasteurized Milk Ordinance and with improved farming practices. The number and proportion of outbreaks associated with restaurants (which are now a substantial majority), and the decrease in proportion associated with meals in homes, correlates with the steady increase in how much of our food is now consumed outside the home (Jones et al., 2006). The acute increase in 1998 in the overall number of outbreaks reported, and the number due to viruses, is largely due to changes in the mechanism of reporting to CDC and the advent of widely available testing for noroviruses in state public health laboratories in the mid-1990s.
Data on attribution of FBDOs to specific foods have been very limited until recent years, precluding analyses back over decades. In-depth, analyses of more current data have been performed (Painter et al., 2013; Richardson et al., 2017). The available data, which we were able to examine for major pathogens and food vehicles (e.g., Salmonella FBDOs attributable to poultry), are likely not detailed enough to demonstrate the effects of improved regulation and food handling practices introduced over time.
Many pathogen-specific trends in FBDOs have been discussed in detail elsewhere. Newly recognized pathogens, and new laboratory methods for their identification, have contributed to changes such as the acute increase of E. coli outbreaks in the early 1990s (primarily due to E. coli O157 and other Shiga-toxin producing E. coli [STEC]). Nonculture diagnostic testing is also having an increasingly important effect on pathogen identification (e.g., non-O157 STEC, Salmonella, etc.) (Jones et al., 2012). Explanations for other trends are less obvious (e.g., the drop in botulism outbreaks in 1993, the distinct bimodal increases of both C. perfringens, and staphylococcal outbreaks at the same time around 1970 and 2004), which require deeper analysis than can be included here.
These data demonstrate the increasing and very significant impact of molecular subtyping (e.g., pulsed field gel electrophoresis) on improved outbreak detection (Scharff et al., 2016). The increasing ability to detect smaller outbreaks, new vehicles, and multistate outbreaks due to widely distributed foods is largely attributable to this capability. As a consequence, it is likely also true that “surveillance artifact” is a significant contributor to the apparent continuing “high” rates of reported FBDOs. With the increasing availability of whole-genome sequencing, even more granular subtyping data are likely to further increase the number of clusters detected. As traditional stool culture is replaced by rapidly evolving culture-independent diagnostic testing and advanced molecular detection methods, it will be critical to maintain the ability to collect molecular subtyping and antimicrobial resistance data for public health purposes. This may require implementing new mechanisms for ensuring that public health laboratories receive either stool cultures or original specimens for in-house culturing. Faster, better and more sensitive outbreak detection results in the identification of FBDOs, despite continued improvements in food safety and effective control and prevention measures.
Conclusions
A plethora of social, economic, environmental, technological, and regulatory changes have dramatically affected the epidemiology of FBDOs since surveillance for them began. Our food has gotten safer, food production and preparation practices have improved, and our ability to detect, respond to, intervene in, and prevent the problems that do occur are better than they have ever been and continue to improve. All parties involved in the safety of our food supply should be encouraged, as we continue to make progress in these areas.
Footnotes
Disclosure Statement
No competing financial interests exist.