
Abstract
There has been a steady increase in illness incidence of Vibrio parahaemolyticus (Vp). The majority of illnesses are associated with consumption of raw oysters. In the summer of 2015, Canada experienced the largest outbreak associated with the consumption of raw oysters harvested from British Columbia (BC) coastal waters. Case investigation of laboratory-confirmed cases was conducted to collect information on exposures and to assist traceback. Investigations at processors and oyster sampling were conducted. Eighty-two laboratory-confirmed cases of Vp infection were reported between January 1 and October 26, 2015. The majority of the cases were reported in BC, associated with consumption of raw BC oysters in restaurants. Sea surface temperatures were above the historical levels in 2015. This outbreak identified the need to improve surveillance and response to increases in human cases of Vp. This is of particular importance due to the potential for increasing water temperatures and the likelihood of additional outbreaks of Vibrio.
Introduction
V
In the summer of 2015, Canada experienced the largest number of Vp cases ever reported and the only documented outbreak associated with consumption of raw BC oysters since 1997 (Fyfe et al., 1998). The objective of this article is to describe the 2015 Vp outbreak associated with the consumption of raw oysters harvested from BC coastal waters, the factors that led to it, and the actions taken to control the outbreak.
Methods
Epidemiology
The local health authority interviewed all reported Vp cases using a standard form (BC Centre for Disease Control, 2015b). If the case consumed commercial shellfish during their incubation period, an inspection of the location of consumption/purchase was conducted where the cold chain and other food safety control points are reviewed. Any issues identified were corrected to prevent ongoing risk. In BC, case data were shared with the BC Centre for Disease Control (BCCDC) to assess common exposures.
A confirmed case was defined as a resident of or visitor to Canada with laboratory confirmation of Vp, reported to public health on or after January 1, 2015, and with suspected consumption of raw shellfish in Canada during their incubation period (96 h before onset).
Case data were analyzed to describe the types of shellfish consumed and the location of exposure. Descriptive case data and exposure information were analyzed using Epidata (Christiansen and Lauritsen, 2010). All other analyses were conducted in Microsoft Excel.
Food safety investigation
Shellfish harvest areas are divided up into subareas and landfiles (BC Centre for Disease Control, 2017). All oysters harvested in Canada intended for direct consumption must be processed in a federally registered plant. Federally registered processing plants are required to place tags on their products, which describe harvest and processing information (e.g., type of shellfish, harvest and production dates, and harvest location). In BC, restaurants and retailers are requested to keep tags for 90 days—tags from the shellfish that the case consumed are collected from the food premises. Tag information for BC cases is shared with the BCCDC to assess common exposure locations and for cases from all jurisdictions; the tags are shared with the Canadian Food Inspection Agency (CFIA) to conduct traceback and follow-up with the implicated processors. In other provinces, case investigation, tag collection (if available), and premise inspection typically occur in response to Vp outbreaks. Tag data were analyzed to identify common harvest areas and dates.
The CFIA verifies the tag information provided by public health investigators with processors and documented the movement of raw oysters from harvest site to point of sale. Audits at processors were conducted in accordance with the Quality Management Program to assess and verify practices that prevent temperature abuse (Canadian Food Inspection Agency, 2015b).
CFIA analysis and verification were conducted at processors from April to August, and included review of available harvest and processing records and results of product analyses conducted by processors as part of the regular monitoring program.
Sea surface temperatures
Hourly sea surface temperature (SST) data were obtained from the buoy located closest to the main implicated harvest area (Fisheries and Oceans Canada, 2015). The average daily SST from 1992 to 2014 was compared to the average daily SST for 2015. SST was selected as water temperature has been cited as the most important environmental predictor of Vp (Konrad et al., 2017). Average daily SST was selected as it was a more stable indicator.
Laboratory investigation
In BC, all stool specimens are routinely cultured for Vibrio spp. by all clinical laboratories. In other provinces, testing practices vary.
Routine testing of oysters by the shellfish processor is analyzed by private accredited laboratories using validated three-tube most probable number (MPN) methods (Kaysner and DePaola, 2004) and shared with CFIA upon request. CFIA collected and analyzed oyster samples during the outbreak investigation (Health Canada, 2006). A sample was defined as 5 subsamples of 12 oysters each. An unsatisfactory result was defined as more than 1 subsample out of 5 with Vp >100 MPN/g.
Results
Epidemiology
A total of 82 laboratory-confirmed cases of Vp infection with raw shellfish consumption in Canada were reported between January 1 and October 26, 2015. Onset dates occurred between May 26 and September 3, 2015, and dates of known consumption, between May 29 and September 2, 2015 (Fig. 1). The majority of the cases were reported in BC (n = 60); additional cases were reported in Alberta (n = 19), Saskatchewan (n = 1), and Ontario (n = 2). The median age of cases with information available (n = 82 for sex and 77 for age) was 40 years and 76.0% were male. Of the 82 cases, 79 (96.3%) reported consumption of raw oysters in Canada; for 3 cases, consumption of raw oysters was unknown. Sixty-one (77.2%) consumed raw oysters in a restaurant, 12 (15.2%) consumed self-harvested raw oysters, 4 (5.1%) consumed raw oysters purchased from a store or retail, 1 consumed raw oysters from a restaurant/retail, and 1 had unknown exposure location. Peaks in restaurant exposures occurred during the weeks of June 29 and July 13, 2015. Cases associated with self-harvested oysters or local water exposures were reported in small, but consistent numbers each week during the investigation time period (data not shown).
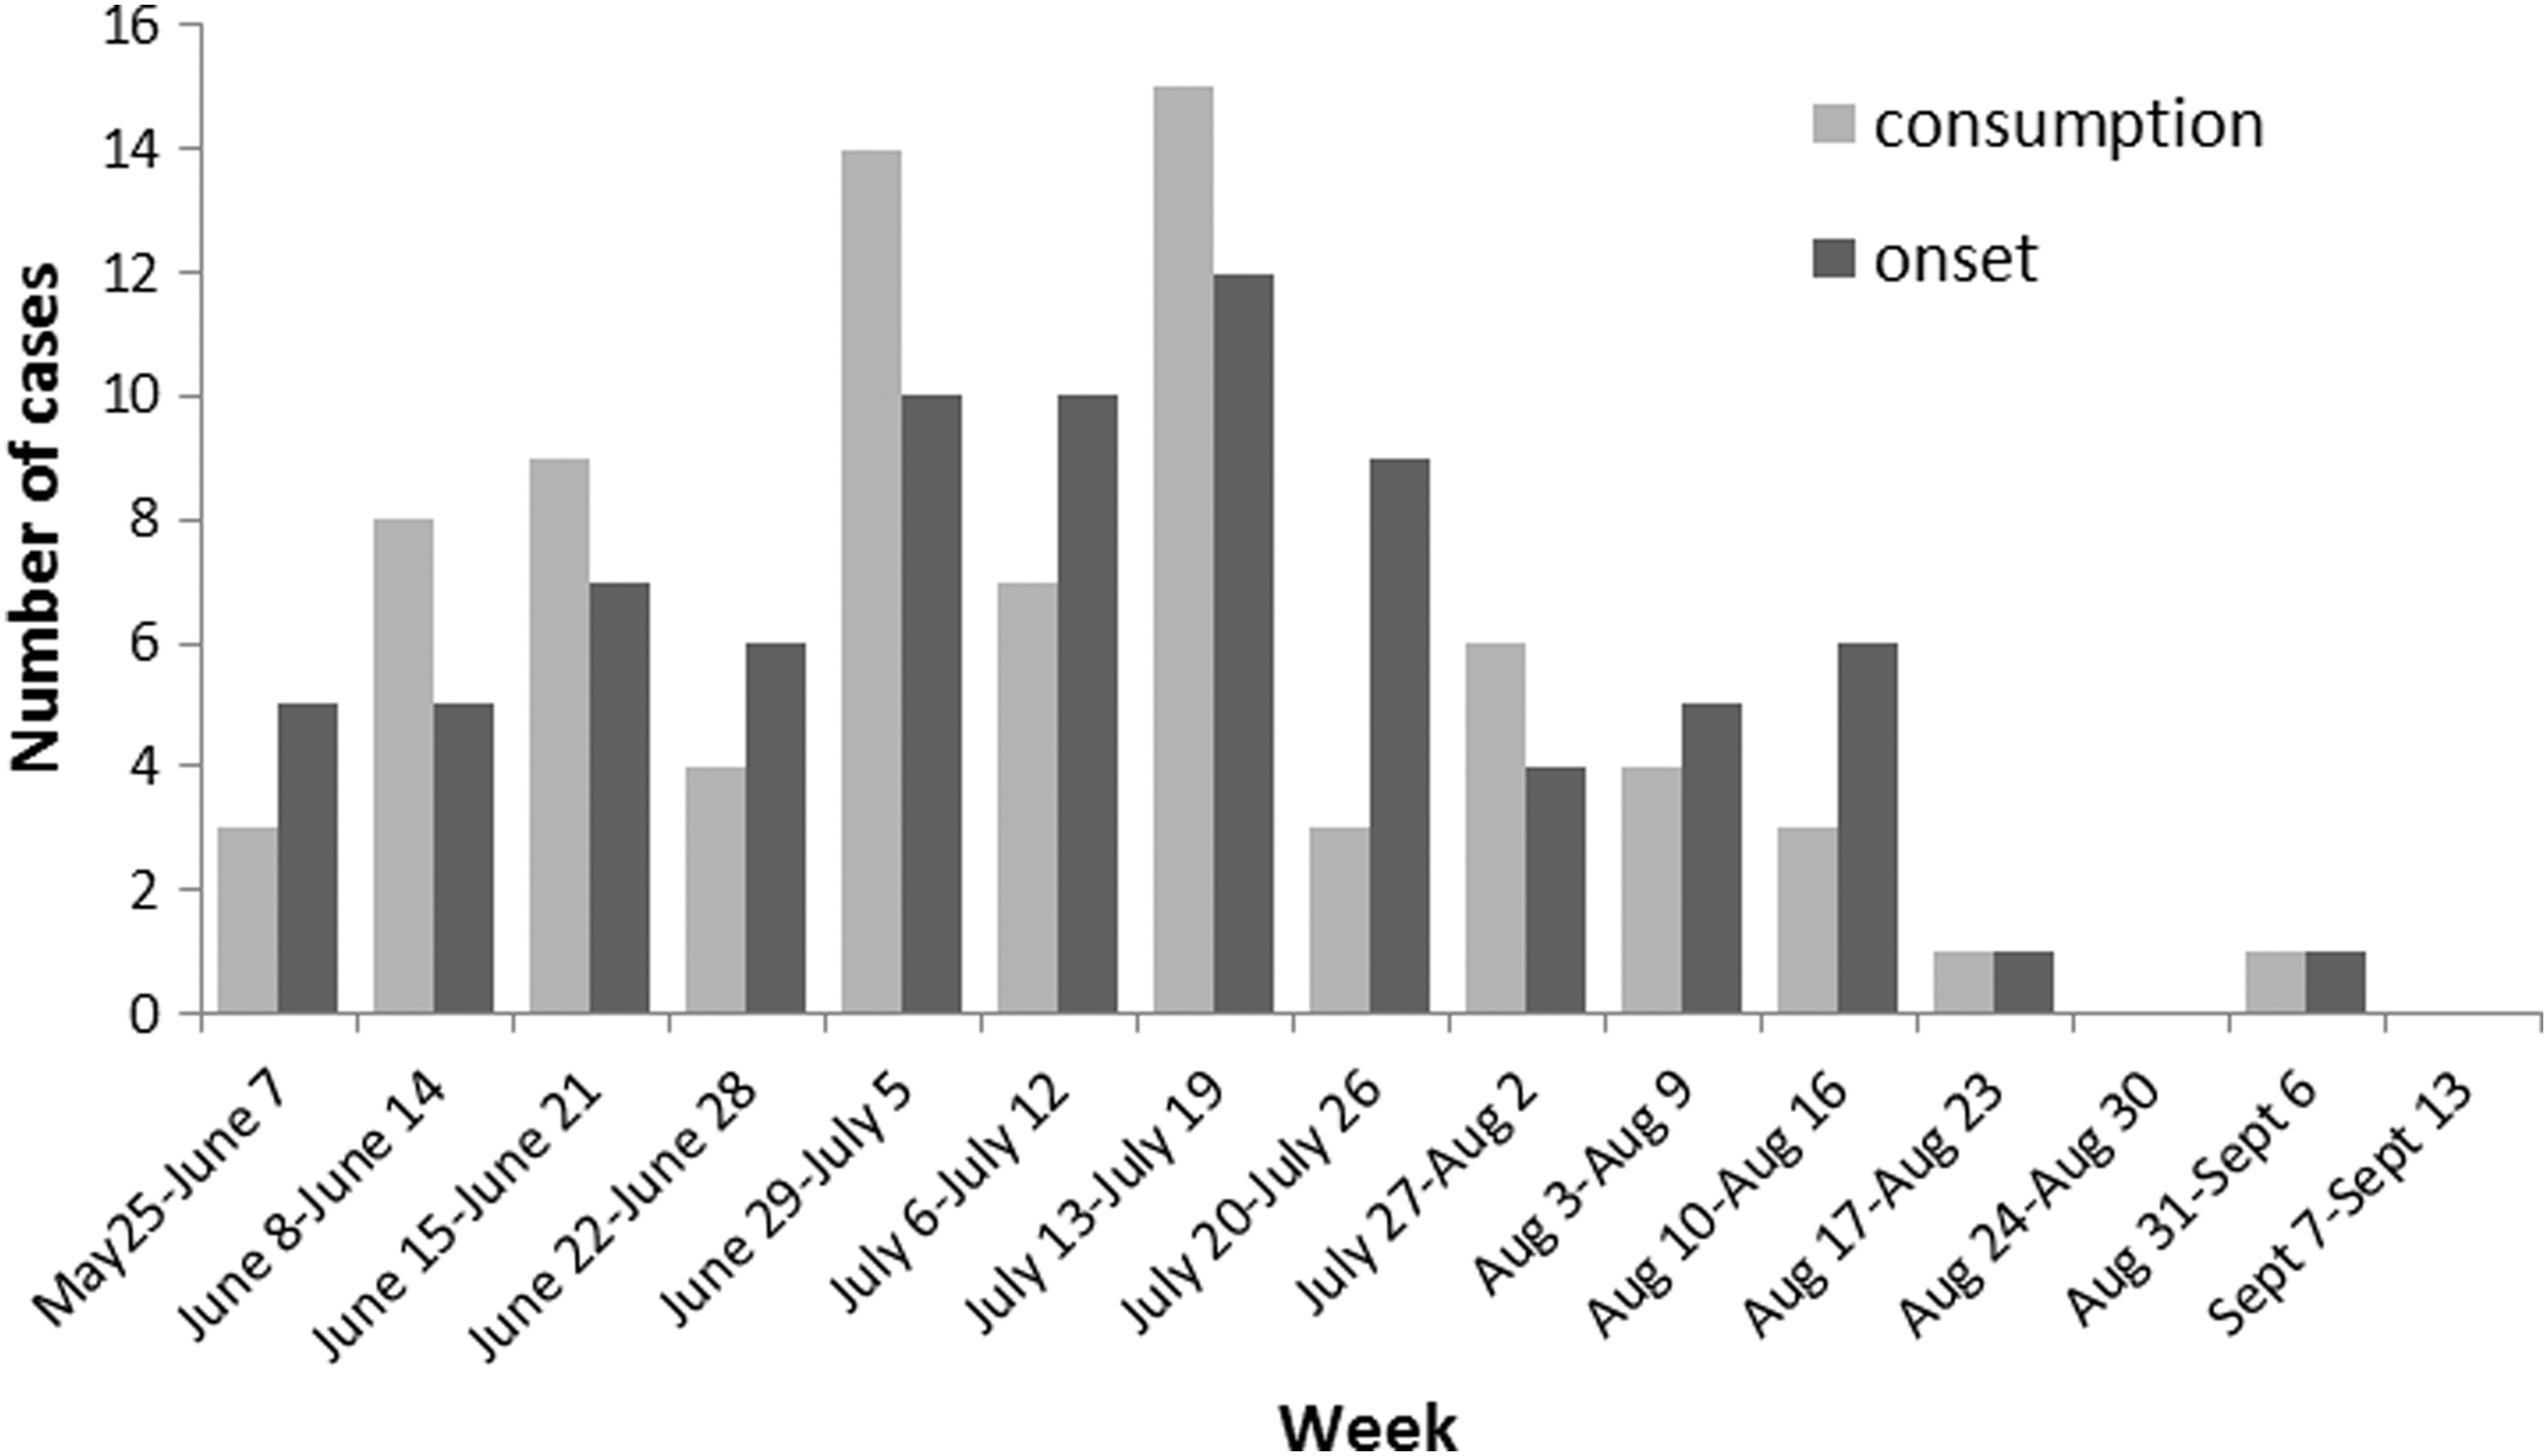
Number of confirmed cases of Vp by week of illness onset and raw oyster consumption, Canada, 2015. Vp, Vibrio parahaemolyticus.
A total of 36 different restaurants were identified. While common restaurants were named over the course of the outbreak, no restaurant clusters (multiple diners dining at the same time and place) were identified. Restaurants most frequently associated with cases who consumed raw oysters were known large sellers of raw shellfish. Inspections of implicated restaurants identified few temperature abuses or other food safety issues; these were immediately corrected.
Source of the oysters was identified in 69/79 cases (87.3%). Forty-nine of these cases had exclusively BC oysters (71.0%) and an additional 14 (20.3%) had exposure to oysters from multiple locations, but included at least 1 from BC. By August 10, 52 BC cases had oyster tag information available. These tags identified 119 unique case-to-landfile matches, 93.3% were to BC landfiles. The three landfiles with the largest number of tags identified through case investigation were all within Pacific Fishery Management Subarea 14–8 (subarea 14–8) (BC Centre for Disease Control, 2017), which is located in Baynes Sound on the east side of Vancouver Island. This harvest area accounts for over 70% of raw oyster production and is the largest growing areas for oysters intended for raw consumption in BC (Department of Fisheries and Oceans Canada, 2016). Of the oyster tag information available for the 52 cases, it was possible to link exposure of 14 of these cases to oysters harvested from a single landfile and 12 of these unique landfiles were in harvest subarea 14–8. Ten additional harvest subareas were also linked to outbreak cases.
Food safety
The CFIA identified no issues at the shellfish processors identified through tags associated with human cases.
Seven processors provided 270 results for harvest site monitoring samples taken from April 27 to August 4. These samples consisted of one subsample each. Sixty-seven percent of the samples were taken from subarea 14–8. Twenty-seven (10.0%) samples had Vp counts higher than 100 Vp MPN/g. Overall, unsatisfactory results ranged from 150 MPN/g to >11,000 MPN/g. Four were from subarea 14–15 and the remaining 23 were from subarea 14–8, which is south of area 14–15. In area 14–8, 4 harvest monitoring dates had counts higher than 2000 MPN/g (July 6: 2400, 4600, 11,000; July 7: >11,000 MPN/g; July 10: 11,000 MPN/g; and July 22: 2400 MPN/g), all from different landfiles.
During the 2015 season, the CFIA collected 12 product samples. Six (50%) of these samples were raw oysters from sub-area 14–8. Two of the six, harvested on June 7 and August 6, from the same landfile in 14–8, were found to be unsatisfactory for Vp.
For three of the unsatisfactory results from sub-areas 14–15 and 14–8, there was potential human exposure to affected oysters. These results led to three nonpublic recalls on June 12, July 3 and July 16, 2015. No harvest areas or landfiles were closed.
Sea surface temperatures
Between January and mid-July 2015, the average daily SST for Sentry Shoal Buoy was higher than the average daily SST in 1992–2014. However, by mid-July, the average daily SST returned to historical levels (Fig. 2).
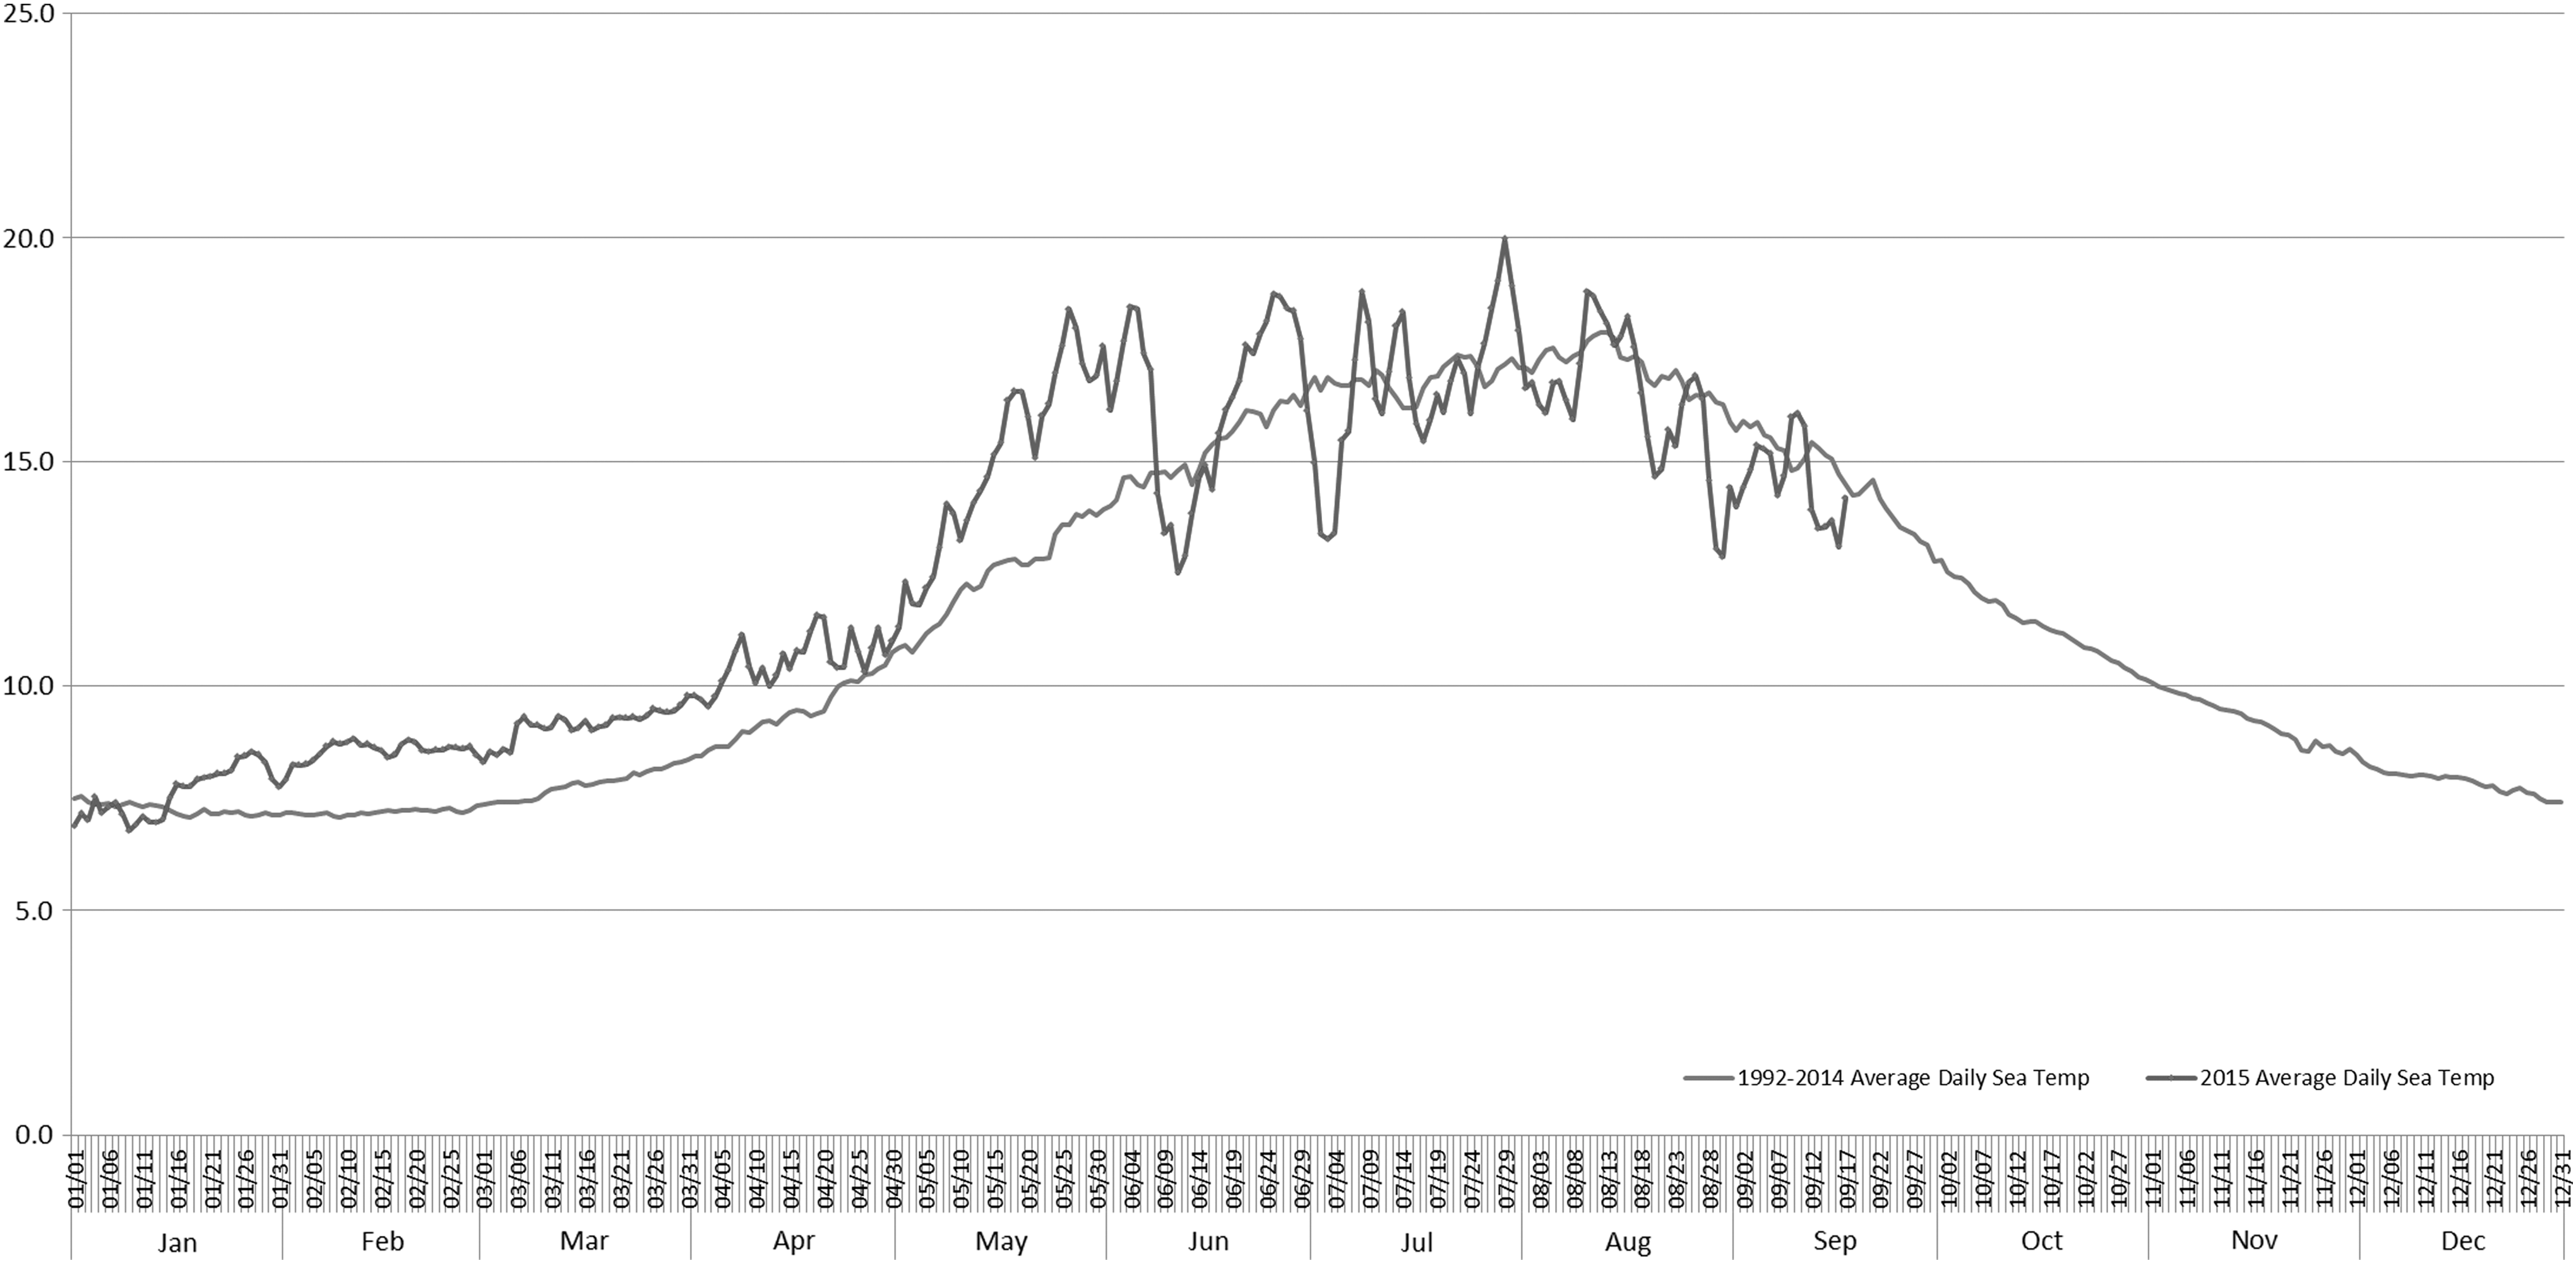
1992–2014 average of daily average and 2015 daily sea surface temperature (°C) data for Sentry Shoal Buoy, BC, Canada. BC, British Columbia.
Control measures
On July 31, BC investigators issued a public health notice warning the public against consuming raw oysters and distributed messages to BC restaurants. On August 12, four of the five local health authorities in BC required that restaurants serving raw BC oysters post messages warning diners of the outbreak and the risk of consuming BC raw oysters. One health authority, which already had a requirement for restaurants to include menu advisories on the risk of raw shellfish consumption, ordered that restaurants stop serving raw BC oysters. In Alberta, public communication on the outbreak was issued on August 14 and general messaging was distributed to retail and restaurants on August 18.
On August 18, based on Health Canada's (HC) health risk assessment, the CFIA issued a health hazard alert and recall for all oysters harvested from BC coastal waters on or before August 18, 2015, and intended for raw consumption. To further limit exposure during the outbreak, HC established an interim microbiological guideline for Vp in commercially processed raw oyster shellstock, harvested from BC coastal waters, intended for direct raw consumption. The recommendation to industry was that each lot of BC oysters intended for raw consumption be held and tested: raw oyster lots with Vp levels ≥100 MPN/g in any one of five subsamples be rejected and lots could not be released until corrective actions had been implemented to meet the HC interim guidelines (Canadian Food Inspection Agency, 2015a).
Between August 19 and October 20, 2015, 135 lots of raw oysters harvested from BC coastal waters intended for raw consumption were tested. Testing showed results between <3 and 230 Vp MPN/g over this testing period. Of these, 134 (99.3%) met the requirements of <100 Vp MPN/g on initial tests. One lot was above this level at the initial test, with one subsample enumerated at 230 Vp MPN/g. It was not released until wet storage was conducted and testing confirmed that the levels of Vp met the interim guideline.
By September 17, there had been a decrease in human Vp incidence to historic levels, a decrease in water temperatures to <15°C and testing of oyster lots did not show an increasing risk over time. Based on these criteria, restrictions on serving raw BC oysters and outbreak-specific messaging in restaurants were lifted in BC.
On October 10, the outbreak was declared over. On October 20, the hold and test requirement was lifted. However, the interim microbiologic guideline was continued, pending further review of Vp-associated guidance in Canada.
Discussion
This Vp outbreak was the largest in Canadian history with 82 laboratory-confirmed cases and was unusual because illnesses occurred earlier than expected in the season, in June–July. In BC, there is an annual average of 35 Vp cases (2006–2014) and the peak occurs in August, consistent with the warmest water temperatures (BC Centre for Disease Control, 2015a).
Sea water temperature is believed to have played a significant role in this outbreak. In 2015, BC ocean waters were warmer than usual between January and mid-July. This was attributed to the “blob” and to El Niño. The blob was a large area of warm water in the northeastern Pacific, which lasted from 2013 to 2015; its causes are not fully understood (Oceans Networks Canada, 2016). El Niño started in the spring of 2015 and also caused warming of the Pacific Ocean (National Oceanic and Atmospheric Administration). The warm SST also resulted in the largest recorded outbreak of domoic acid on the Pacific Northwestern coast in the spring of 2015 (Mccabe et al., 2016). While factors such as salinity, turbidity, and available nutrients may impact Vp levels, increasing SST has been identified as the most important environmental factor for increasing Vp (Konrad et al., 2017). Other environmental factors were not assessed as part of this outbreak, so their specific impact is unknown.
In the summer of 1997, when the last Vp outbreak was reported, El Niño conditions started in June and led to increased SST (National Oceanic and Atmospheric Administration, 1998). El Niño conditions also coincided with Vp outbreaks in Peru and Alaska (Martinz-Urtaza et al., 2010). Vp is highly sensitive to water temperature; it tends to proliferate at and above 15°C (Fernandez-Piquer et al., 2011; Goertz et al., 2013). In BC, when SST decreases below 15°C, Vp illnesses also decrease (Khaira and Galanis, 2007). In the 2004 Alaskan outbreak, SST remained above 15°C for over 2 months (McLaughlin et al., 2005; Marques et al., 2010). With global warming leading to increases in SST, we may experience earlier, longer, and larger Vp outbreaks (Vezzulli et al., 2016).
A compromised cold chain, due to the unseasonal warm air temperatures, would have promoted continued Vp growth in oysters. Although temperature issues during transportation, at retail, and in restaurants may have contributed to the outbreak, no Vp clusters were identified in restaurant/retail and illness was primarily associated with raw oysters from BC rather than oysters from other areas. This supports the premise that the outbreak was more likely associated with the conditions at time of harvest and less likely to be a failure of the distribution/retail market to maintain the cold chain.
Compared to the 1997 Vp outbreak, this outbreak was larger (82 cases in Canada compared to 51 cases), although the total magnitude of the 1997 outbreak, including U.S. cases, was larger (n = 209) (Fyfe et al., 1998). The 2015 outbreak case definition did not include cases exposed in the United States, although Washington State reported a small number of cases who consumed BC oysters, comparable to other years. This outbreak did include cases reported in other Canadian provinces. The reasons for the geographic distribution of cases in this outbreak, with few cases in other provinces beyond BC and Alberta, are unclear, but may be due to distribution of oysters, duration of transport (which, if cold, can decrease Vp), other controls in the food chain, variable reporting of human Vp, or other factors.
In Canada, the CFIA has the responsibility for establishing control programs in federally registered shellfish processors, whereas public health agencies oversee retail/restaurant food safety. This outbreak demonstrated that when environmental conditions changed, the Vp control programs were insufficient to prevent human illness. Control programs need to be flexible and adapt to changing environmental conditions and indicators of program failure, such as higher than usual human illness.
While a number of public health and food safety control measures were taken, a decrease in human illness started the week of July 20, ∼2 weeks before actions being taken. The reasons are unclear, but could be attributed to the decrease in water temperature as of the week of July 24, more typical of other seasons. Another possible reason is that processors and retailers may have increased controls or reduced the offer of raw BC oysters. Vp cases associated with self-harvested oysters or water exposures continued to occur at a consistent rate through the middle of September, which indicates that the risk of Vp in the BC ocean waters was present. Based on this, the actions to control the outbreak likely prevented additional cases in restaurant and retail settings by increasing awareness or removing product.
The control measures taken in this outbreak had a widespread impact by affecting all BC live oysters for raw consumption. These widespread actions were deemed necessary as details from cases and tags did not identify specific risk areas or practices.
SST monitoring is used in other Vp control programs internationally (Washington State Department of Health, 2015) and should be considered for BC. Some processors and harvesters measure temperature and test oysters; however, these data were not readily available and were not comprehensive or representative for all processors or harvest areas. In addition, there was no temperature monitoring or Vp testing data for the distribution or supply network or at the restaurant/retail level. Therefore, it was not possible to identify the exact steps in the food chain where the greatest risk was occurring. Improved monitoring throughout the entire food chain and sharing of these data for integrated analysis are recommended.
During this investigation, oyster production data were not available to calculate risk by harvest area, processor, or restaurant. Vp case data pointed to harvest subarea 14–8 as the most likely source of illness. Once 2015 oyster production data were available in 2016, it became clear that subarea 14–8 produces the highest volume of live oysters and the risk associated with it was lower than other subareas (Department of Fisheries and Oceans Canada, 2016). Multiple subareas were linked to cases in this outbreak, demonstrating the widespread distribution of Vp in the environment and oysters. The volume of oysters sold in restaurants and retail could also help determine the same risks at point of consumption. Access to oyster volume data in a timely way during an investigation could help inform risks and control actions in specific harvest areas.
Many operators in the shellfish harvesting and processing industry collect their own data on temperature, presence of Vp, and other indicators. This outbreak highlighted that communicating with industry during an outbreak would be valuable as they could take control options, and would have an opportunity to share their data and observations and input into interpretation of data where appropriate. This model of practice has been established in other jurisdictions (Williams, 2015).
This outbreak identified an immediate need to review Vp surveillance and control programs and to improve communications between all stakeholders, including industry, public health, and regulatory agencies to identify and implement best practices for monitoring and response. Following the outbreak, a national Vibrio working group was struck with 70 recommendations arising to improve Vp control (BC Centre for Disease Control, 2016)
Conclusion
This outbreak was the largest Vp outbreak ever investigated in Canada. It demonstrated that SST may have a significant impact on the levels of Vp occurring in coastal ocean waters, which can lead to increased human illness. As climate continues to change, an outbreak of this nature could occur again and potentially more frequently. Due to this concern, programs for monitoring and response throughout the food chain need to adapt rapidly and include new data to help inform the risks appropriately. To do this, collaboration between all stakeholders, industry, regulatory, food safety, and public health is essential.
Footnotes
Acknowledgments
The authors would like to acknowledge the contributions of Cheryl Foo and Daniel Fong (BCCDC), Allison Nicole Scott (Alberta Health), Linda Lee, Eliza Yue, Andre Youssef, John Hoeve, Kristin Kirby (CFIA), Isabelle Dufrene (HC), and all Environmental Health Officers and Medical Health Officers who were involved in case investigation and laboratories for providing diagnostic support.
Outbreak Investigation Team
Bijay Adhikari PhD, MPH, BVSc, Amrita Maharaj MPA BMSC, Dean Middleton BSc DVM MSc, Rakel Kling, Lynn Wilcott, Juanita Rogers, Gabrielle Kosminder, Robyn Edwards, Laura Reid, and Alberta Health Services.
Disclosure Statement
No competing financial interests exist.