




Abstract
Newport is the third most common Salmonella enterica serotype identified among the estimated 1.2 million human salmonellosis infections occurring annually in the United States. Risk factors for infection and food items implicated in outbreaks vary by antimicrobial resistance pattern. We conducted a descriptive analysis of data from four enteric disease surveillance systems capturing information on incidence, demographics, seasonality, geographic distribution, outbreaks, and antimicrobial resistance of Newport infections over a 10-year period from 2004 through 2013. Incidence increased through 2010, then declined to rates similar to those in the early years of the study. Incidence was highest in the South and among children <5 years old. Among isolates submitted for antimicrobial susceptibility testing, 88% were susceptible to all antimicrobials tested (pansusceptible) and 8% were resistant to at least seven agents, including ceftriaxone. Rates of pansusceptible isolates were also highest in the South and among young children, particularly in 2010. Pansusceptible strains of Newport have been associated with produce items and environmental sources, such as creek water and sediment. However, the role of environmental transmission of Newport in human illness is unclear. Efforts to reduce produce contamination through targeted legislation, as well as collaborative efforts to identify sources of contamination in agricultural regions, are underway.
Introduction
I
Risk factors for Newport vary by antimicrobial susceptibility. For infections with susceptible strains, risk factors include young age, black race, having reptiles or amphibians in the home, international travel, and medical history of stomach ulcers (Varma et al., 2006). For multidrug-resistant strains, recent antimicrobial use and consumption of uncooked ground beef or runny eggs have been associated with infection (Varma et al., 2006).
Newport is diverse in terms of foods implicated in outbreak investigations (Jackson et al., 2013). Tomatoes and ground beef are frequent causes of outbreaks; others include sprouts and other produce, unpasteurized cheese, poultry products, and live poultry exposure (CDC, 2008, 2016b; Jackson et al., 2013). Outbreaks of resistant Newport are frequently associated with products of animal origin, whereas produce-associated outbreaks are often due to susceptible strains (Greene et al., 2008a).
We conducted a descriptive analysis of Newport data from four distinct, but complementary, enteric disease surveillance systems over a 10-year period during 2004–2013. We describe recent patterns in Newport epidemiology, including changes in incidence and antimicrobial resistance.
Materials and Methods
Foodborne Diseases Active Surveillance Network (FoodNet)
FoodNet is an active, population-based surveillance system conducted in 10 sites, representing ∼15% of the United States population (Scallan, 2007). We used FoodNet data to calculate annual incidence of Newport during 2004–2013, overall and by selected demographics. Incidence per 100,000 population over the 10-year period is presented as the mean of the annual rates, with 95% confidence intervals (CIs). We also used FoodNet data to calculate percentages of patients who were hospitalized, died, traveled internationally in the 7 days before illness onset, and were part of a recognized outbreak.
We assessed changes in incidence overall and by age group using the standard FoodNet model, a main-effects negative binomial regression model accounting for changes in population in the surveillance area and site-to-site variation in incidence (Henao et al., 2010). We compared incidence of infections reported to FoodNet each year from 2007 through 2013 with a reference period of 2004–2006.
Laboratory-based Enteric Disease Surveillance (LEDS)
LEDS is a national, passive surveillance system capturing data on laboratory-confirmed Salmonella infections from public health laboratories in all U.S. states and the District of Columbia (CDC, 2011). We used LEDS data to calculate mean annual incidence by state, and regional incidence by month and United States census region (United States Census Bureau, 2017). Because serotype reporting for Salmonella in LEDS varied substantially by state and year, we calculated the percentage of fully serotyped isolates by state and year, excluding those states for which the mean percentage serotyped across the 2004–2013 study period was <80% (eight states and the District of Columbia).
National Antimicrobial Resistance Monitoring System (NARMS)
NARMS at the Centers for Disease Control and Prevention is responsible for monitoring prevalence and trends in antimicrobial resistance among enteric bacteria isolated from humans in all U.S. states (CDC, 2015a). We used NARMS data to describe resistance in Newport isolates. Isolate collection and antimicrobial susceptibility testing have been described previously (Medalla et al., 2013; CDC, 2015a). Briefly, for routine surveillance, public health laboratories are asked to submit every 20th nontyphoidal Salmonella isolate to CDC for susceptibility testing. NARMS additionally conducts enhanced sampling of outbreak isolates (Brown et al., 2017); except where specified, we used only routine surveillance isolates. We limited data to isolates that were either (i) susceptible to all tested antimicrobials (pansusceptible) or (ii) resistant to (at minimum) all of the following: ampicillin, chloramphenicol, streptomycin, sulfisoxazole, tetracycline, amoxicillin-clavulanic acid, and ceftriaxone (ACSSuTAuCx), an important resistance pattern that emerged among Newport isolates in the late 1990s (Medalla et al., 2013). Together with pansusceptible isolates, these account for >95% of Newport surveillance isolates tested by NARMS (CDC, 2015a). We stratified by resistance pattern to describe mean age, and calculated percentages and annual rates of susceptible and resistant isolates, by age group (<5 and ≥5 years old), census region, and month. Rates were calculated as the number of isolates submitted to NARMS per 1,000,000 population and were not adjusted to account for the 1-in-20 sampling scheme.
National Outbreak Reporting System (NORS)
NORS is a web-based platform for outbreak reporting by state, local, and territorial health departments (Hall et al., 2013). We used information on Newport outbreaks (≥2 cases epidemiologically linked to a common exposure) to describe the number of cases, number of affected states, transmission mode (e.g., foodborne, person-to-person, animal contact; collected systematically since 2009), and for foodborne outbreaks, the implicated food. Implicated foods were categorized into one of 24 single-food categories (CDC, 2015b). We examined the number of outbreaks with confirmed etiology reported during 2004–2013 and calculated the percentage of outbreaks by region. We examined antimicrobial resistance for the subset of outbreaks attributed to a single implicated food category with isolates tested by NARMS through enhanced outbreak sampling (Brown et al., 2017).
Results
FoodNet
During 2004–2013, FoodNet recorded 7630 cases of laboratory-confirmed Newport, a mean annual incidence of 1.6 cases per 100,000 population (Table 1). Incidence ranged from 1.2/100,000 in 2006 to 2.3 in 2010. Incidence was highest among children <5 years old (7.6/100,000, 95% CI 6.5–8.6). Among 6414 (84%) cases with complete race information, incidence was highest among whites (1.5/100,000, 95% CI 1.3–1.7) and lowest in multiracial persons (0.5, 95% CI 0.3–0.8) and Asians (0.6, 95% CI 0.5–0.7). Among 7311 (96%) cases with known hospitalization status and 7132 (93%) with known vital status, 2243 (31%) were hospitalized and 22 (<1%) died. Four percent of cases were associated with a recognized outbreak and 3% traveled internationally in the 7 days before illness onset.
Mean 2004–2013 incidence used for demographic characteristics and crude incidence used for incidence by year.
Compared with 2004–2006, incidence was significantly higher in 2007 and 2010–2012; the largest increase was 58% (95% CI 35–85) in 2010 (Fig. 1). Stratified analyses showed that, compared with 2004–2006, incidence in children <5 years old was significantly higher beginning in 2009, with the largest increase in 2010 (70%, 95% CI 45–100). Among 5–19 year olds, incidence was significantly higher for each year except 2008 and 2013, with increases ranging from 41% (95% CI 7–86) in 2007 to 89% (95% CI 48–141) in 2010. Incidence among adults was significantly different only during 2010–2012. Increases ranged from 34–45% in adults 20–49 years old and 48–94% among those ≥50 years old.
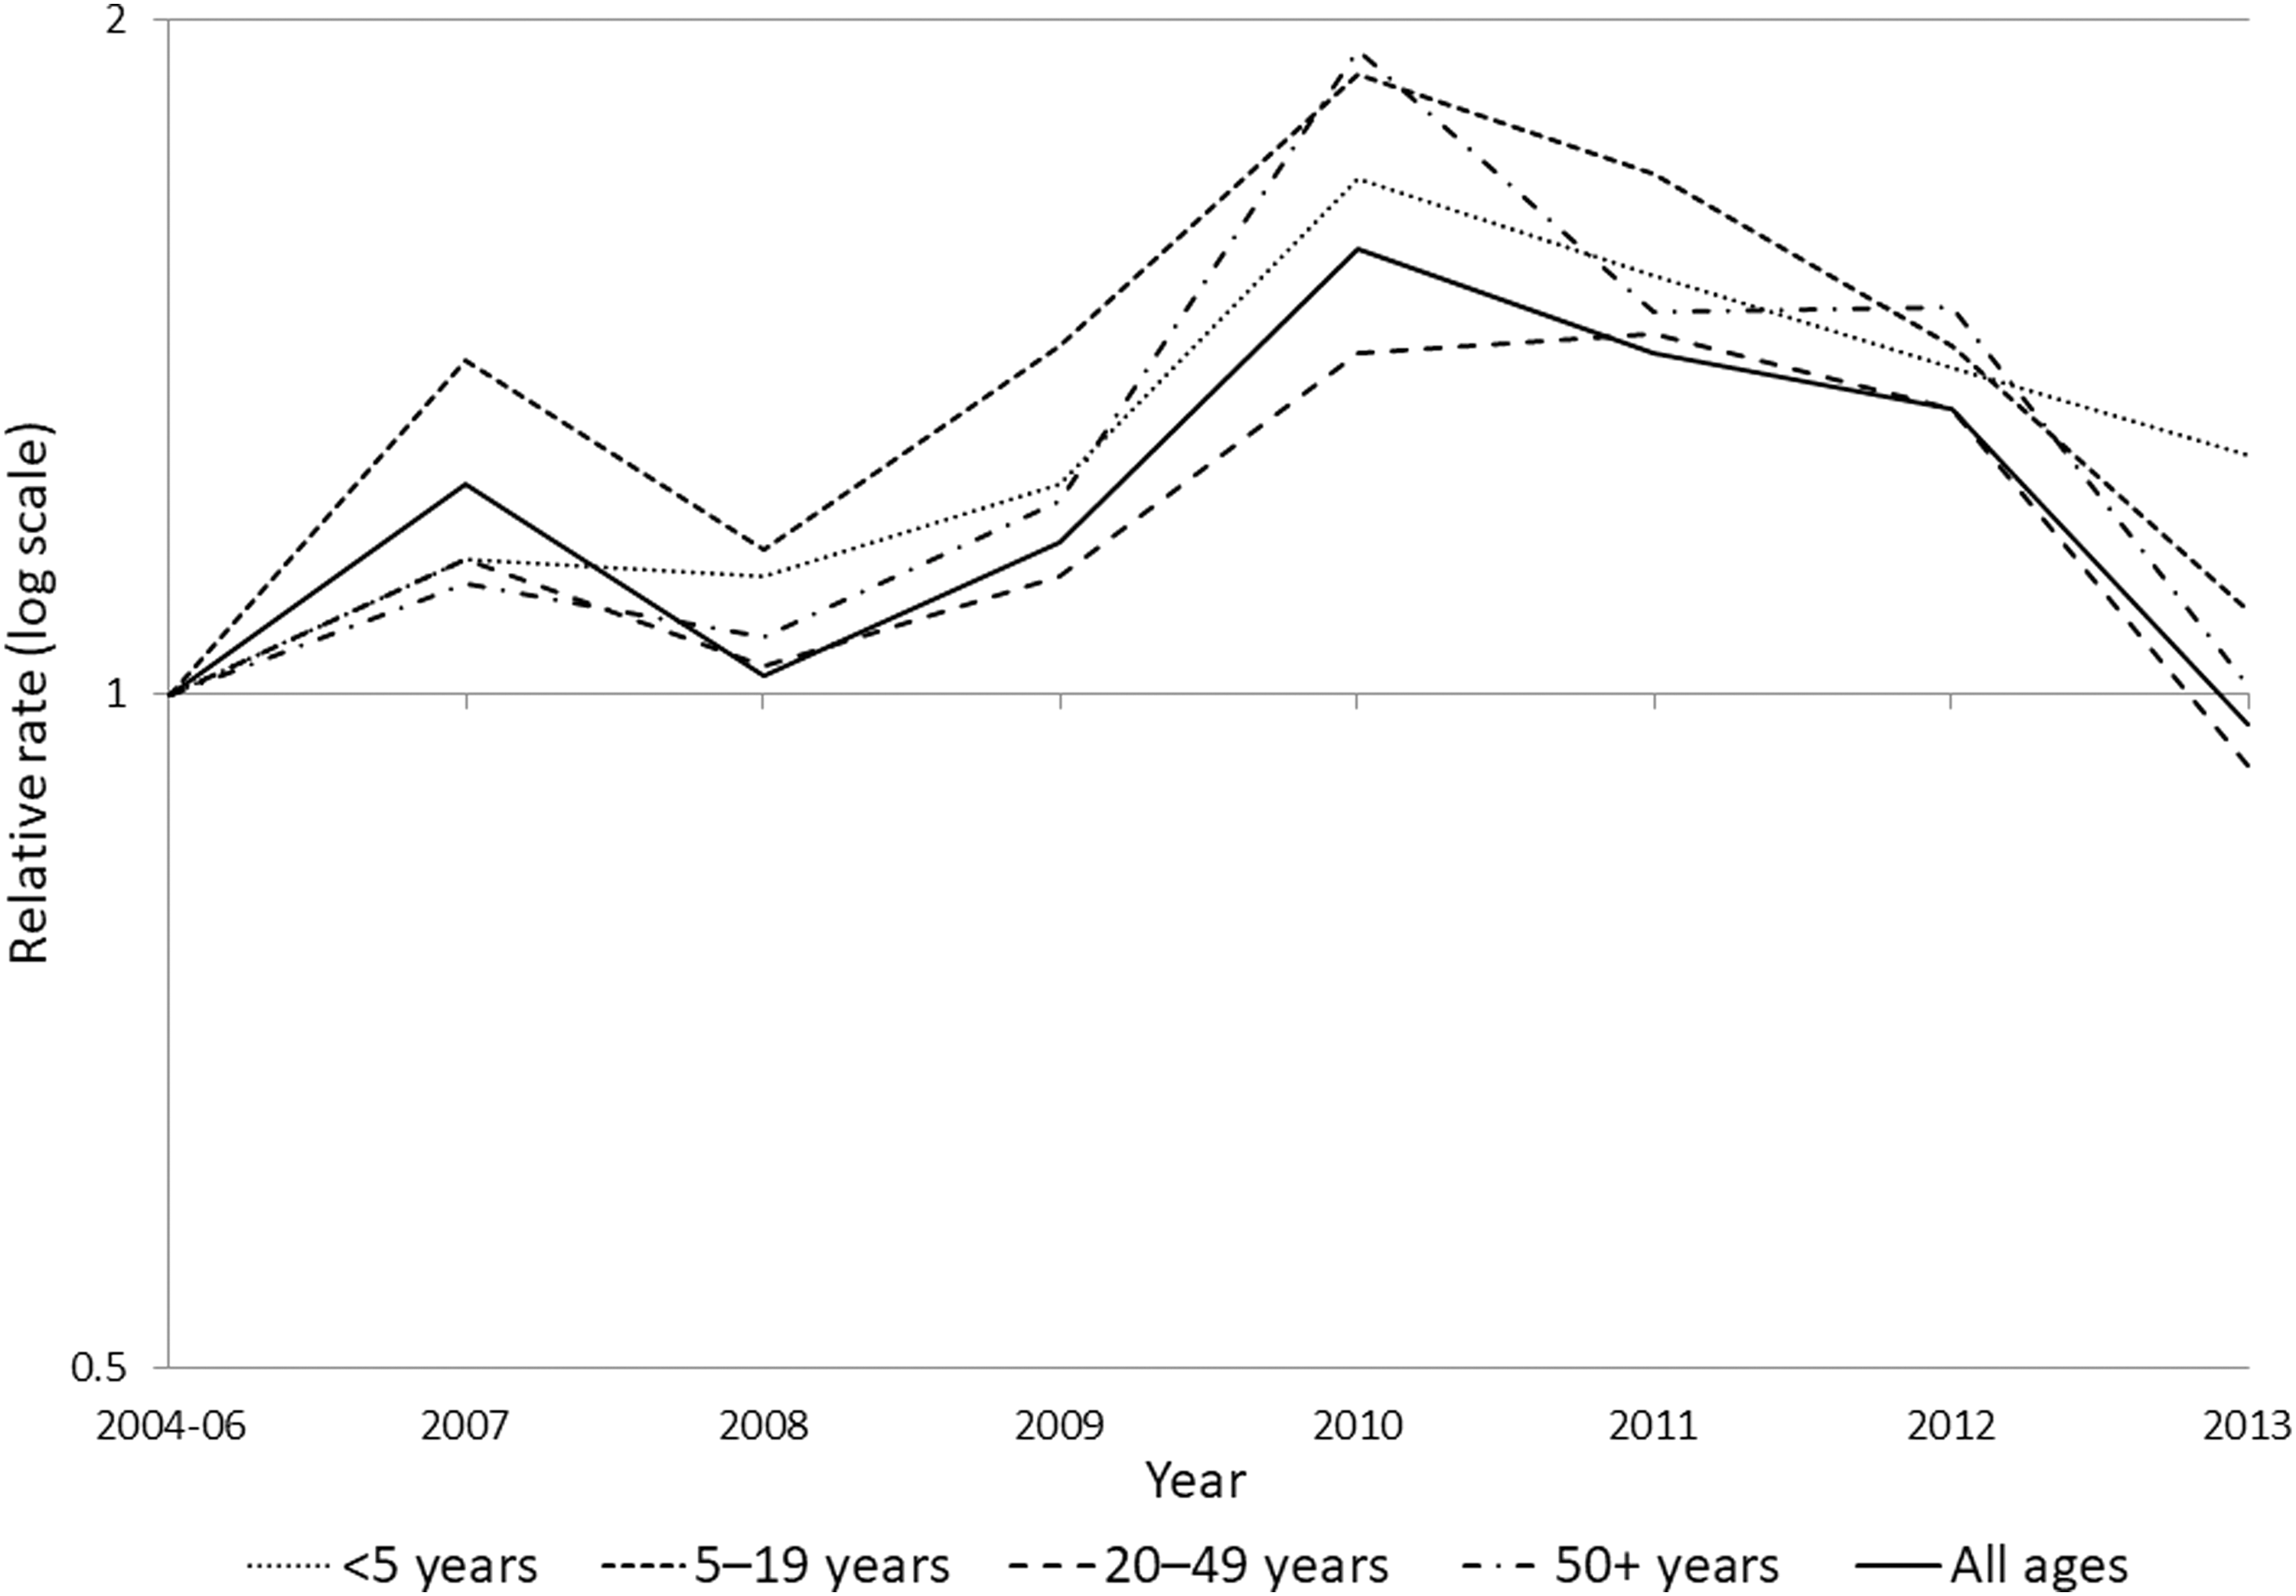
Relative rates of Salmonella serotype Newport infections compared with 2004–2006, by age group and year, Foodborne Diseases Active Surveillance Network (FoodNet), 2004–2013. The relative rate is the incidence rate in a given year relative to the average incidence of the 2004–2006 comparison period. A relative rate above the line at 1 indicates an increase compared with 2004–2006, below the line represents a decrease, and at the line represents no change.
Laboratory-based Enteric Disease Surveillance (LEDS)
Among the 42 states for which mean annual percentages of Salmonella isolates serotyped were ≥80%, incidence of Newport was highest in states in the South census region. The highest mean incidences were in Arkansas (5.9/100,000 population, 95% CI 5.0–6.8), Mississippi (4.6, 95% CI 3.9–5.4), and Oklahoma (4.0, 95% CI 3.4–4.7, Fig. 2).
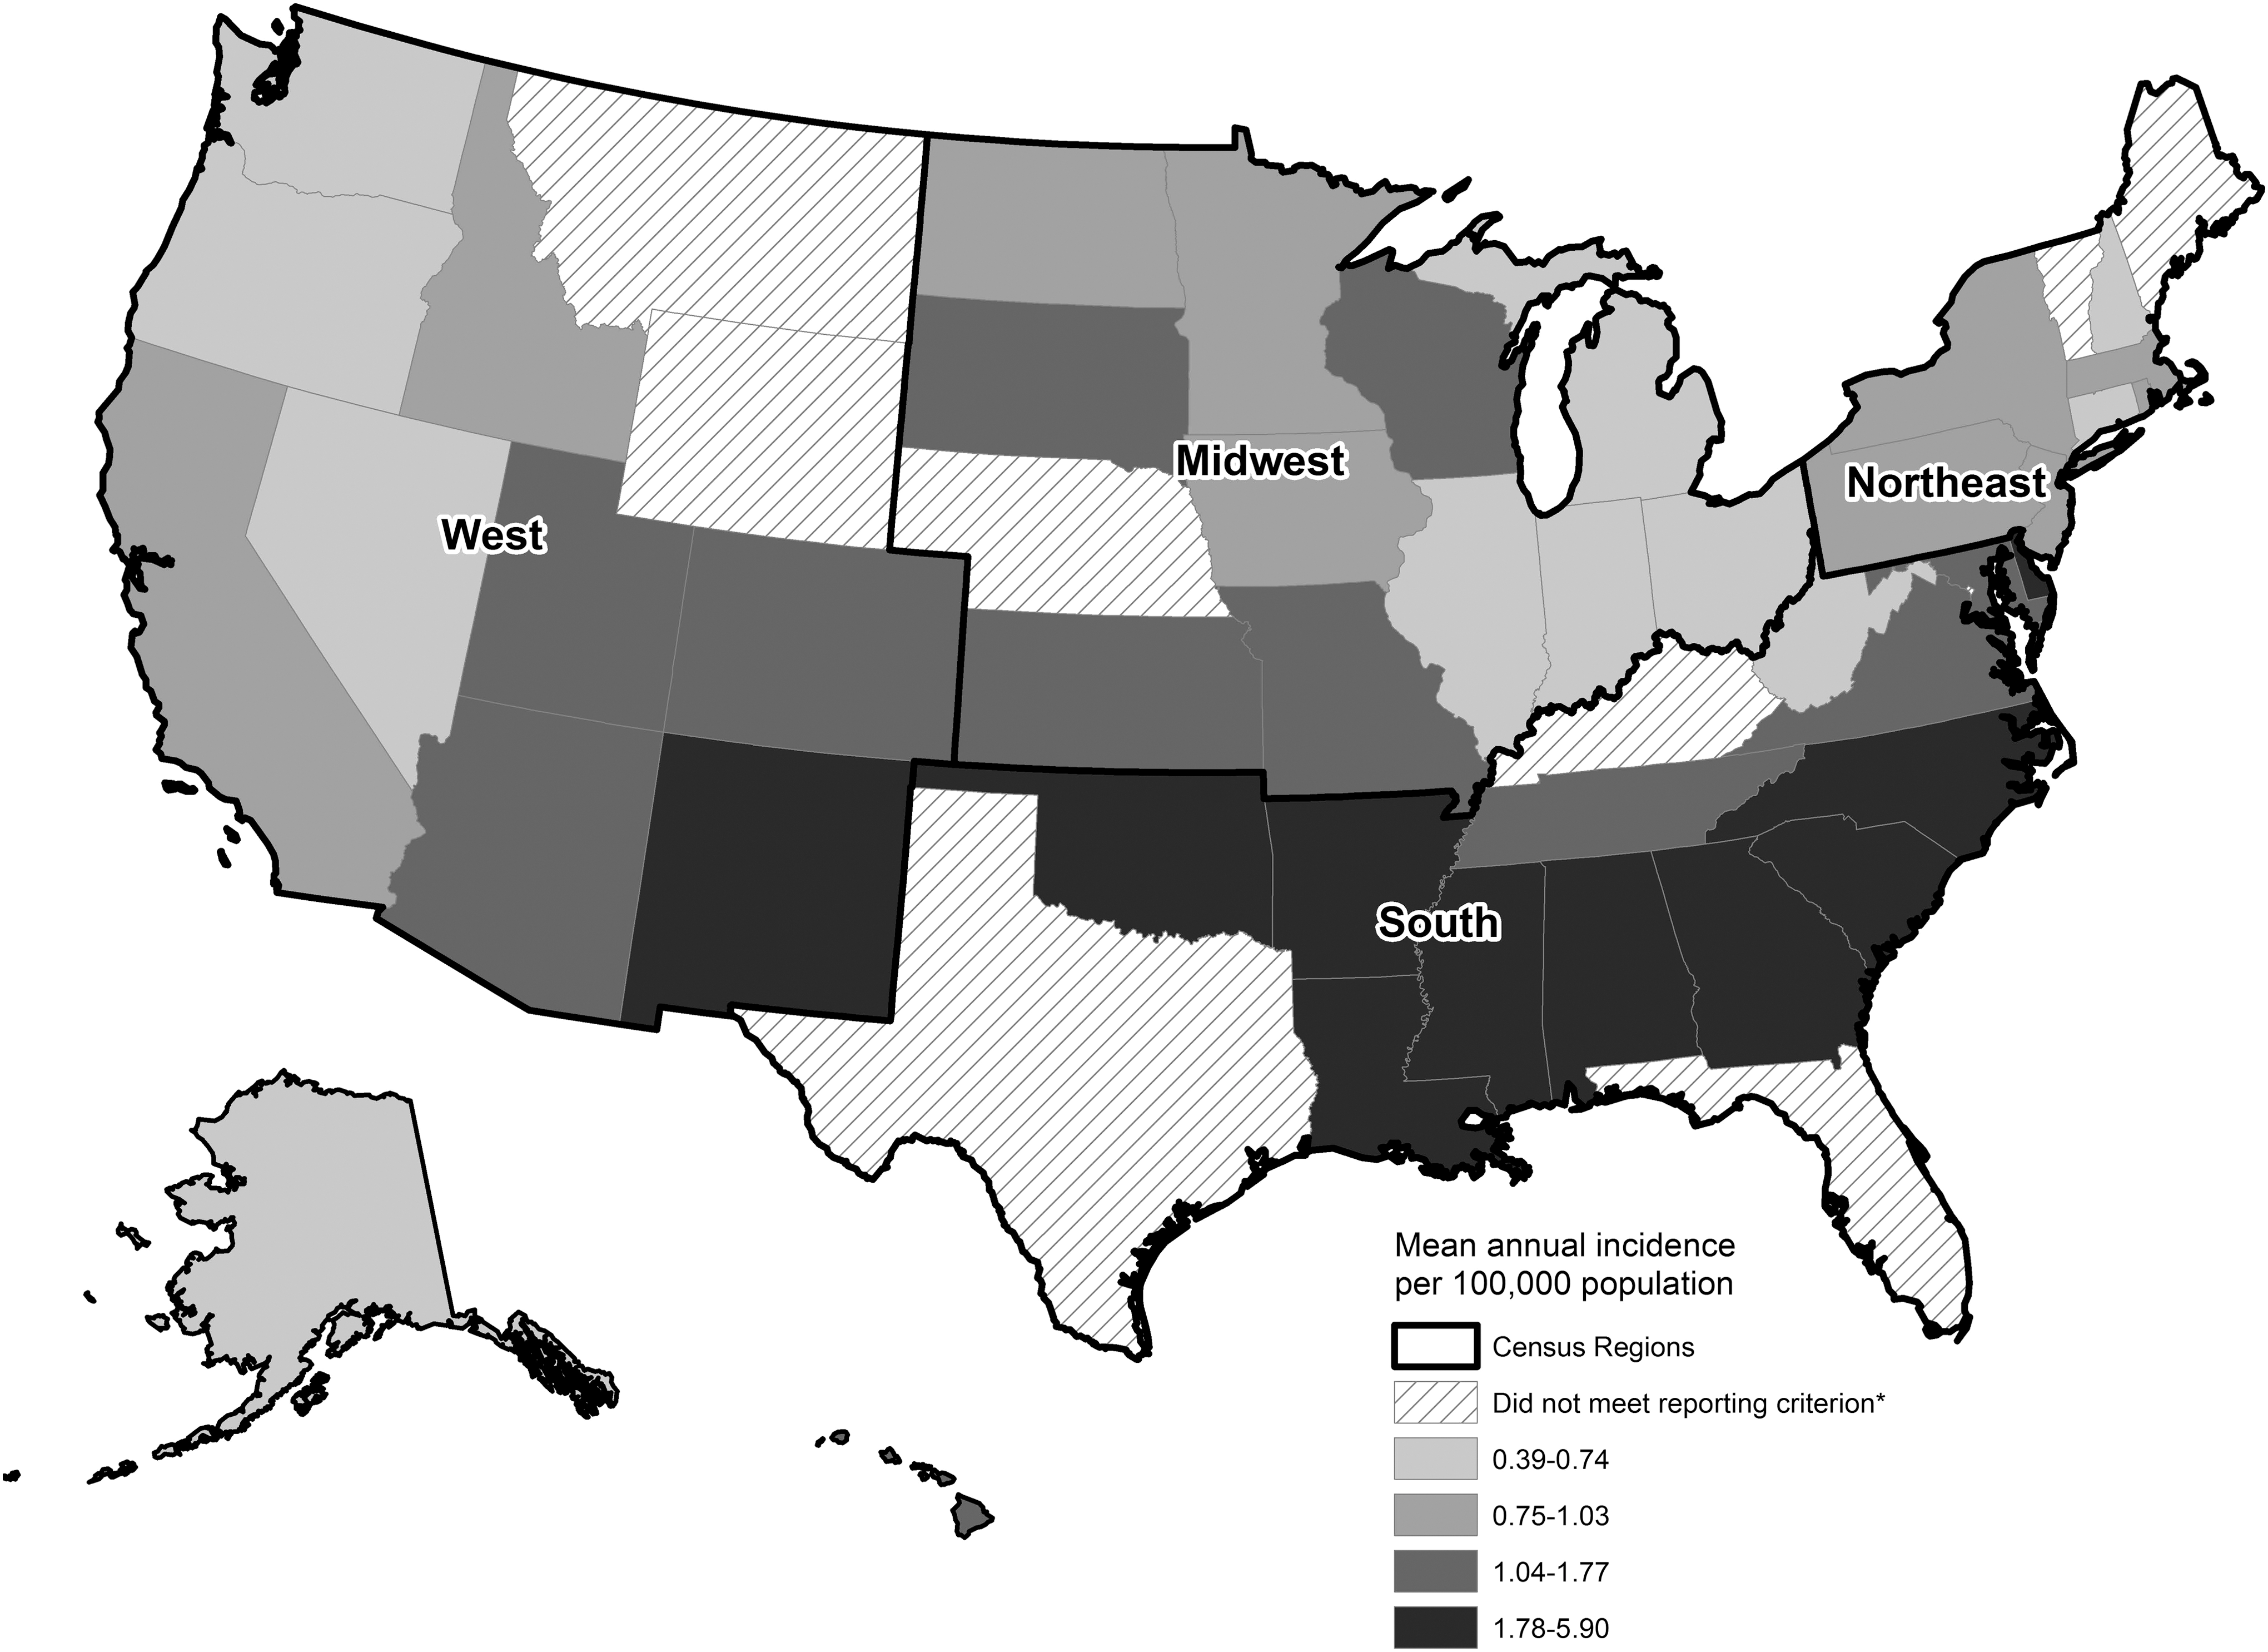
Incidence of Salmonella serotype Newport infection by state, LEDS, 2004–2013. *Reporting criterion—mean annual percentage serotyped of at least 80%. LEDS, Laboratory-based Enteric Disease Surveillance.
Incidence was highest in late summer, with the highest incidence in August (Fig. 3). From January through April, incidence was similar for all regions. Incidence was higher in the South from May through December, and in August, incidence was 0.6/100,000 population in the South compared with <0.2 in other regions.
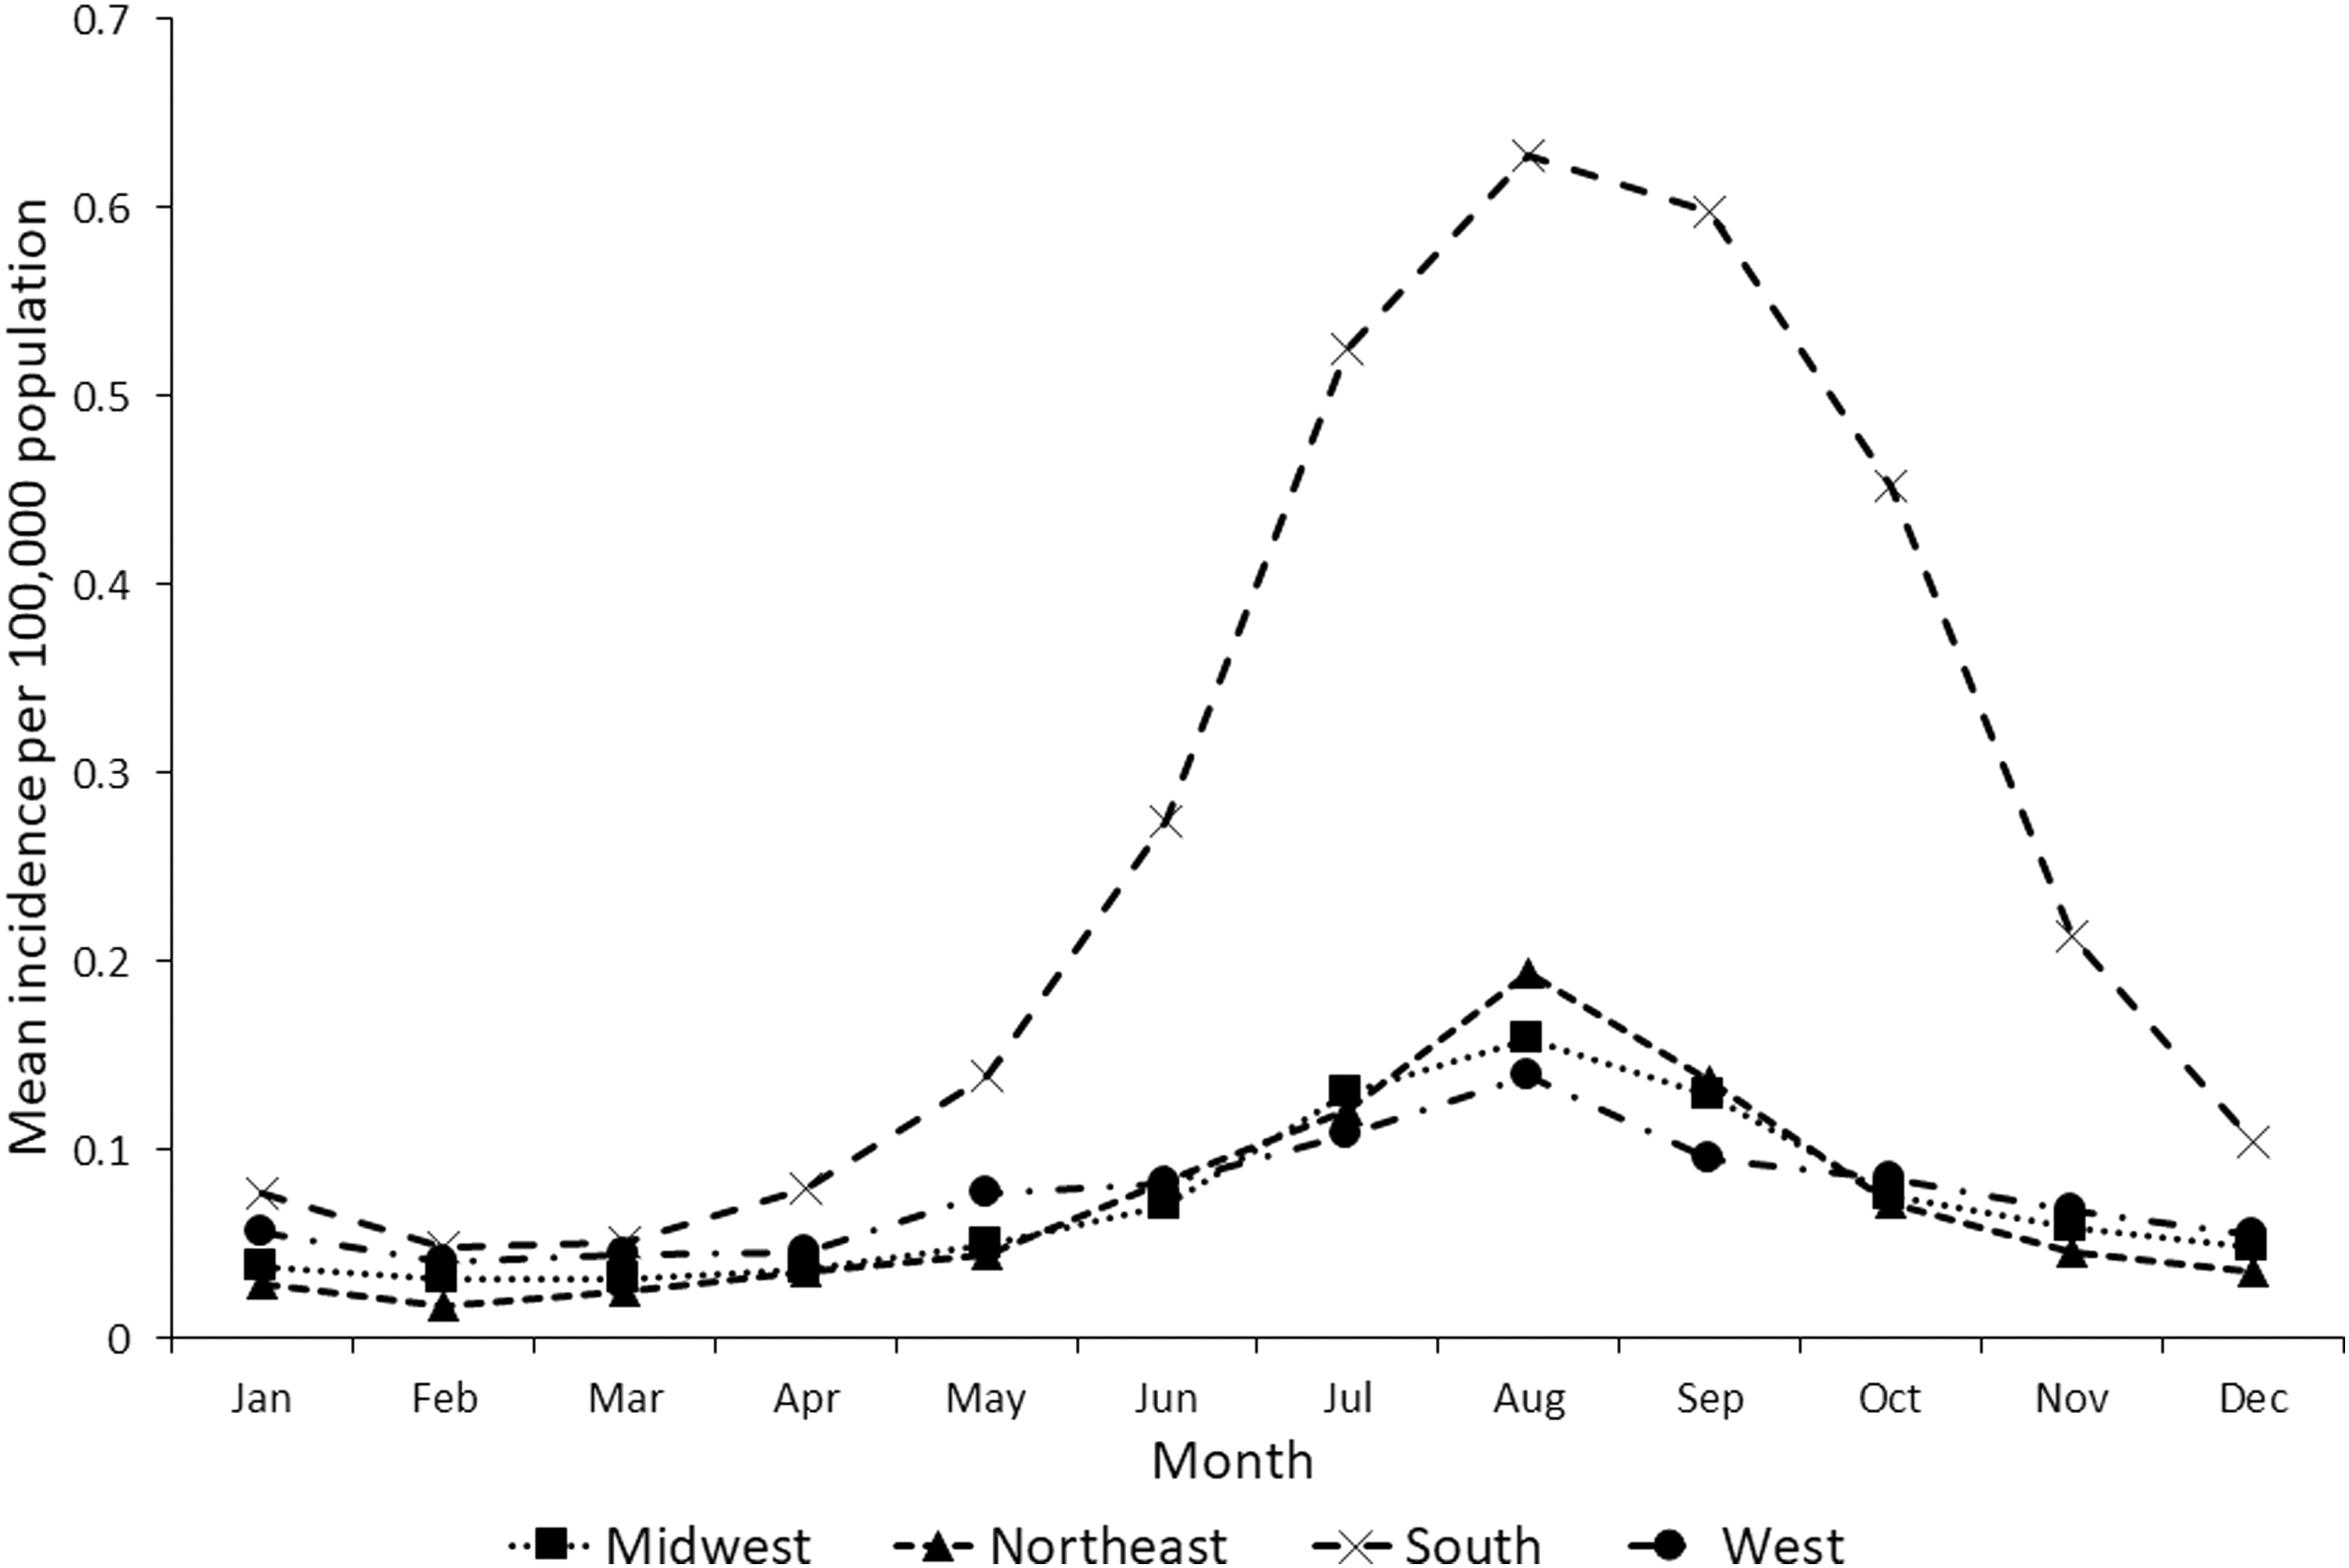
Incidence of Salmonella serotype Newport infection by United States census region and month, LEDS, 2004–2013.
National Antimicrobial Resistance Monitoring System (NARMS)
During 2004–2013, 2395 Newport isolates were tested by NARMS. Of these, 2103 (88%) were pansusceptible, 197 (8%) resistant to at least ACSSuTAuCx, and 95 (4%) fit neither category and were excluded from further analyses. The mean annual rate (not corrected for sampling; see methods) of pansusceptible isolates was 0.69/1,000,000 population (95% CI 0.60–0.77) and 0.07 population (95% CI 0.05–0.08) for ACSSuTAuCx-resistant isolates.
Among the 2300 isolates included, 2166 (94%) had recorded patient age. Mean age was 30.6 years (95% CI 29.3–31.8) for patients with pansusceptible Newport and 36.4 (95% CI 32.8–40.1) for resistant Newport. Stratified by age and resistance, the highest mean annual rate was for pansusceptible isolates in children <5 years at 3.1/1,000,000 population (95% CI 2.7–3.5); rates ranged from 2.4 in 2005 to 3.9 in 2010 (Fig. 4a). The mean annual rate of pansusceptible isolates in persons ≥5 years old was 0.48/1,000,000 (95% CI 0.41–0.55); annual rates ranged from 0.36 in 2004 to 0.65 in 2010. Rates of ACSSuTAuCx-resistant isolates were low and largely stable for both age groups. Pansusceptible isolates from children <5 accounted for 28% of isolates and pansusceptible isolates from persons ≥5 accounted for 63% of isolates (Fig. 4b). In persons ≥5, ACSSuTAuCx resistance declined from 13% in 2004 to 5% in 2013.
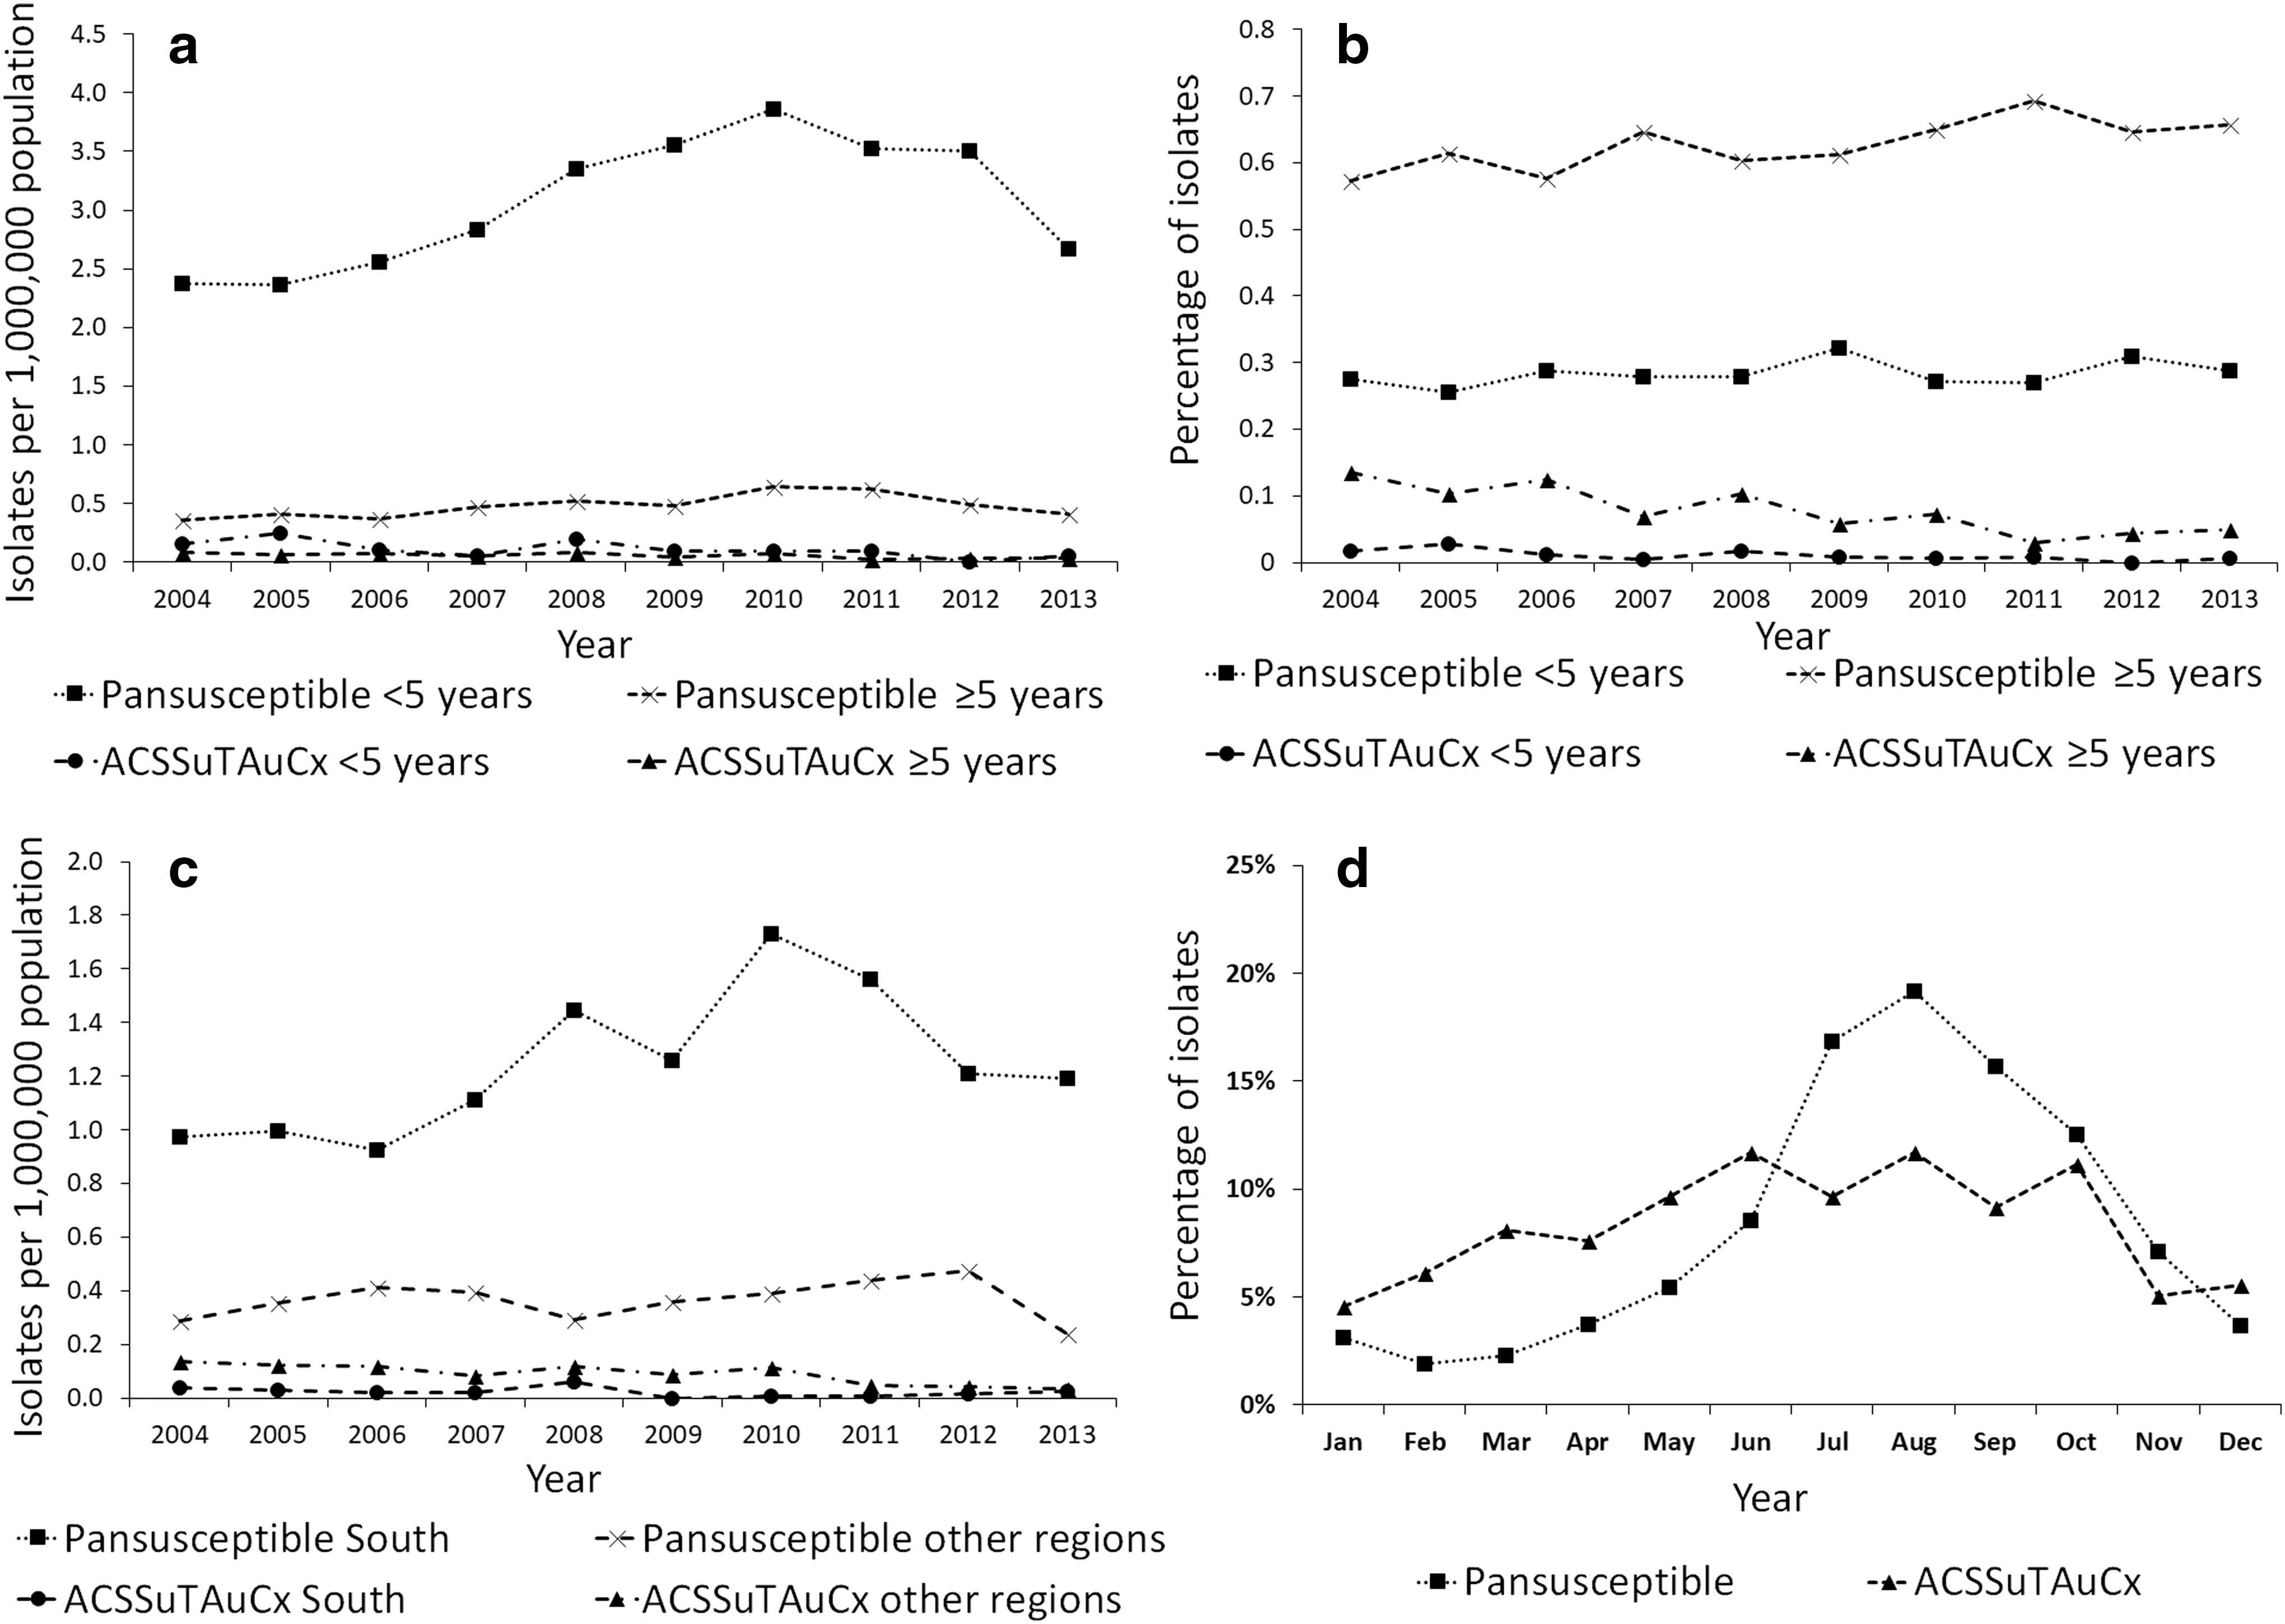
The mean annual rate of pansusceptible isolates was highest in the South, at 1.2/1,000,000 (95% CI 1.1–1.4, Fig. 4c). Rates of pansusceptible isolates in other regions were similar to each other (Midwest: 0.38 [95% CI 0.29–0.46], Northeast: 0.39 [95% CI 0.34–0.44], and West: 0.33 [95% CI 0.27–0.39]). Conversely, the mean rate of ACSSuTAuCx-resistant isolates was lowest in the South (0.02/1,000,000, 95% CI 0.01–0.04); the rate was highest in the West (0.13, 95% CI 0.08–0.17), followed by the Midwest (0.08, 95% CI 0.05–0.11) and Northeast (0.06, 95% CI 0.03–0.09).
Pansusceptible isolates were more common in late summer (52% submitted during July–September) and less common in winter (7% during January–March, Fig. 4d). The seasonal pattern for ACSSuTAuCx-resistant isolates was more diffuse, with 30% of isolates submitted during July–September and 19% during January–March.
National Outbreak Reporting System (NORS)
During 2004–2013, 123 outbreaks of Newport were reported (range 4–21 per year, mean 12, Fig. 5). Size ranged from 2 to 209 persons ill (mean 24). Eighteen outbreaks (15%) were multistate; these had a mean of 60 persons ill per outbreak (95% CI 32–88) compared with 18 for single-state outbreaks (95% CI 13–24). Among single-state outbreaks, the total number of outbreaks by region was similar, with the Midwest accounting for 29%, South for 28%, and Northeast and West for 22% each. Most (81%) outbreaks were attributed to contaminated food; three (2%) were person-to-person and 20 (16%) had an undetermined transmission mode. Among 100 foodborne outbreaks, 36 (36%) were attributed to a specific food category, consisting of seeded vegetables (12 outbreaks), beef (6), fruits (5), pork (3), turkey (2), chicken (2), sprouts (2), vegetable row crops (2), dairy (1), and root/underground vegetables (1). Among seeded vegetable-associated outbreaks, 10 of 12 were attributed to tomatoes. Of the subset of outbreaks with resistance information and a single implicated food category, there were 10 pansusceptible outbreaks: four associated with seeded vegetables (tomatoes), two with fruit, and one each with vegetable row crops, pork, beef, and turkey. There were three outbreaks of ACSSuTAuCx-resistant infections: all due to beef and additionally resistant to ceftiofur (Cf) and cefoxitin (Fox). Two additional outbreaks of resistant infections were identified: pattern ACSTAuCxCfFox associated with pasteurized milk and pattern AAuCxCfFox associated with tomatoes.
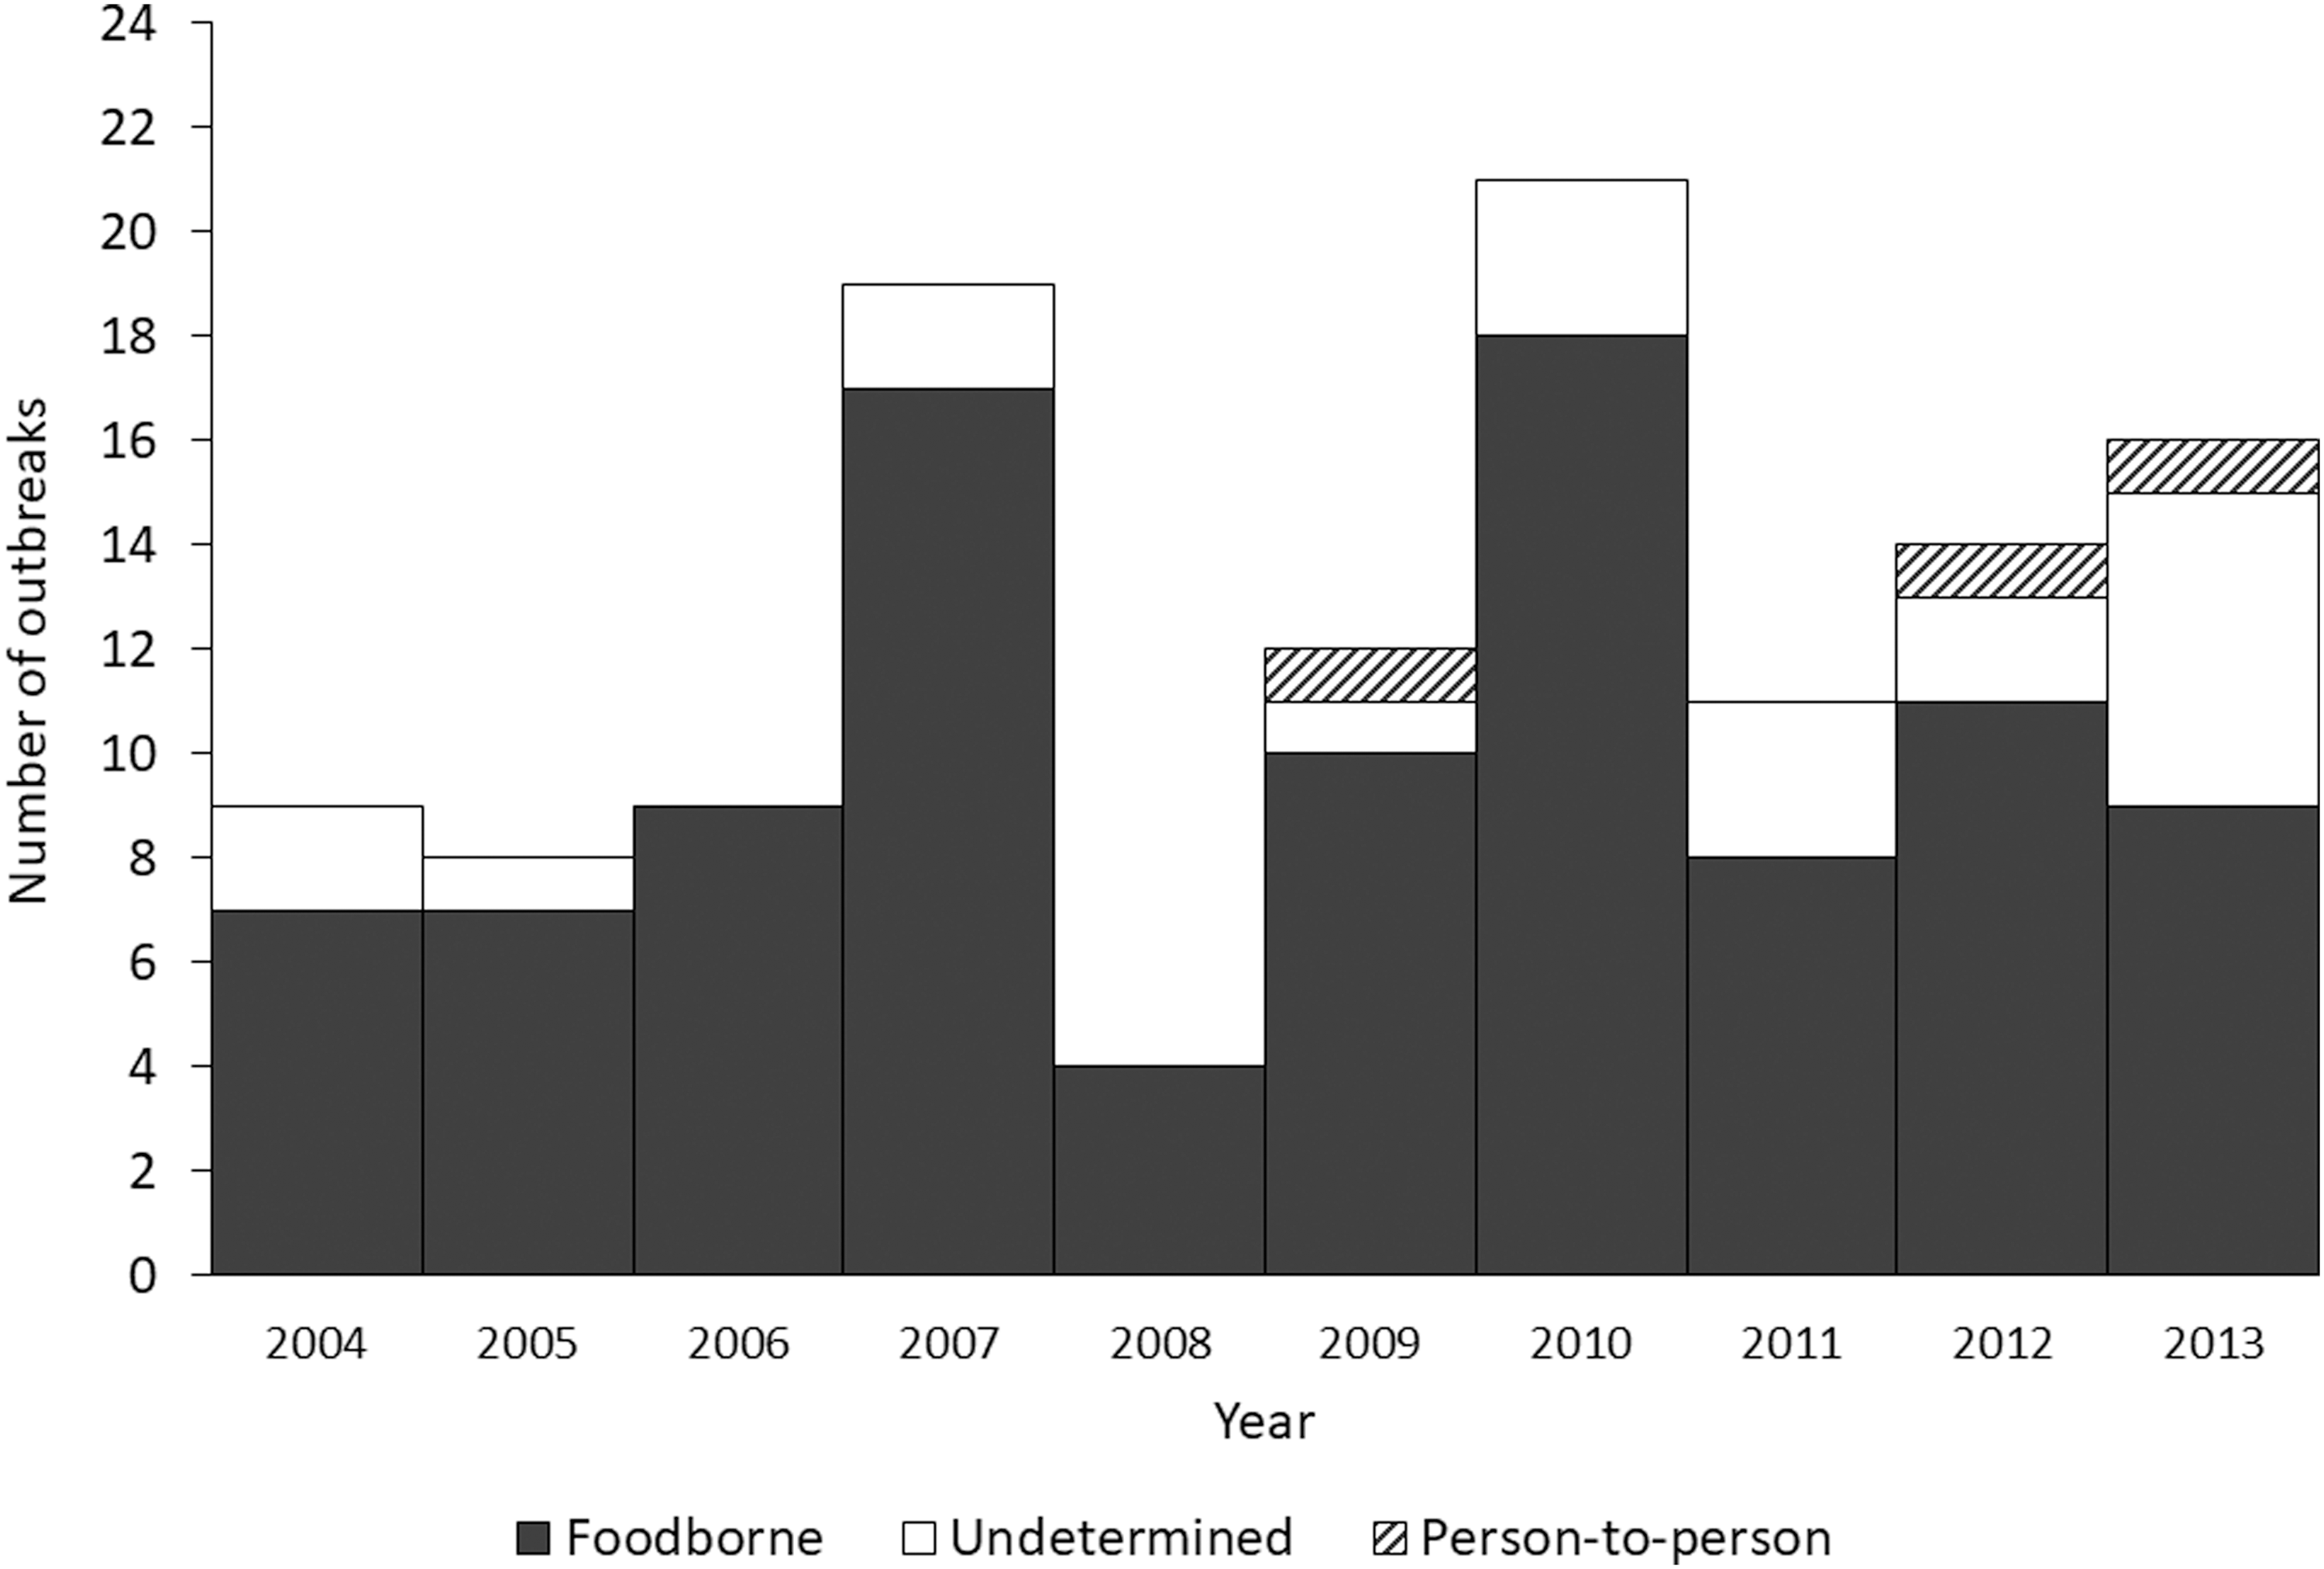
Number of Salmonella serotype Newport outbreaks, by transmission mode, National Outbreak Reporting System (NORS), 2004–2013.
Discussion
Our comprehensive analysis of four surveillance systems highlights key regional and demographic features of Newport infections in the United States. These findings provide a broad picture of the epidemiology of this important Salmonella serotype and highlight the value of analyzing multiple surveillance systems in concert.
Since the 1980s, there have been three notable periods of increasing and then decreasing incidence of Newport infections (CDC, 2016a), each roughly temporally associated with a different pattern of antimicrobial resistance. The first increase began with a multidrug-resistant Newport outbreak in 1985 traced to dairy farms, which included resistance to chloramphenicol (Spika et al., 1987). This was an uncommon finding at that time and was associated with use of chloramphenicol in dairy cows on those farms. The outbreak strain was subsequently found to be common on California dairies throughout the late 1980s (Berge et al., 2004). The second increase corresponded with emergence of ACSSuTAuCx-resistant Newport hypothesized to be of a different genetic lineage than earlier resistant strains, despite also being found on dairy farms and in dairy cattle (Gupta et al., 2003; Berge et al., 2004). Human and cattle Newport isolates with this resistance pattern were first seen in NARMS in 1998 (FDA, 2011b). The proportion of NARMS Newport isolates with ACSSuTAuCx resistance increased during 1999–2001, peaking at 25% and remaining above 20% through 2003 (CDC, 2015a). National incidence was also high around this time, with a peak in 2002 and lower incidence in subsequent years (CDC, 2016a).
Our study period encompasses a third wave of increasing and subsequently decreasing incidence, consisting primarily of pansusceptible Newport infections. Incidence in FoodNet peaked in 2010, as did the number of outbreaks reported to NORS and the rate of pansusceptible Newport isolates identified in NARMS. The reasons for these increases are unclear and do not reflect a single known outbreak or event.
The highest incidence was in the South census region, and most NARMS isolates submitted from the South were pansusceptible. Pansusceptible Newport has been associated with produce items and environmental sources (Greene et al., 2008a; Patchanee et al., 2010), and pansusceptibility has been theorized to be a marker for environmental and possibly produce-associated Newport strains (Jackson et al., 2013). Seven of 10 pansusceptible outbreaks in NORS were produce-associated; four implicated tomatoes. Recurrent outbreaks associated with a single pulsed-field gel electrophoresis (PFGE) pattern have been linked with tomatoes and cucumbers grown on the eastern shore of Virginia on the Delmarva Peninsula (Greene et al., 2008a; Angelo et al., 2015; Bell et al., 2015). Newport isolates with this PFGE pattern were found in creek water, sediment, and goose feces in the eastern shore agricultural area over two concurrent growing seasons, suggesting persistent environmental contamination (Bell et al., 2015). Fecal sampling of wildlife in the area found Newport with this PFGE pattern in gull feces (Gruszynski et al., 2014a, b). The presence of reptiles and amphibians in the outdoor environment has also been posited as a driver of serotypes that are largely confined to the South, show sharp summer seasonality, and occur predominantly in young children (Srikantiah et al., 2004). Although Newport is not confined to the South, 60% of NARMS isolates included in this study were pansusceptible isolates from the South. The rate of pansusceptible isolates in the South was three times that of the rest of the country.
In contrast, rates of ACSSuTAuCx-resistant Newport were lowest in the South. ACSSuTAuCx-resistant Newport has frequently been associated with dairy cattle, and their milk and beef products (Gupta et al., 2003; Karon et al., 2007). Likewise, beef was implicated in all three known ACSSuTAuCx-resistant Newport outbreaks in NORS. We found the highest rates of ACSSuTAuCx-resistant Newport in the West and Midwest census regions; these regions contain the country's top two milk-producing states with the highest absolute number of dairy cattle, California and Wisconsin (USDA, 2016). An earlier ecological analysis showed regions with higher dairy cattle density have greater proportions of resistant infections than those with lower density (Greene et al., 2008b). The decline in ACSSuTAuCx resistance since the early 2000s is encouraging. However, as ACSSuTAuCx resistance declined in Newport, it increased in Dublin (FDA, 2016), another cattle-associated Salmonella serotype.
Our finding that the highest incidence occurred in children <5 years is consistent both with high rates of salmonellosis observed in young children in general and with previous studies that found Newport to be especially common among young children (Schutze et al., 1998; CDC, 2012; Cheng et al., 2013). Moreover, our study corroborates the findings by Greene et al. (2008b) that infections in young children are almost exclusively pansusceptible. Young children are likely to have different exposures than adults and may be at increased risk for salmonellosis acquired through nonfoodborne routes because of their higher frequency of crawling, outdoor play, and animal exposures (Sockett and Rodgers, 2001).
Surveillance for enteric diseases in the United States relies on multiple specialized systems, collecting separate sets of data in overlapping populations. FoodNet's active surveillance platform provides the most complete case ascertainment and its established methodology for estimating changes in incidence is used to monitor trends and burden in foodborne disease in the United States. Although NARMS isolates comprise a 1-in-20 sample of Salmonella, this system is used to track antimicrobial resistance in foodborne and other enteric bacteria nationally. LEDS and NORS provide passively reported nationwide data for which completeness and representativeness are less well understood. However, the national scope of LEDS and ability of NORS to attribute outbreaks to specific foods provide insights not available elsewhere. Because each system answers different questions and has known biases or limitations that limit their use singly, this combined analysis across all four systems provides a more complete picture than any single system could. Although a direct comparison among systems was not done systematically given differences in data collection and populations under surveillance, parallel increases in and around 2010 validate findings across systems. Data inconsistencies between systems were minor and primarily in the form of slightly different year-to-year patterns. As such, we presented results from the most representative system for each attribute.
FoodNet's race, ethnicity, and international travel data should be interpreted cautiously, because of missing data heavily concentrated in the earlier part of our study period. Additionally, several states were excluded from LEDS-based analyses because of low percentages of serotyped Salmonella isolates, including the large Southern states of Florida and Texas. How their inclusion might have impacted regional analyses is unclear. Furthermore, the decision to exclude states with fewer than 80% of isolates serotyped was arbitrary. Although most states had either ≥90% or <50% serotyped, five states (South Carolina, Ohio, Kentucky, Vermont, and the District of Columbia) were between these extremes.
Conclusions
The factors driving the increase and subsequent decrease in rates of pansusceptible Newport remain unknown. Despite numerous environmental signals, the exact mechanisms by which persons, especially young children, become infected are not fully understood. Efforts are being made to address produce contamination through the Delmarva Produce Safety Task Force and the recently finalized Standards for the Growing, Harvesting, Packing, and Holding of Produce for Human Consumption rule of the Food Safety Modernization Act (FDA, 2011a; Gensheimer and Mitchell, 2015). Further elucidation of specific sources of produce contamination and other sources of human infection would allow for implementation of control measures to prevent further illness, including targeted interventions to prevent illness in young children.
Footnotes
Acknowledgments
The authors would like to acknowledge Daniel Dewey-Mattia (Enteric Diseases Epidemiology Branch, Centers for Disease Control and Prevention, Atlanta, GA) for his valuable contribution to this article. The opinions expressed are those of the authors and do not necessarily reflect those of the Centers for Disease Control and Prevention.
Disclosure Statement
No competing financial interests exist.