
Abstract
Yeast cell wall (YCW) products are used worldwide as alternatives to antibiotics growth promoters for health and performances improvement in livestock. The success of yeast and YCW products as feed additives in farm animals' nutrition relies on their capacity to bind enteropathogenic bacteria and on their immunomodulatory activity. In vivo studies report their anti-infectious activity on Gram-positive pathogens like clostridia. However, the in vitro antimicrobial activity of YCW products seems to be limited to some Gram-negative enteropathogens, and literature lacks in vitro evidences for antimicrobial effect of YCW products against Clostridium perfringens. This study aims to measure the antimicrobial activity of YCW products on C. perfringens. Five different YCW products were assayed for their capacity to inhibit the growth of C. perfringens, by analyzing the growth kinetics of the pathogen. All YCW products inhibited the growth of the pathogen, by reducing the growth rate and the maximum growth value and extending the lag phase duration. The effect on the growth parameters was product and dosage dependent. The most effective YCW (namely YCW2), at the minimum effective concentration of 1.25 mg/mL, increased the lag phase duration by 3.6 h, reduced the maximum growth rate by >50%, and reduced the final cell count by 102 colony-forming unit per milliliter in 24 h, with respect to the control. YCW products did not show a strain-dependent impact on C. perfringens growth when tested on different strains of the bacterium.
Introduction
C
After EU ban in 2006 on the use of antibiotic drugs as growth promoters (antibiotic growth promoters [AGPs]) and for prophylactic purposes, antimicrobial additives are increasingly used in farm animals nutrition as substitutes of AGPs, and some natural substances are being used or researched for their antimicrobial effect, like prebiotics (inulin, fructo-oligosaccharides, and mannan-oligosaccharides), probiotics (yeasts and lactic acid bacteria) and anti-infectious substances (Strickling et al., 2000; Jouany and Morgavi, 2007; Ravindran, 2013; Murugesan et al., 2015; Zanini et al., 2015).
Yeast cell wall (YCW) products, derived from brewery or bakery yeast, are used worldwide as an alternative to AGPs concerning the promotion of health and performance in livestock (Ghosh et al., 2012; Fowler et al., 2015). The success of YCW products as growth promoters is based on their capacity to bind enteropathogenic bacteria (Ganner et al., 2013) and on their immunomodulatory activity (Kogan and Kocher, 2007). YCW products are suggested as anti-adhesive agents and are thus proposed to prevent attachment of pathogenic bacteria to the intestinal epithelium of the host, by interfering on the adhesion of bacterial fimbriae or afimbrial adhesins with surface lectins of the intestinal cells of the host, hence preventing the colonization of the intestinal mucosa by the pathogenic bacteria (Songer, 1996).
Using the in vitro agglutination method and microscopy, different authors showed that mannan-oligosaccharides in YCW binds Escherichia coli, Salmonella, and Vibrio cholerae (Eshdat et al., 1978; Mirelman et al., 1980; Oyofo et al., 2015; Spring et al., 2000; Trevisi et al., 2012). A quantitative in vitro microplate assay was developed by Ganner et al. (2010, 2013) and is based on the measurement of the optical density as growth indicator of adhering bacteria. The authors demonstrated that a purified YCW can differentially bind Gram-negative pathogens, such as some E. coli strains and Salmonella spp., but it does not bind Gram-positive bacteria of the genera lactobacilli and bifidobacteria, and C. perfringens.
On the whole, all these in vitro results confirm the efficacy of YCW products as antimicrobial, thus reducing the amount of the pathogens that can adhere on the intestinal wall (Pérez-Sotelo et al., 2005; Ganner et al., 2010; Trevisi et al., 2012) and reveal that they may exert a selective effect against some bacteria while having no adverse effect on beneficial and commensal bacterial population. Recent in vivo reports highlighted the beneficial effects of yeast products in maintaining animal performances and health while minimizing mortality and morbidity when there is a C. perfringens challenge in an antibiotic-free production situation (Van Immerseel et al., 2004; Thanissery et al., 2010; Fowler et al., 2015; M'Sadeq et al., 2015; Hashim et al., 2018).
YCW product composition is very variable, depending on the species and strain from which they originate; so it is not possible to make general considerations on their effect, but it is necessary to test in vitro their efficacy as antimicrobials against pathogenic bacteria (Trevisi et al., 2012; Ganner et al., 2013). So far, yeasts and derivatives are underrepresented in the literature as anti-C. perfringens agents and more research is needed to confirm their effectiveness as antimicrobials versus strict anaerobic pathogens (Santovito et al., 2018). This study aims to evaluate the in vitro efficacy of selected YCW products in inhibiting the growth of C. perfringens and paves the way to understand the mechanism underlying the antimicrobial activity of YCW products toward the pathogen.
Materials and Methods
YCW products
YCW products were provided by Phileo/Lesaffre International. Four of five products contained cell wall fractions derived from Saccharomyces cerevisiae (YCW1–4), whereas one was a mannoprotein (MAN) concentrate. The supplier declared that products were obtained using different production methods.
Mannans content was determined according to Dallies et al. (1998). In brief, samples were wetted with H2SO4 (72%) solution and left at room temperature for 1 h. Sample were then incubated for 3 h in an oven at 128°C and neutralized with NaOH before filtration. Samples and standards were then analyzed for their mannose concentration as described by the authors. β-Glucans content was determined using the Enzymatic Yeast β-Glucans Assay Kit (Megazyme u.c, Wicklow, Ireland). Proteins and nitrogen content were analyzed using the Kjeldahl method, according to EC regulation 152/2009 (EU, 2009).
YCW products were analyzed for microbial contamination by aerobes and anaerobes, according to ISO methods (ISO7937, 2004; ISO4832, 2006; ISO4833-1, 2013).
Bacterial strains and culture conditions
Clostridium perfringens type C strains and isolates are given in Table 1. All strains were grown at 37°C under anaerobic conditions in thioglycollate (TG; Biolife, Italy) broth in an 815PGB series La Petite glove box (PlasLabs Inch), supplied with anaerobic 10% CO2/10% hydrogen/nitrogen gas mixture. In the TG broth we did not observe precipitation of YCW products and YCW:bacteria complexes. Therefore, we used TG broth because it ensured optimal spatial interaction between cells and antimicrobial compounds.
List of Clostridium perfringens Strains and Their Source
The inoculum density was standardized by photometric measurement at 600 nm wavelength using an Ultrospec 3100 Pro Spectrophotometer (Amersham, United Kingdom). The enumeration of C. perfringens was performed by serial 10-fold dilutions in physiological saline and pour-plating on tryptose sulfite cycloserine (TSC) agar (Biolife) according to ISO methods (ISO7937, 2004). Strains were maintained in TG broth supplied with 20% glycerol and stored at −80°C. Each strain was analyzed individually in all the experiments.
Kinetic growth assays
The experiment was designed to assess the inhibitory effect of YCW products on the growth kinetics of C. perfringens ATCC 13124T. Fowler et al. (2015) found that the optimum dose YCW products tested in their study was ∼0.25–0.30 mg/mL. To verify if the same YCW product concentration can have an antimicrobial effect in vitro, test tubes containing 10 mL of sterile TG broth were supplemented with 0–10 mg/mL of each YCW product. Three independent replicates were prepared per YCW product dosage and sampling time. Sampling times were 0, 6.5, 7.5, 9, 10, 13, 17, 20, and 24 h. A mid-exponential phase culture of C. perfringens ATCC 13124T at OD600nm = 0.61 ± 0.14 was used for the inoculum, and duly diluted to have a final concentration of ∼104 colony-forming unit (CFU) per milliliter per test tube. Blanks were prepared for each YCW dosage by adding sterile broth in place of the cell culture. Growth controls were prepared by inoculating the test strain in the absence of YCW products.
Samples were incubated in anaerobic conditions at 37°C ± 1°C up to 24 h. At each time point, tubes were vortexed for 10 s and growth was monitored by measuring the absorbance at 600 nm. The net absorbance readings of each inoculated sample were obtained by subtracting the absorbance of the blank controls at each YCW product dosage from the absorbance of the respective test samples. At each time point, the corresponding log[CFU/mL] count was measured by plate counting on TSC agar. The experiments were performed three times on three different days (n = 9).
The antimicrobial effect of YCW products was further proven on other strains (Table 1), by measuring the CFU per milliliter reduction after 24 h. The results were expressed as the logarithm of the CFU count reduction per milligram of YCW.
Data calculation and curve fitting
The OD600nm values and the Log[CFU/mL] were plotted versus time (h). The Log[CFU/mL] data were analyzed by nonlinear regression analysis using the Baranyi and Roberts (1994) model. The maximum specific growth rate μmax (i.e., the specific growth rate at the exponential phase, h−1), the maximum cell number y
max (Log[CFU/mL]), and the duration of the lag phase λ (h) were calculated using the Excel® macro DMFit, version 3.5 (
Inhibition rate
The inhibition rate (IR) (Li et al., 2016) was calculated using the following equation:
where μC is the specific growth rate at the concentration C of an YCW, and μ0 is that of the control in the absence of YCW products. IR 50 is the concentration of YCW that causes 50% inhibition (i.e., IR = 0.5), and was derived from the inhibitory curves of IR as a function of YCW product concentrations.
Lag time extension
To determine the effect of YCW products on the lag phase duration, we used a parameter termed “lag time extension” (LE) that is defined as follows (Li et al., 2016):
where λC is the duration of the lag phase λ (h) of a microorganism at the concentration C (obtained by DMFit analysis) of an YCW, and λ0 is that of a control without the YCW products. In the scenario where bacterial growth is completely inhibited, λ is regarded as infinite.
Growth reduction
The parameter yR was used to estimate the reduction in the y
max as a function of YCW concentration. The yR parameter was calculated as follows:
where y C is the y max obtained in 24-h incubation, y i is the concentration of the initial inoculums, and y 0 is that of a control without the YCW. yR 50 is the concentration of YCW that causes 50% reduction (i.e., yR = 0.5) and was derived from the curves of yR as a function of YCW concentrations.
Growth reduction induced by YCW products was measured on different C. perfringens strains (Table 1) by plate counting on TSC agar after 24 h of incubation, and in the presence of the yR
50 concentration of each YCW. For each strain, the final CFU/mL count (Sy
max) was referred to the control (Cy
max) and expressed as (Log) CFU count reduction per milligram of each YCW product (Log[CFU/mg]) according to the following formula:
Statistical analysis
The growth parameters were analyzed with all pairwise multiple comparison procedures (Tukey post hoc test), with a 0.05 significance level. Growth parameters were correlated to YCW product concentration using the Pearson correlation test at p < 0.05. The SigmaPlot 12 software (Systat Software, San Jose, CA) was used.
Results
The chemical composition of YCW products as reported by the supplier is given in Table 2. YCW products did not differ substantially in chemical composition. The total viable aerobe count was negligible, being <3 CFU/mg of product (Table 2). Neither anaerobic bacteria nor C. perfringens isolates were found using the protocol indicated in ISO7973:2004. Blank controls that contained YCW products in TG broth did not show any growth in 24 h of incubation at 37°C in anaerobiosis. Therefore, it can be stated that endogenous microbial contamination did not interfere with the growth of the tested strains.
Chemical Composition of Yeast Cell Wall Products and Endogenous Microbial Contamination
Data of YCW product composition are given as percentage on dry matter (% DM). Total viable aerobe count data are given as mean ± standard deviation of three independent experiments.
YCW, yeast cell wall; CFU, colony-forming unit.
TG broth prevented the precipitation of bacterial cells and YCW products, in the overall incubation period of 24 h at 37°C. The TG broth was therefore selected as optimal medium because it ensured a fast growth of C. perfringens and maintained cells and YCW products suspended, thus facilitating their interaction during the experiment.
On the assumption that a linear trend exists in the exponential growth phase (Hall et al., 2014), the absorbance values of the C. perfringens broth cultures (determined in the absence of YCW products and in the exponential phase) were correlated to the respective CFU counts. A linear relationship was found between (OD600nm) these values (R 2 > 0.99) during the exponential phase. An optical density of 1.0 ± 0.05 corresponded to 9.30 ± 0.21 × 10⁷ CFU/mL as obtained by plate counting. Growth curves obtained by plotting the growth data as OD600nm and the relevant Log[CFU/mL] count recorded in the presence and absence of YCW products are given in Figure 1. All Log[CFU/mL] data well fitted to the model of Baranyi and Roberts, with R 2 values >0.97.
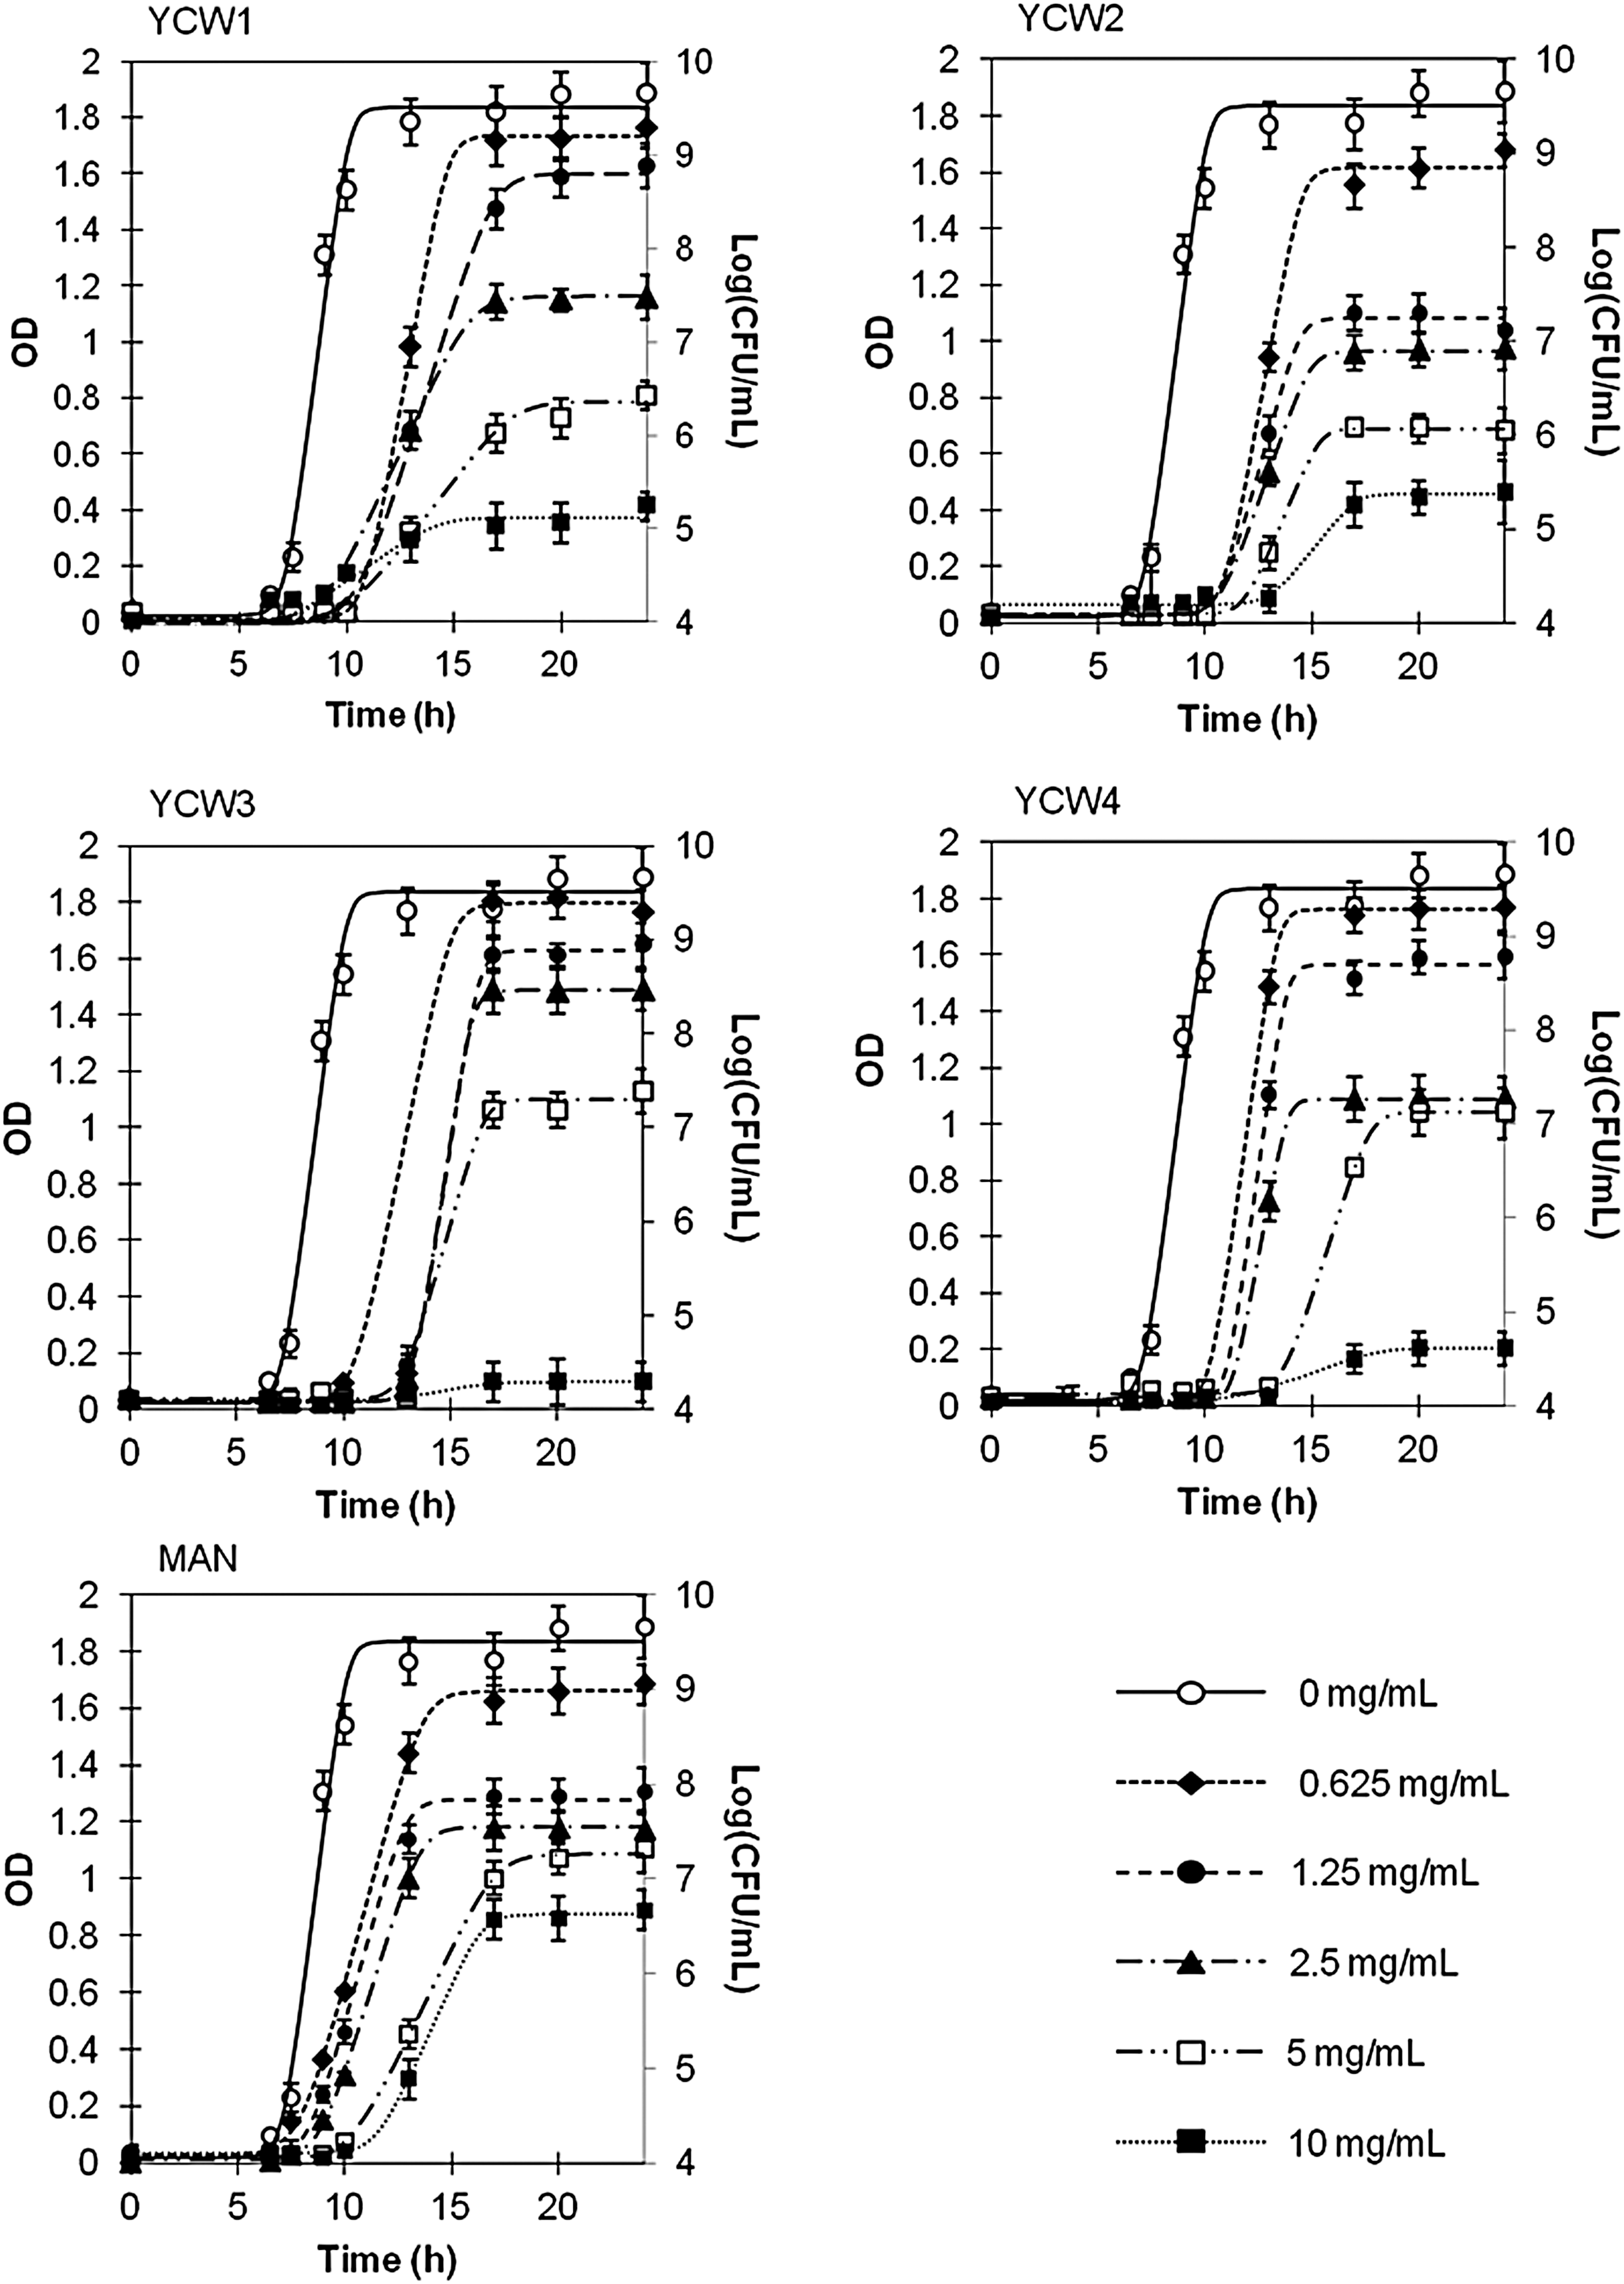
Growth curves of Clostridium perfringens in the presence of different concentrations of each YCW. Growth data are reported as absorbance (OD600nm) and colony count (Log[CFU/mL]). Data are reported as a function of time (h) in the presence and in the absence of YCW1–4 and MAN. Values are given as mean ± standard deviation (n = 9). YCW, yeast cell wall; MAN, mannoprotein; CFU, colony-forming unit.
Examining the growth dynamics of C. perfringens over time, product- and concentration-dependent effects became evident. Although all YCW products affected the growth of C. perfringens, the typical sigmoid curve shape was maintained. The curve fitting by the Baranyi and Roberts model allowed the calculation of the growth parameters y max, λ, and μmax. The analysis of C. perfringens growth kinetics in the presence of different YCW products showed that all the growth parameters were significantly affected (p < 0.05) by the products.
All YCW products reduced the μmax during the exponential phase with increasing dosages of YCW products (p < 0.05) (Fig. 2A). As a consequence of μmax reduction, the IR increased with YCW product concentration in a different manner depending on the product (Fig. 3A). Absence of growth was recorded using 10 mg/mL of YCW3 and YCW4, with IR values at 0.98 ± 0.01 and 0.95 ± 0.01, respectively. Pearson correlation test resulted in a negative correlation between the μmax obtained in the presence of YCW3 and YCW4, and the relative concentrations (r > −0.94, p < 0.001) (Fig. 2A[iii, iv]). No correlation was found between μmax and YCW concentration for YCW1, YCW2, and MAN (p > 0.05), at YCW products concentrations >1 mg/mL. The lowest concentrations of YCW products reducing by ≥50% C. perfringens growth (IR 50) were 0.72 mg/mL for MAN, 1.18 mg/mL for YCW1, 1.31 mg/mL for YCW2, 4.76 mg/mL for YCW3, and 4.32 mg/mL for YCW4. Indeed, <1 mg/mL of MAN is necessary to slow down the growth in the exponential phase by 50%, whereas an amount ∼6 times higher of YCW3 and YCW4 is necessary to obtain the same effect. These data show that YCW3 and YCW4 are less effective than MAN, YCW1, and YCW2 in reducing μmax. The IR values calculated for YCW1 and YCW2 were comparable but higher than MAN.
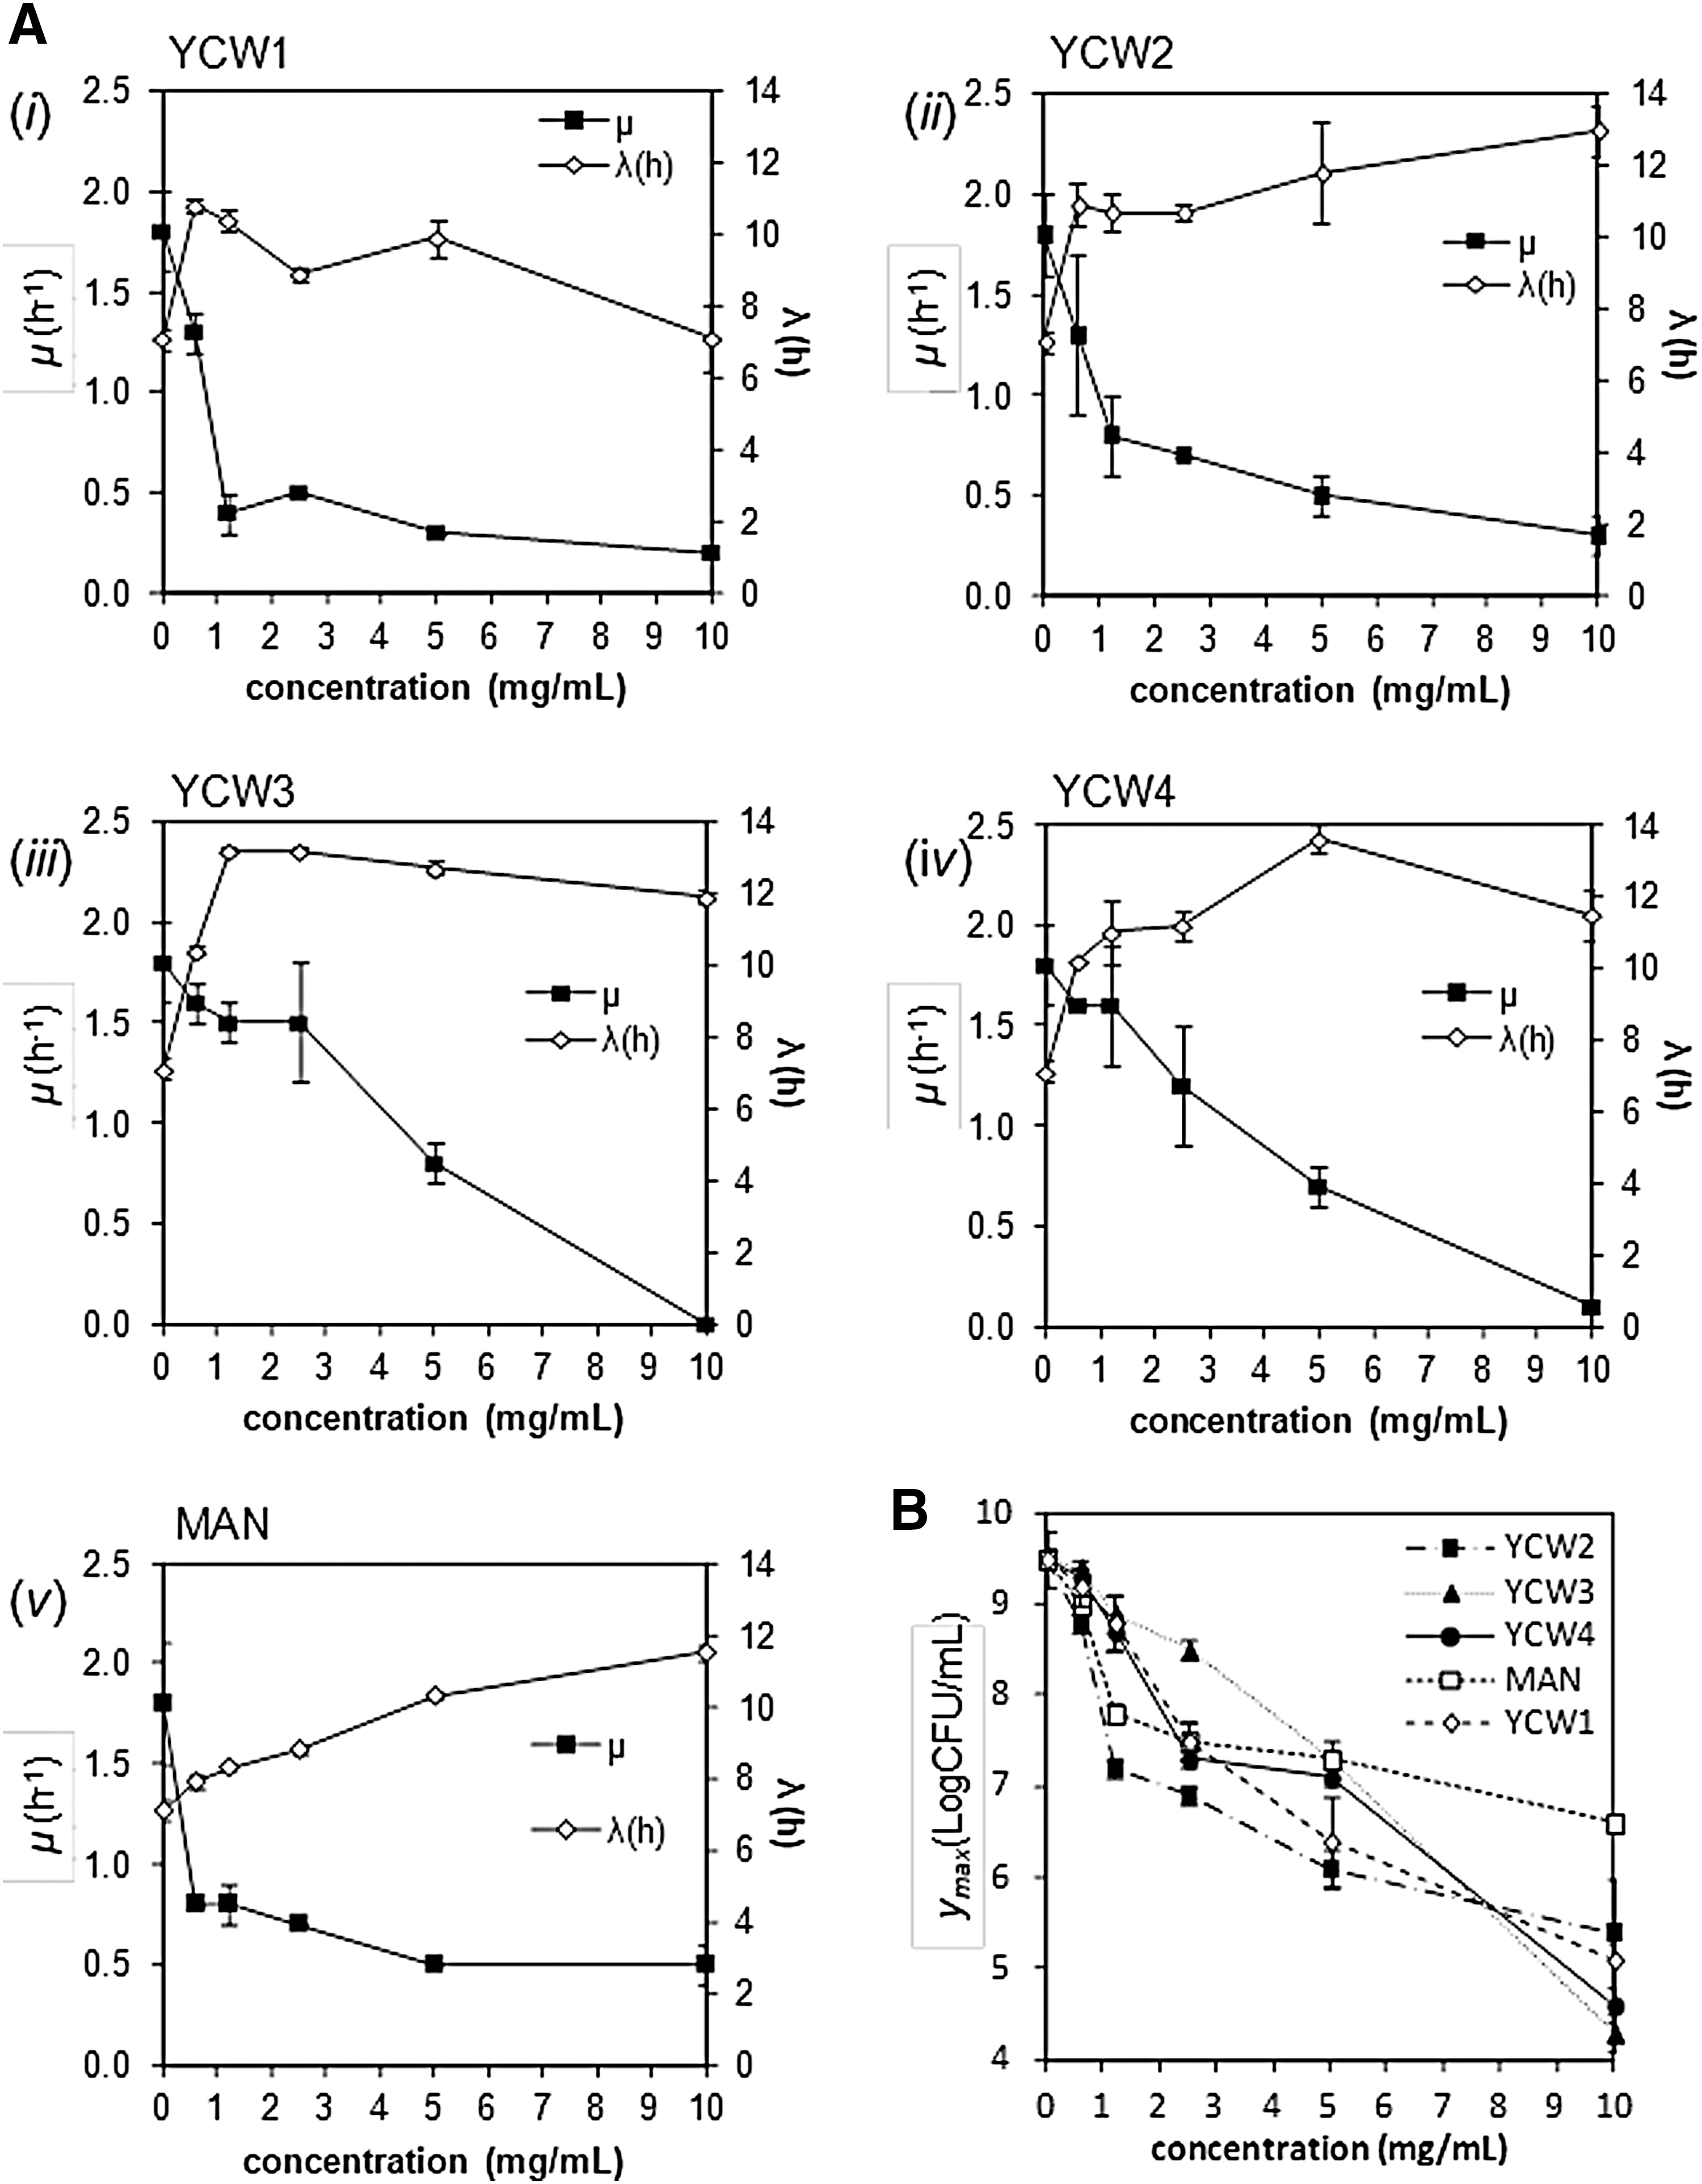
Growth rate (μ), lag phase (λ), and y
max variation. Data obtained for growth rate (μ), lag phase (λ), and y
max variation are reported as a function of YCW product concentration. Values are given as mean ± standard deviation (n = 9).
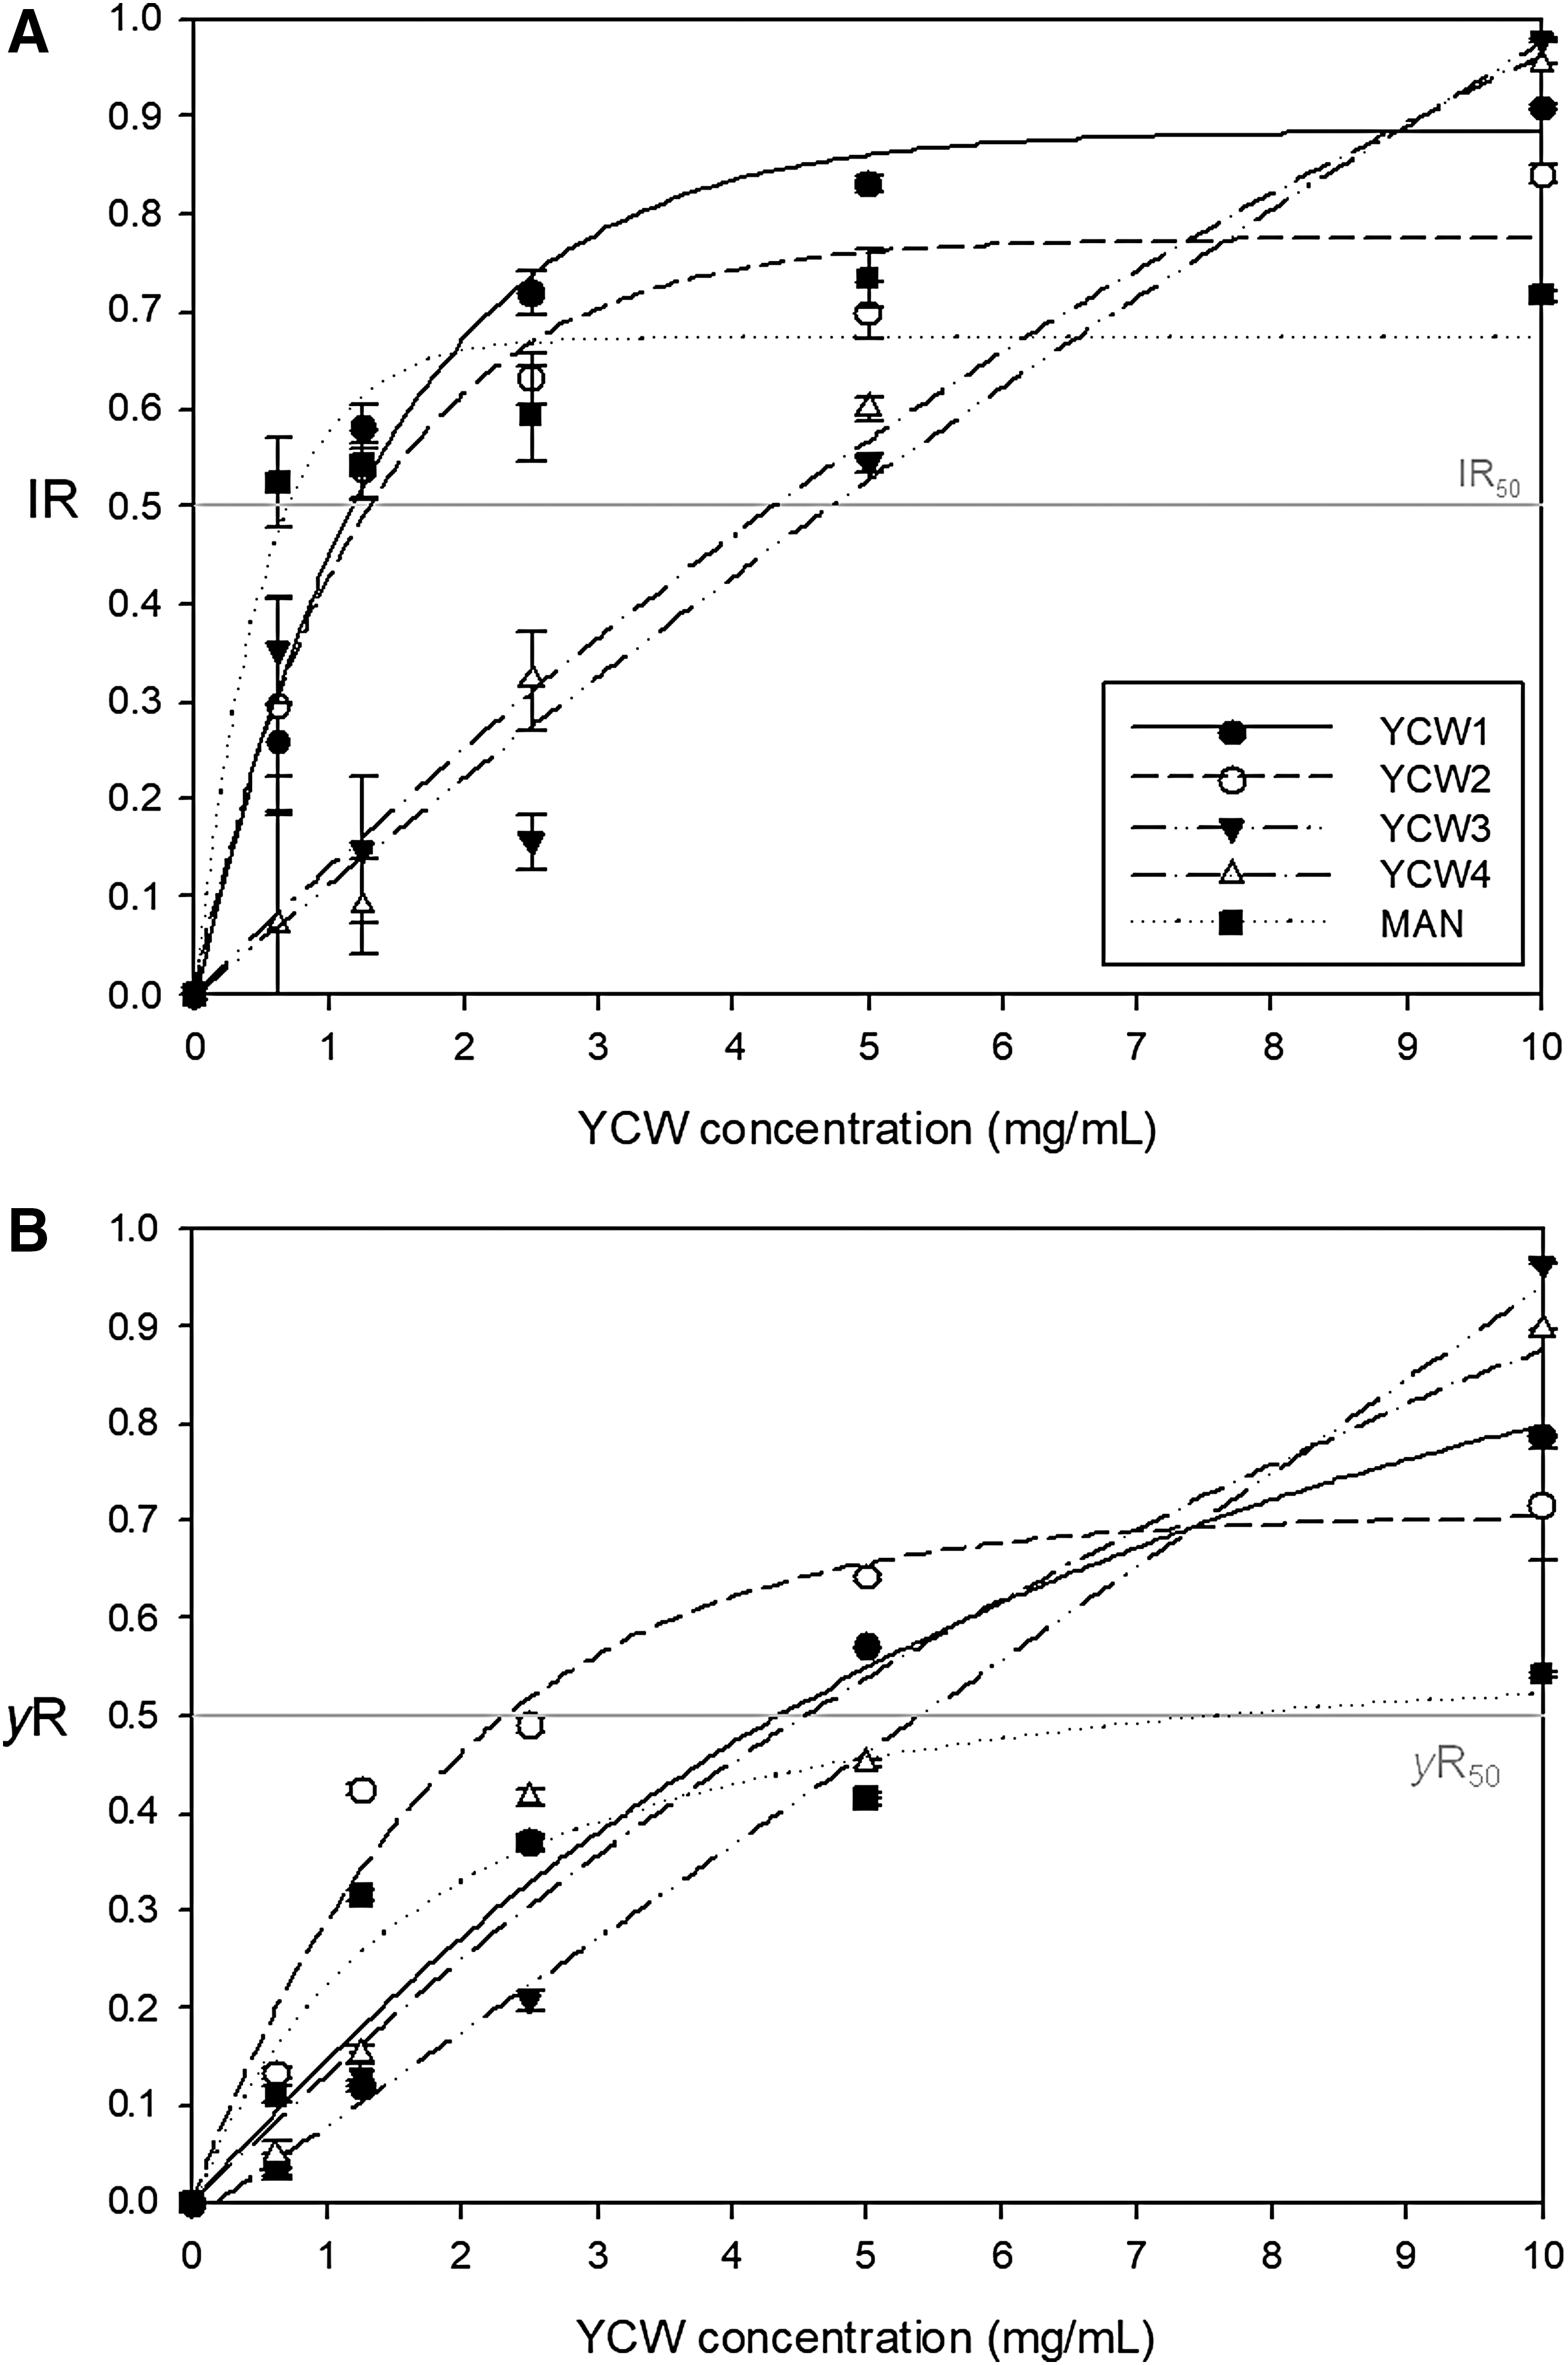
IR and reduction of y
max (γR) variation.
At the concentrations used in this study, all YCW products significantly affected the λ value (p < 0.05) (Fig. 2A). Extended lag phase (up to 13.6 h) was observed in C. perfringens cultures containing YCW products (Fig. 1). The lag phase extension (LE) was in the range 0.0–3.7 h for the YCW1 (Fig. 2A[i]); 3.6–5.9 h for the YCW2 (Fig. 2A[ii]); 3.3–6.1 h for the YCW3 (Fig. 2A[iii]); 3.1–6.5 h for YCW4 (Fig. 2A[iv]); and 0.8–4.4 h for MAN (Fig. 2A[v]). No correlation was found between LE and YCW products dosage (p > 0.05), except for MAN. A positive Pearson correlation coefficient (p < 0.001) and a linear relationship (linear regression with R 2 = 0.962) was found between LE and MAN concentration. To rank the YCW products we determined the minimum YCW concentration that gives at least 3 h increase in λ compared with the control. These concentration values were 0.625 mg/mL for YCW1, YCW2, YCW3, and YCW4 (with LE values of 3.72 ± 0.21 h, 3.76 ± 0.64 h, 3.35 ± 0.15 h, and 3.12 ± 0.04 h, respectively); and 5 mg/mL for MAN (LE = 3.17 ± 0.13 h). The LE/C value was calculated by dividing the LE values by the relevant YCW concentration. The parameter LE/C represents the delay in the lag phase that each product can induce per mg, expressed in h · mL/mg. These values were 5.95 ± 0.33, 6.02 ± 1.03, 5.36 ± 0.24, 4.99 ± 0.07 and 0.63 ± 0.03 h · mL/mg for YCW1, YCW2, YCW3, YCW4, and MAN, respectively. The most efficient products in extending the lag phase duration were YCW1 and YCW2, followed by YCW3, YCW4, with MAN resulting as the less effective.
As given in Figure 2B, all YCW products affected the y max in a dose-dependent manner. A significant negative correlation between y max and YCW product dosages was found (R 2 > 0.936, p < 0.05). Increasing dosages of YCW2 and MAN induced exponential decay of y max values (Fig. 2B). The curve obtained for YCW2 was sharper at the lowest dosages, proving the high efficacy of this product in inhibiting the growth of C. perfringens. Negative linear regression coefficients (R 2 > 0.936) were determined for YCW1, YCW3, and YCW4.
For the selection of the most efficient YCW in reducing the y max, we considered as effective the minimum YCW concentration reducing the y max value by 50% in 24 h. As given in Figure 3B, the yR 50 values were 4.38, 2.35, 5.42, 4.55, and 7.81 mg/mL for YCW1, YCW2, YCW3, YCW4, and MAN, respectively. Table 3 summarizes the results obtained by the analysis of the growth kinetic parameters.
Summary of Yeast Cell Wall Products Effect on Growth Kinetic Parameters
The results obtained by the analysis of the growth parameters μ, λ, and y are given as IR 50, LE/C, and yR 50 values, respectively. Values are mean ± standard deviation (n = 9) and a–eDifferences that are statistically significant according to ANOVA and Tukey post hoc test (p < 0.05).
ANOVA, analysis of variance; YCW, yeast cell wall; MAN, mannoprotein; LE, lag time extension; IR, inhibition rate.
Table 4 shows the values obtained for μmax, λ, and y max from growth curve fitting to the Baranyi and Roberts model, with the correlation between each value and the YCW dosage obtained by Pearson's correlation test and one-way analysis of variance.
Values Obtained for μmax, λ, and y max from Growth Curve Fitting to the Baranyi and Roberts Model
Growth kinetic parameters calculated by curve fitting of experimental data on the Baranyi and Roberts model. Value are given as mean ± standard deviation (n = 9). Results of Pearson's correlation test between the variation of a growth parameter and YCW concentration are reported as r: Pearson's correlation coefficient, and p: p-value. Different letters in superscript represent values that are statistically different according to ANOVA and post hoc Tukey test.
C, YCW concentration; ANOVA, analysis of variance; YCW, yeast cell wall; MAN, mannoprotein; CFU, colony-forming unit.
To confirm the YCW products' inhibitory activity on C. perfringens, all products were tested toward four strains with different origin, at the dosages determined as above. As given in Figure 4, YCW2 confirmed its high efficacy in inhibiting the growth of C. perfringens. One milligram of this product reduced by ∼2 Logs the final CFU count for Ad 1600, CP 56, and Ad 211b. The effect of YCW1 on bacterial growth was lower, being 1 Log CFU/mL count reduction per 1 mg/mL of product. The YCW4, YCW3, and MAN were found as the less effective. Of interest, YCW products did not show a strain-dependent impact on growth inhibition.
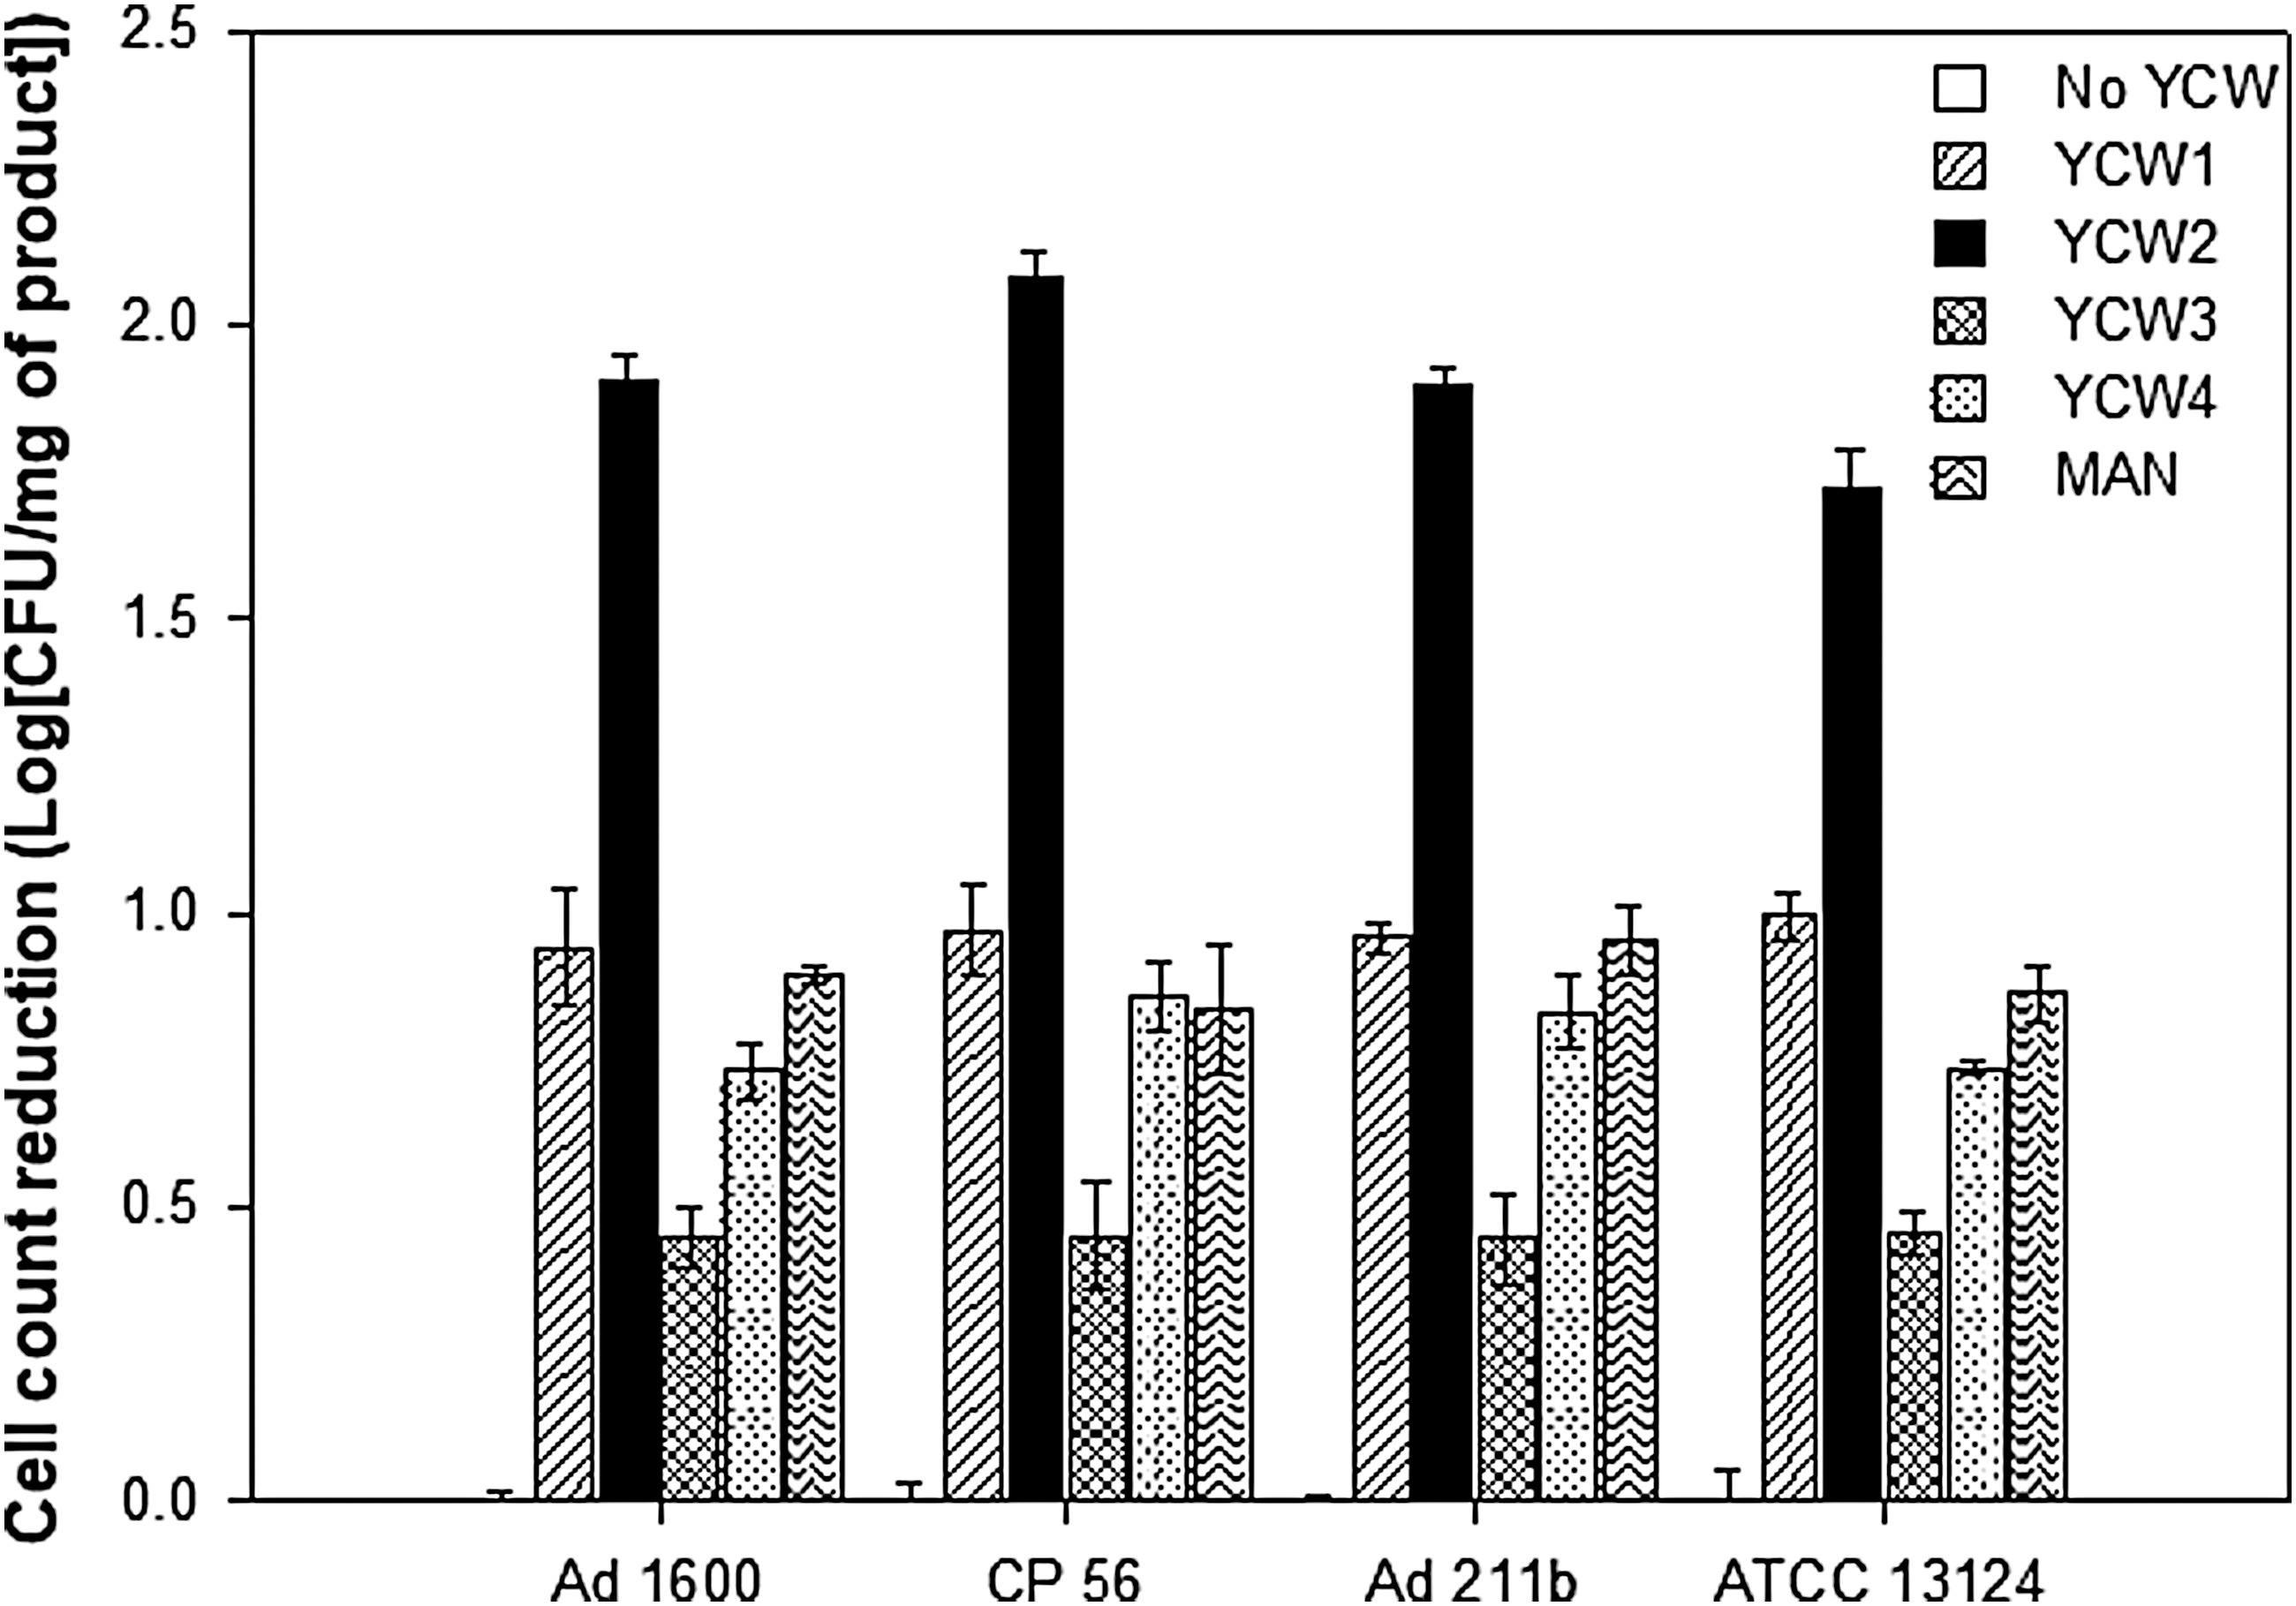
Growth reduction of different C. perfringens strains induced by YCW products. Data represent the viable count of different C. perfringens strains measured by plate counting on tryptose sulfite cycloserine agar after 24 h of incubation, and in the presence of the minimum effective concentration of each YCW. For each strain, the y max value was referred to the control and expressed as (Log) CFU count reduction per mg of each product (Log CFU/mg). Data points are given as mean ± standard deviation in three independent experiments (n = 9).
Discussion
The success of YCW products as AGPs is the result of the ability of their significant components—for example, mannan-oligosaccharides and β-glucans—to prevent colonization by bacterial pathogens in the intestinal tract. YCW products have been proven to reduce the viability of specific bacterial pathogens and to increase the number of beneficial bacteria, with the consequent improvement of animal's performance and immunity (Kogan et al., 2007; Reisinger et al., 2012; Morales-Lopez and Brufan, 2013). The heterogeneous nature and diversity of YCW products make it difficult to define in vitro assays that can be used to study the activity of these natural antimicrobial candidates. As a consequence, the central point to elucidate the efficacy and the mode of action of YCW products in preventing gut infections is the availability of accurate in vitro methods for studying the antimicrobial efficacy of YCW products on C. perfringens. The currently available test used for in vitro screening of YCW products is based on sedimentation and agglutination of the bacteria:yeast complexes, and by light and electron microscopy to visualize the binding of the bacteria (including C. perfringens) to YCW products (Pérez-Sotelo et al., 2005; Ganan et al., 2012; Posadas et al., 2017). Although providing the visualization of the interaction between YCW products and bacterial cells, this method did not allow the quantification of the extent of the inhibitory effect on the growth of target pathogens. In addition, the agar well/disc diffusion assays cannot be used with this kind of products, given the complex, tridimensional interaction of YCW products with the target bacteria in liquid medium.
Using the in vitro approach herein proposed, we studied the antimicrobial effect of YCW products on C. perfringens, by analyzing the effect of YCW products on the growth dynamics of the pathogen. This study provides evidence on the inhibitory effect exerted by YCW products on C. perfringens, by direct counting of the residual Log[CFU/mL], and proposes a method that can be used to measure the direct effect of YCW products on the viability of the bacterium, granting the optimal growth conditions for the pathogen. In this study we demonstrated that the OD600nm was directly correlated to the Log[CFU/mL] count and that OD600nm reduction in TG broth can be taken as an indicator for interaction and thus for antimicrobial effectiveness.
All YCW products assayed herein inhibited the growth of the pathogen by reducing the growth rate and the maximum growth value, and by extending the duration of the lag phase. The effect of YCW products on growth parameters was product and dosage dependent. LE was not affected by YCW concentration, unlike MAN. This may be because of the lower MAN content in YCW1–4 than in MAN (concentrate), although no evidences of the direct implication of MAN on the LE were found. YCW products did not show a strain-dependent impact on C. perfringens growth. One product of five YCW products, namely YCW2, was selected as the most promising candidate for C. perfringens growth inhibition. Results on the effect of YCW products composition on the antimicrobial activity are not significant in this study; therefore further analysis is needed to identify components that mainly contribute to the antimicrobial activity of YCW products.
To the best of our knowledge, this is the first in vitro study on the effect of YCW products on the growth kinetics of C. perfringens. Previous studies in vivo by Fowler et al. (2015) reported that the optimum dose for the YCW products tested in their study was ∼0.25–0.30 mg/mL, when these products were supplemented in starter broilers under an immune stress and C. perfringens challenge. Although the scenario is different, as in vitro studies do not reflect the conditions in vivo, it can be stated that the method proposed in this study can be useful to select the YCW product candidates to be used for in vivo studies.
Further studies are needed to elucidate the mechanisms underlying the growth inhibition effect exerted by YCW products on C. perfringens and on other anaerobic pathogens, which require specific set up of the growing conditions.
Footnotes
Acknowledgments
The authors thank Prof. Filip Van Immerseel (U-Ghent, Belgium) and ADRIA Développement (Quimper, France) for providing the strains used in this study.
Disclosure Statement
No competing financial interests exist.