
Abstract
Bacterial spores are generally more resistant than vegetative bacteria to ultraviolet (UV) inactivation. The UV sensitivity of these spores must be known for implementing UV disinfection of low acid liquid foods. UV inactivation kinetics of bacterial spores in coconut water (CW) and distilled sterile water was studied. Populations of Bacillus cereus and Clostridium sporogenes dormant spores were reduced by more than 5.5 log10 at the UV-C photon fluence of 1142 μE·m−2 and 1919 μE·m−2 respectively. C. sporogenes spores showed higher UV-C resistance than B. cereus, with the photon fluence 300 μE·m−2 required for one log inactivation (D10) and 194 μE·m−2, respectively. No significant difference was observed in D10 values of spores suspended in the two fluid types (p > 0.05). The inactivation kinetics of microorganisms were described by log linear models with low root mean square error and high coefficient of determination (R 2 > 0.98). This study clearly demonstrated that high levels of inactivation of bacterial spores can be achieved in CW. The baseline data generated from this study will be used to conduct spore inactivation studies in continuous flow UV systems. Further proliferation of the technology will include conducting extensive pilot studies.
Introduction
Inactivation of bacterial endospores is a major concern in food industry especially for the processing of low acid (pH >4.6) beverages. It is well known that low acid conditions are suitable for germination and growth of pathogenic bacteria spores (e.g., Clostridium botulinum spores) can lead to severe foodborne diseases. C. botulinum is a group of four physiologically and phylogenetically distinct clostridia that share the common feature of producing the extremely potent botulinum neurotoxin (Lund and Peck, 2000), which is a major concern in low acid beverages. Bacillus cereus is an aerobic spore forming bacteria. Vegetative cells produce a toxin, cereulide (>0.01 mg·g−1) can cause severe sickness (Granum and Lund, 1997). Ingested vegetative cells multiply in the intestine and produce diarrheal enterotoxins, known as Hbl, Nhe, and CytK (Lindbäck and Granum, 2006).
Control measures for low acid beverages are critical, and are likely to involve multiple measures, for example, a combination of a process steps to destroy the nonproteolytic spores and “Keep Refrigerated” labeling if the juice does not receive a treatment sufficient to destroy the proteolytic spores (21 CFR Parts 113 and 114). Additionally, guidance from the FDA is now strictly recommending that processors subject to the pathogen reduction provisions of the juice Huzard Analysis and Critical Control Points (HACCP) regulation (USFDA, 2004) incorporate validated control measures for all B. cereus and C. botulinum spores into their HACCP plans (USFDA, 2007), to control their growth and toxin production. Current sterilization approaches for spore inactivation require high temperatures (>5 min at 121°C). These high temperatures may induce significant product damage, hence alternative nonthermal methods including ultraviolet (UV) treatment have increasingly been considered over the last few years.
UV-C technology is a promising approach as it can effectively inactivate bacterial endospores (Hijnen et al., 2006). In addition, due to its less energy requirement, it is a low-cost process when compared to other pasteurization methods (Guerrero-Beltrán and Barbosa-Cánovas, 2004; Crook et al., 2015). For instance, Torkamani and Niakousari (2011) reported the energy required for thermal pasteurization (81 KWh·m−3) is ∼40 times higher than UV pasteurization (2 KWh·m−3). UV systems for treating juices have recently begun to be commercialized. FDA approval in 2000 (USFDA, 2000) of UV radiation of fruit juices has been approved by FDA in 2000 to reduce human pathogens (21 CFR 179.39). To maintain quality and implement FDA guidance for low acid beverages as mentioned above, low acid beverage producers can control C. botulinum by using UV-C light.
UV-C irradiation of spores at germicidal wavelength (254 nm) generates spore photoproduct (SP; thymidyl-thymidine adduct) as a major photoproduct, rather than cyclobutane dimers and 6-4-photoproducts formed in vegetative cells (Moeller et al., 2007; Setlow, 2006, 2014). Bacterial endospores show stronger UV-resistance than vegetative cells (Setlow, 2014). Since FDA approved the use of UV-C as a novel technology for pasteurization of fruit juices (USFDA, 2000), this technology has been mainly focused on the treatment of acidic liquid foods and beverages (Koutchma, 2009; Oteiza, et al., 2010), whereas treatment of low acid beverages requires inactivation of pathogenic bacterial endospores (21 CFR Parts 113 or 114). However, few reports are available on UV-C inactivation of bacterial endospores.
There is a considerable variability in the reported UV-sensitivity of spores (D10- 10% survival in microbial population), which leads to uncertainty in sizing UV equipments for industrial applications (Blatchley et al., 2005; Clauß, 2006). Despite the relatively significant number of publications on UV treatment of liquid foods, the information is inconsistent, and the outcomes are strongly affected by incorrect optical and bioassay techniques. For instance D10 values between UV fluence of 8.75 and 52 mJ·cm−2 (equivalent to photon fluence of 186 and 1103 μE·m−2) have been reported for B. cereus in aqueous solutions (Blatchley et al., 2005; Clauß, 2006) using a collimated beam (CB) device. Adding to these concerns, most of these studies used crude spore preparations that were not physiologically synchronized. The physiological stage of spores can significantly influence the inactivation results. Like vegetative bacteria, germinated spores are more susceptible to UV-C light than dormant spores (Setlow, 2014), and their presence in test fluid could lead to inconsistent inactivation kinetics and may contribute to variable inactivation features such as shoulders and tailing. The current study will generate fundamental knowledge on the inactivation of bacterial spores using standardized approaches of dose/fluence estimation (Bolton et al., 2003). Most of the UV irradiation studies used energy-based units, such as mJ·m−2 for quantitative analysis of fluence. According to Second Law of Photochemistry, all photochemical events must be independent and the rate of such events must be proportional to the rate of photon absorption. Hence, Bolton et al. (2015) proposed to use photon fluence unit, which refers total number of moles of photons (einsteins) incident from all directions on a small sphere over time divided by the cross-sectional area of the sphere.
The main objective of this study was to develop standardized UV photon fluence response curves for purified dormant endospores of B. cereus and Clostridium sporogenes (surrogate species to C. botulinum) suspended in sterile deionized water and in coconut water (CW). CW [pH range of 4.2–6.0 (Walter et al., 2009)] was chosen as a food model since it contains all nutrients required for bacterial and bacterial spore growth (Prades et al., 2012).
Materials and Methods
Bacterial strains propagation and endospores production
Bacterial strains B. cereus ATCC 14579 and C. sporogenes ATCC 19404 were obtained from the American Type Culture Collection (ATCC). B. cereus ATCC 14579 was cultured in Bacto Brain Heart Infusion broth (Beckton Dickinson, Franklin Lakes, NJ) at 37°C with aeration at 180 rpm. A nutrient-rich, chemically defined sporulation medium (mineral salts medium [MSM]) described previously (Garcia et al., 2010) was used to obtain spores. Sporulation and spore handling were performed as follows: 20 mL of an overnight-grown culture was used to inoculate 200 mL of MSM media in 1 L flasks and incubated at optimum sporulation temperature of 30°C with aeration at 180 rpm for 3 d. C. sporogenes ATCC 19404 was cultured in Reinforced clostridial medium (RCM) and incubated at 37°C and 180 rpm agitation for 24 h under anaerobic conditions (2.5 L anaerobic jars using AnaeroGEN™ sachets; Oxoid, Basingstoke, United Kingdom). Endospore production was conducted by plating 24 h anaerobically grown cultures on RCM agar plates and incubating at 37°C for 10 d under anaerobic conditions.
Isolation and purification of dormant endospores
For isolation and purification of the B. cereus spores formed in sporulation medium, sporulated cultures were harvested and washed three times with sterile deionized water by centrifugation at 4000 × g, 4°C for 10 min. In case of C. sporogenes, spores from the RCM agar plates were harvested by pouring 5 mL of sterile water (SW) onto each plate followed by rubbing the surface with glass rod and the suspension washed three times with sterile deionized water by centrifugation. For both types of spores, the dormant spores were further purified by using Nycodenz (VWR, Atlanta, GA) density gradient centrifugation (Ghosh and Setlow, 2009). Dormant spore pellets were removed, washed with cold water to remove Nycodenz, resuspended, and stored in sterile deionized water. Spore titer was analyzed by heat activation followed by plating and incubation method. Phase contrast microscopic analysis (Hashimoto et al., 1969) of isolated spores revealed >99% of phase bright dormant spores.
Enumeration of viable spores was determined by plating. Briefly, the spore suspensions were heat-activated by incubation at 65°C (B. cereus) or 70°C (C. sporogenes) for 20 or 15 min, respectively and then cooled for 15 min on ice (Ghosh and Setlow, 2009; Wang et al., 2017). Then, the viability of B. cereus and C. sporogenes spores were determined by plating on nutrient agar and RCM agar plates. Aliquots of spores were serially diluted in peptone water to obtain count of 100 to 106, triplicate 100 μL aliquots of various dilutions were applied to plates. Then, the plates were incubated aerobically (B. cereus) and anaerobically (C. sporogenes) at 37°C for 2 d, and colonies were counted. Plate counts within the range of 25–250 were considered for analysis and reported as colony-forming units (CFU) mL−1, correcting for dilution.
Preparation of CW and SW
Fresh raw green coconuts (n = 15) were procured from a local grocery market (Nashville, TN). The coconut shell was pierced from the top, and clear water was pipetted out. Raw CW from each coconut fruit was then filtered using Whatman filter paper with a mesh size of 20–25 μm (Fisher Scientific, Pittsburgh, PA) and the sterility was validated. Particle size of the filtered CW was measured by Zetasizer (model: Zetasizer nano ZS90) supplied by Malvern Instruments, Worcestershire, United Kingdom. Particle size distribution of the CW was observed to be in the range of 300 to 600 nm. Turbidity expressed as absorbance reading at 600 nm was observed as 0.031. Absorption coefficient and pH of CW were measured and are summarized in Table 1. SW used in this study was prepared by sterilization of water using the autoclave.
Optical, Physical Properties, Dose Delivery, and Energy Consumption of Test Fluids
FDA recommended log10 reduction values of low acid canned foods for spores of B. cereus is 6 and Clostridium botulinum is 12.
Absorbance values in parenthesis denotes CW alone (without spores).
Due to higher spore concentration (Fig. 4), transmittance of C. sporogenes in sterile water was observed to be lower than CW.
ATCC, American Type Culture Collection; CW, coconut water; SW, sterile water.
Spore suspensions preparation and UV-C treatment
Bacterial endospore suspensions at a concentration of >107 CFU·mL−1 were prepared in test fluids: sterile deionized water and CW. Optical absorbance at 254 nm was determined using a UV-Visible Spectrophotometer (Genesys 10S; Thermo scientific, Milwakee, WI). UV-C irradiation treatments were conducted using a bench top CB System (Trojan Technologies, London, Canada) (Gunter-ward et al., 2018) (Fig. 1). Briefly, small sample volume (5 mL in a 10 mL beaker) was exposed to UV light while stirring continuously using a magnetic stir plate. Variable photon fluence was achieved by varying the exposure times. During treatment, the temperature of the test fluid was maintained at 2°C to 4°C via ice-cold water bath and samples were stored at 4°C after treatment. The irradiance at the sample location was measured using an International Light Technologies (Peabody, MA) IL-1700 radiometer with an SED 240 detector and a NS254 filter. The UV-C photon fluence delivered to the test fluid suspensions are calculated using a standardized approach (Bolton and Linden, 2003; Bolton et al., 2015).
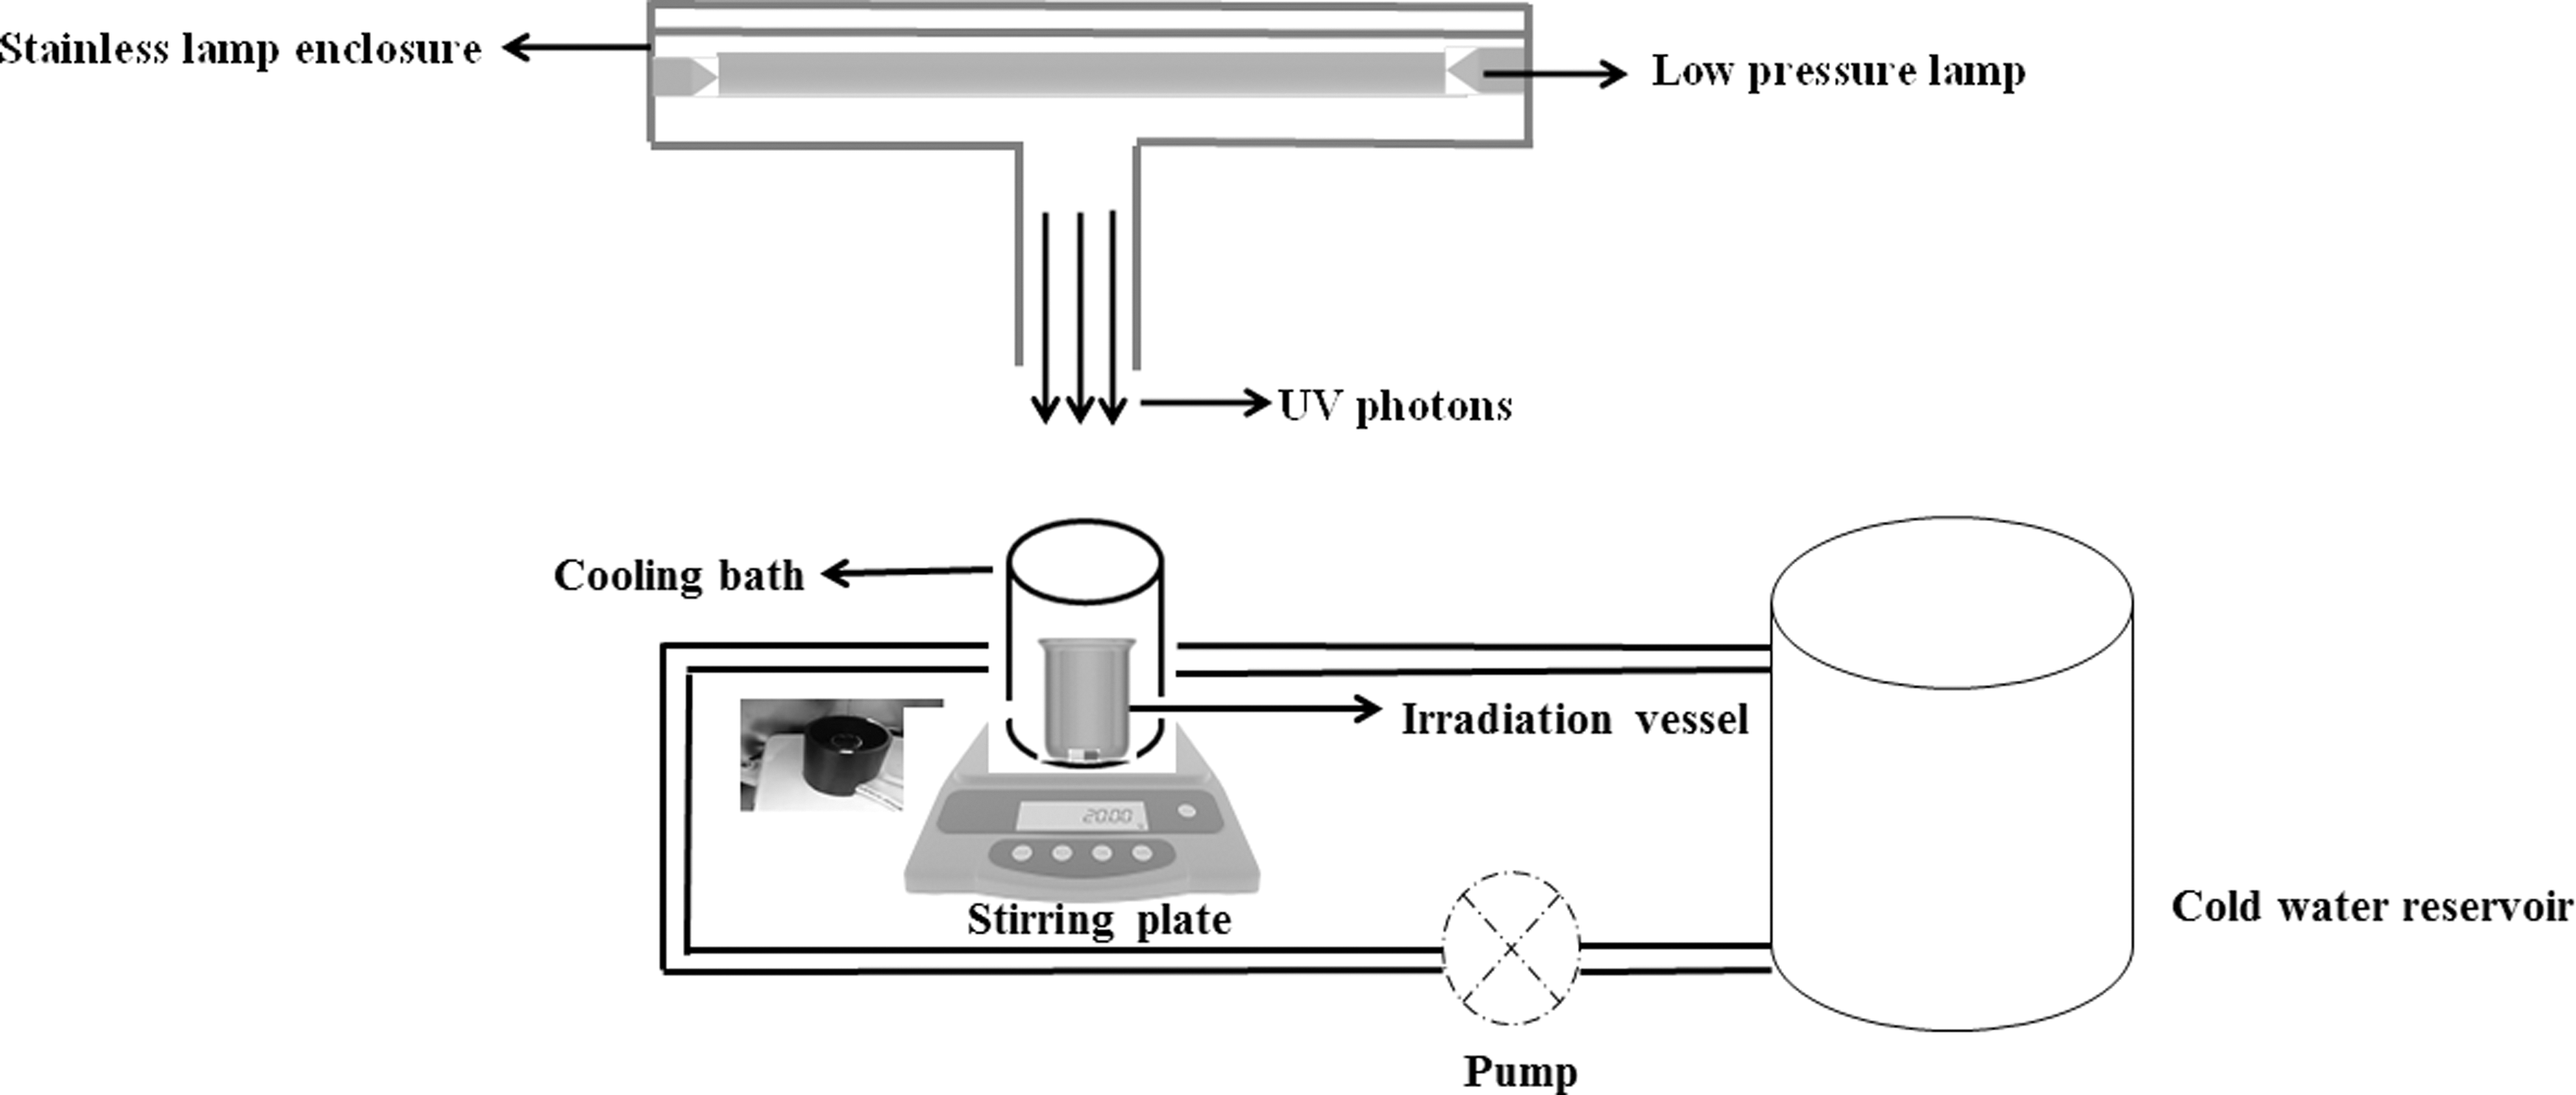
Schematic view of bench scale collimated beam UV-C system. UV, ultraviolet.
To validate the photon fluence delivered under the operating low transmittance conditions, biodosimety testing was conducted using a challenge organism MS2 bacteriophage (Pirnie et al., 2006), as per the method described (Islam et al., 2016). The delivered reduction equivalent photon fluence was linearly correlated with the target UV photon fluence (R 2 = 1, slope = 1.08). Based on this relationship, UV irradiations for the experiment were determined (Fig. 2).
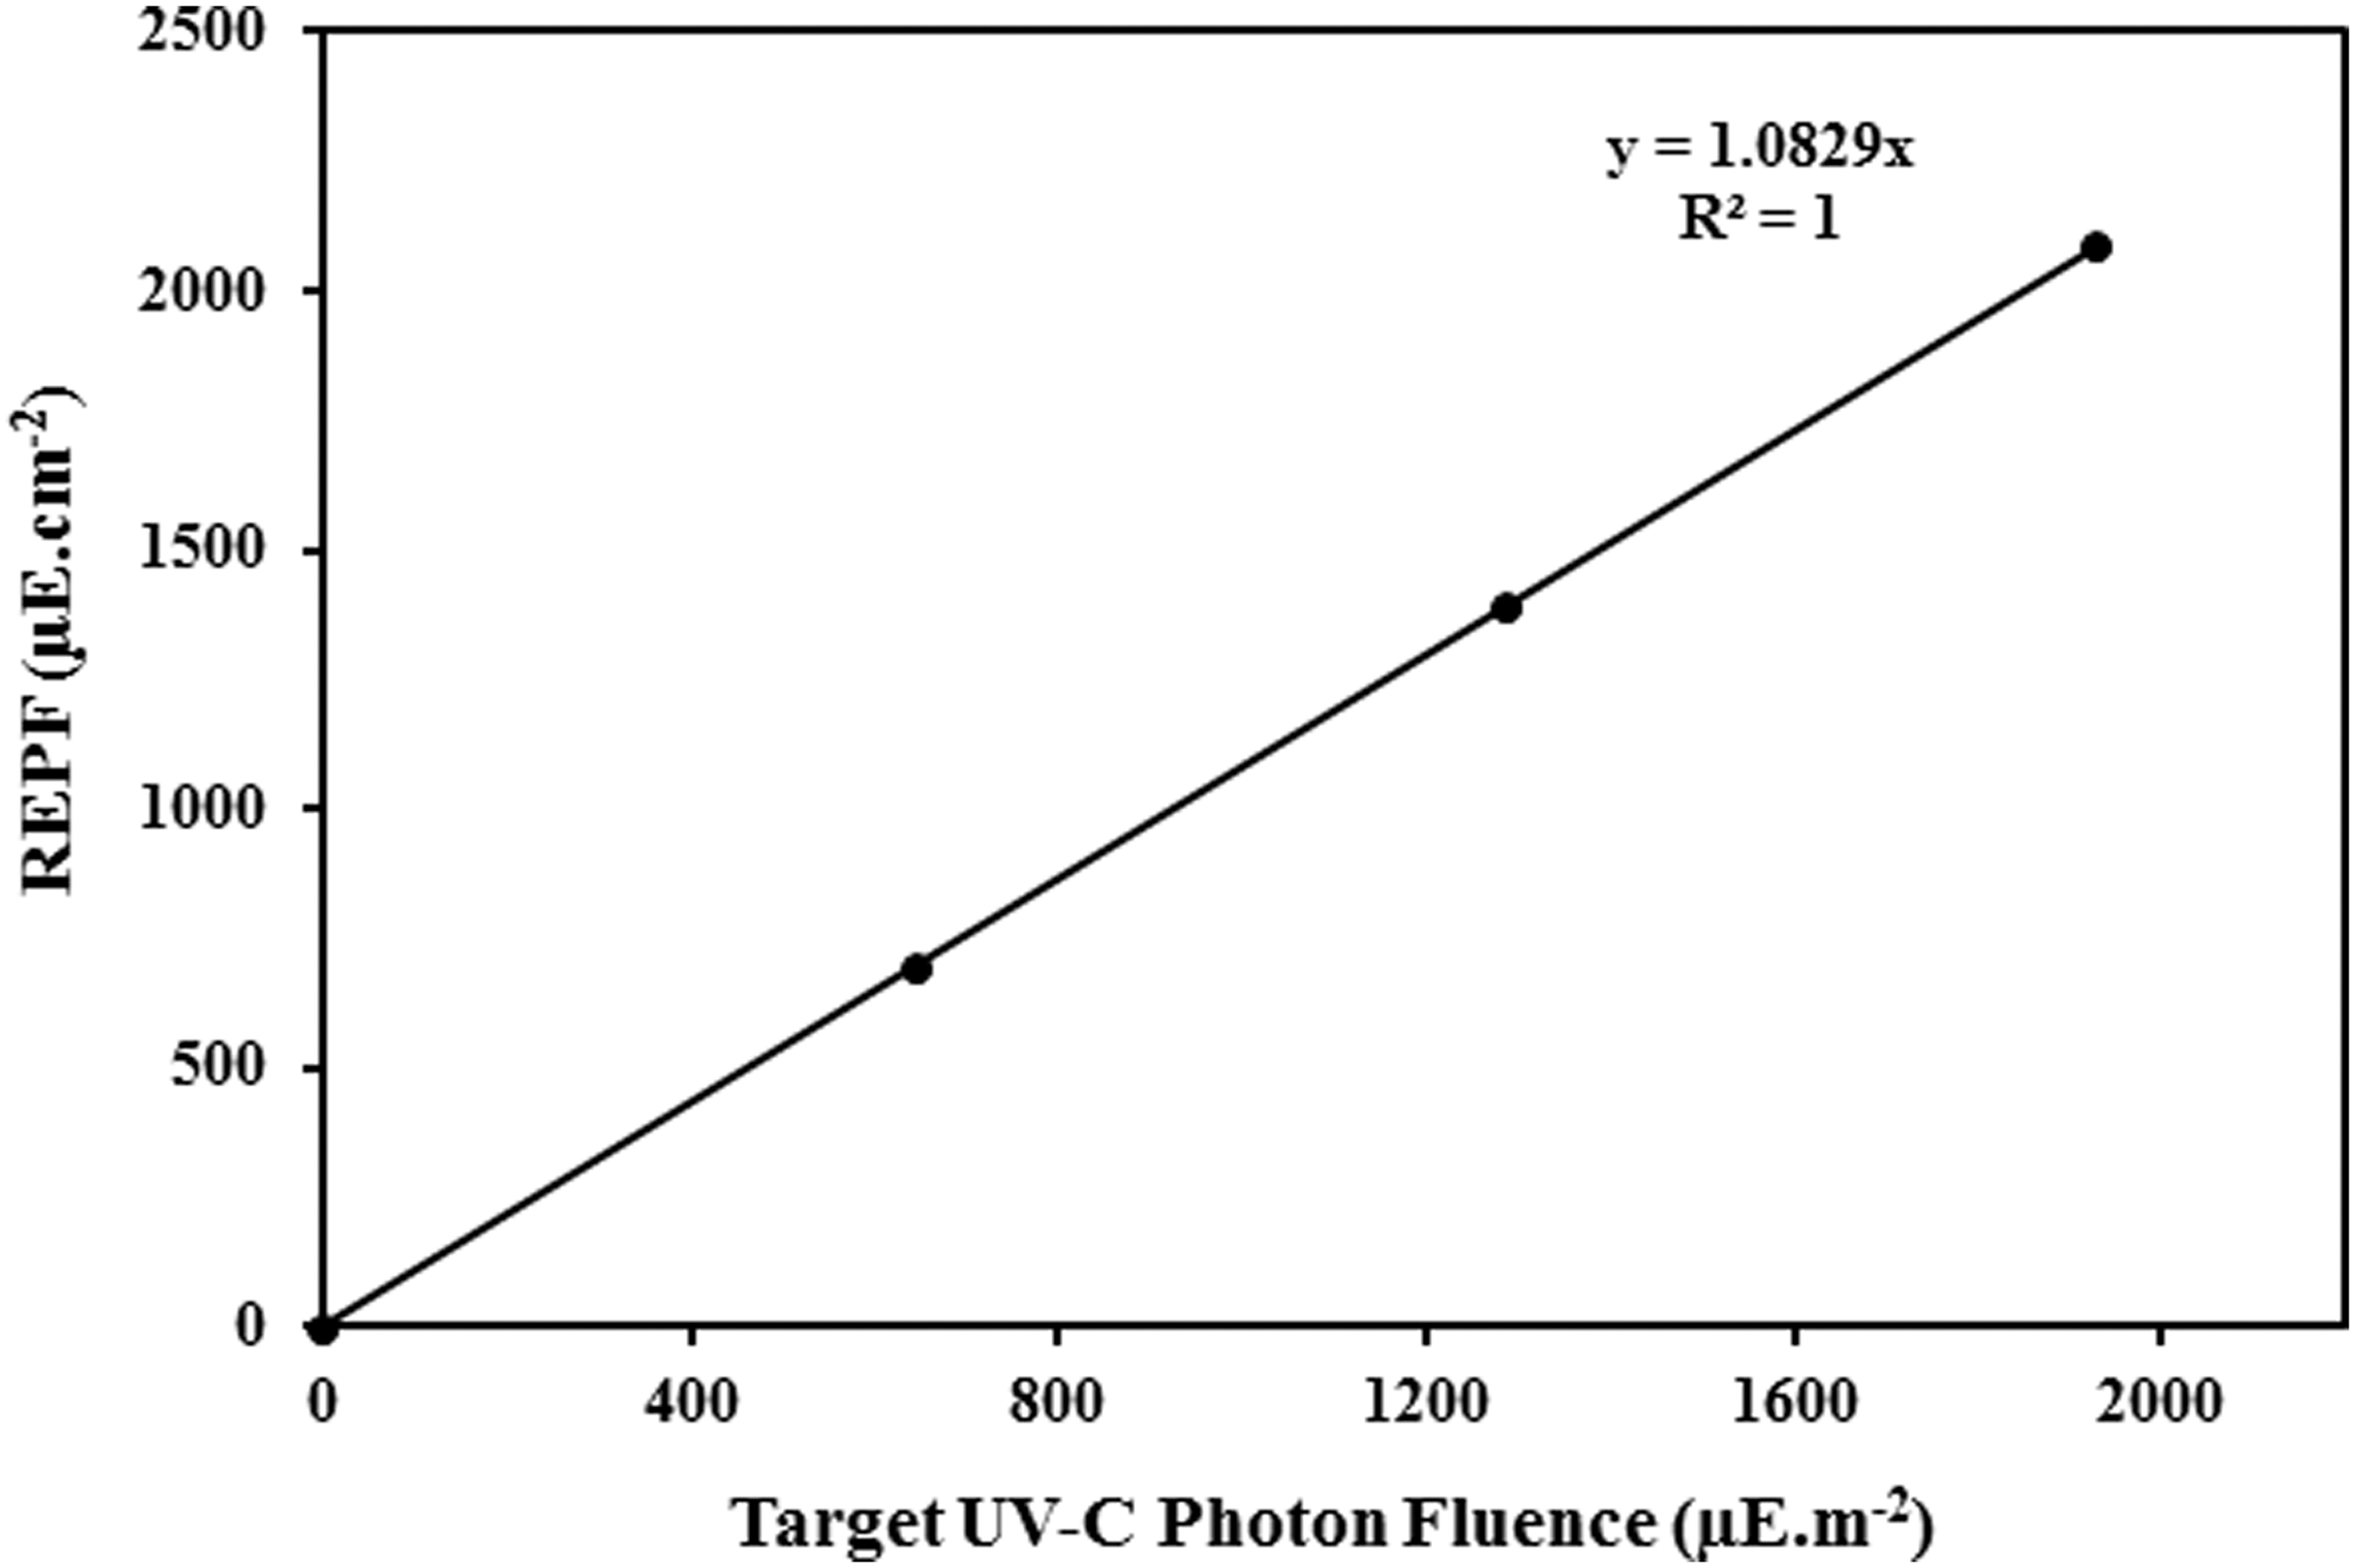
Validation of photon fluence delivery using MS2 bacteriophage. Target UV-C photon fluence versus REPF. REPF, reduction equivalent photon fluence.
Organism UV sensitivity
To determine the UV-C sensitivity, UV-C irradiations were performed in SW spore suspensions. Since SW has no UV-C absorbance, this approach minimizes the intensity gradient, reducing the uncertainty in the delivered photon fluence. All experimental UV-C treatments were performed in triplicate. The D10 value was calculated by the LINEST function in Microsoft Excel with UV-C photon fluence as y-values and log reduction [Log10 (N0-N)] as x-values. The viability of irradiated B. cereus and C. sporogenes spores were determined by the plating and incubation method mentioned earlier. To get sufficient colonies to count, high photon fluence treated samples were concentrated to 10 × (10−1) via centrifugation (2 mL of sample centrifuged at high speed 10,000 rpm, discarded 1.8 mL of supernatant) and applied 0.2 mL to plates.
Curve fitting
To describe the survival of B. cereus and C. sporogenes inactivation, log-linear model available in the GInaFiT tool (a freeware add-in for Microsoft Excel) (Geeraerd et al., 2005) was used to fit the experimental data, and goodness of fit parameters including R
2, root mean square error, and rate constants were evaluated. Inactivation kinetics was expressed as follows:
where N is the cell (CFU) after a treatment of UV-C fluence
For identification purposes the expression (1) was reformulated as follows:
Statistical analysis
For each UV treatment, three samples were tested for replication. To assess the differences between D10 values of SW and CW spore suspensions, one-way analysis of variance (ANOVA) with post-hoc Tukey's HSD tests were performed (using SAS statistical computing environment SAS, 2016).
Results and discussion
UV-C inactivation curves of spores in SW and CW
B. cereus
Table 1 shows the optical and physical properties of the test fluids. The UV transmittance (UVT) of the test fluids ranged from 0.0014–0.065%·cm−1 at 254 nm wave length. It is apparent that UV light has very little transmission through CW due to the presence of colored compounds, organic solutes, or suspended matter. SW was more transparent to UV light than CW, and hence will have lesser UV gradients.
Figure 3 depicts the inactivation curves of B. cereus spores in SW and CW. Exposure to UV light at a maximum photon fluence of 1142 μE·m−2 resulted in 5.9 log reduction in SW and 5.5 log reduction of CW. When spores are exposed to germicidal UV-C radiation (200–280 nm), DNA absorbs the energy in photons and induces covalent linkages between adjacent bases and thereby forms bipyrimidine dimers—majorly SP (Setlow, 2006). These severe DNA structural distortions affect the vital cellular processes such as DNA transcription and replication, leading to cell death.
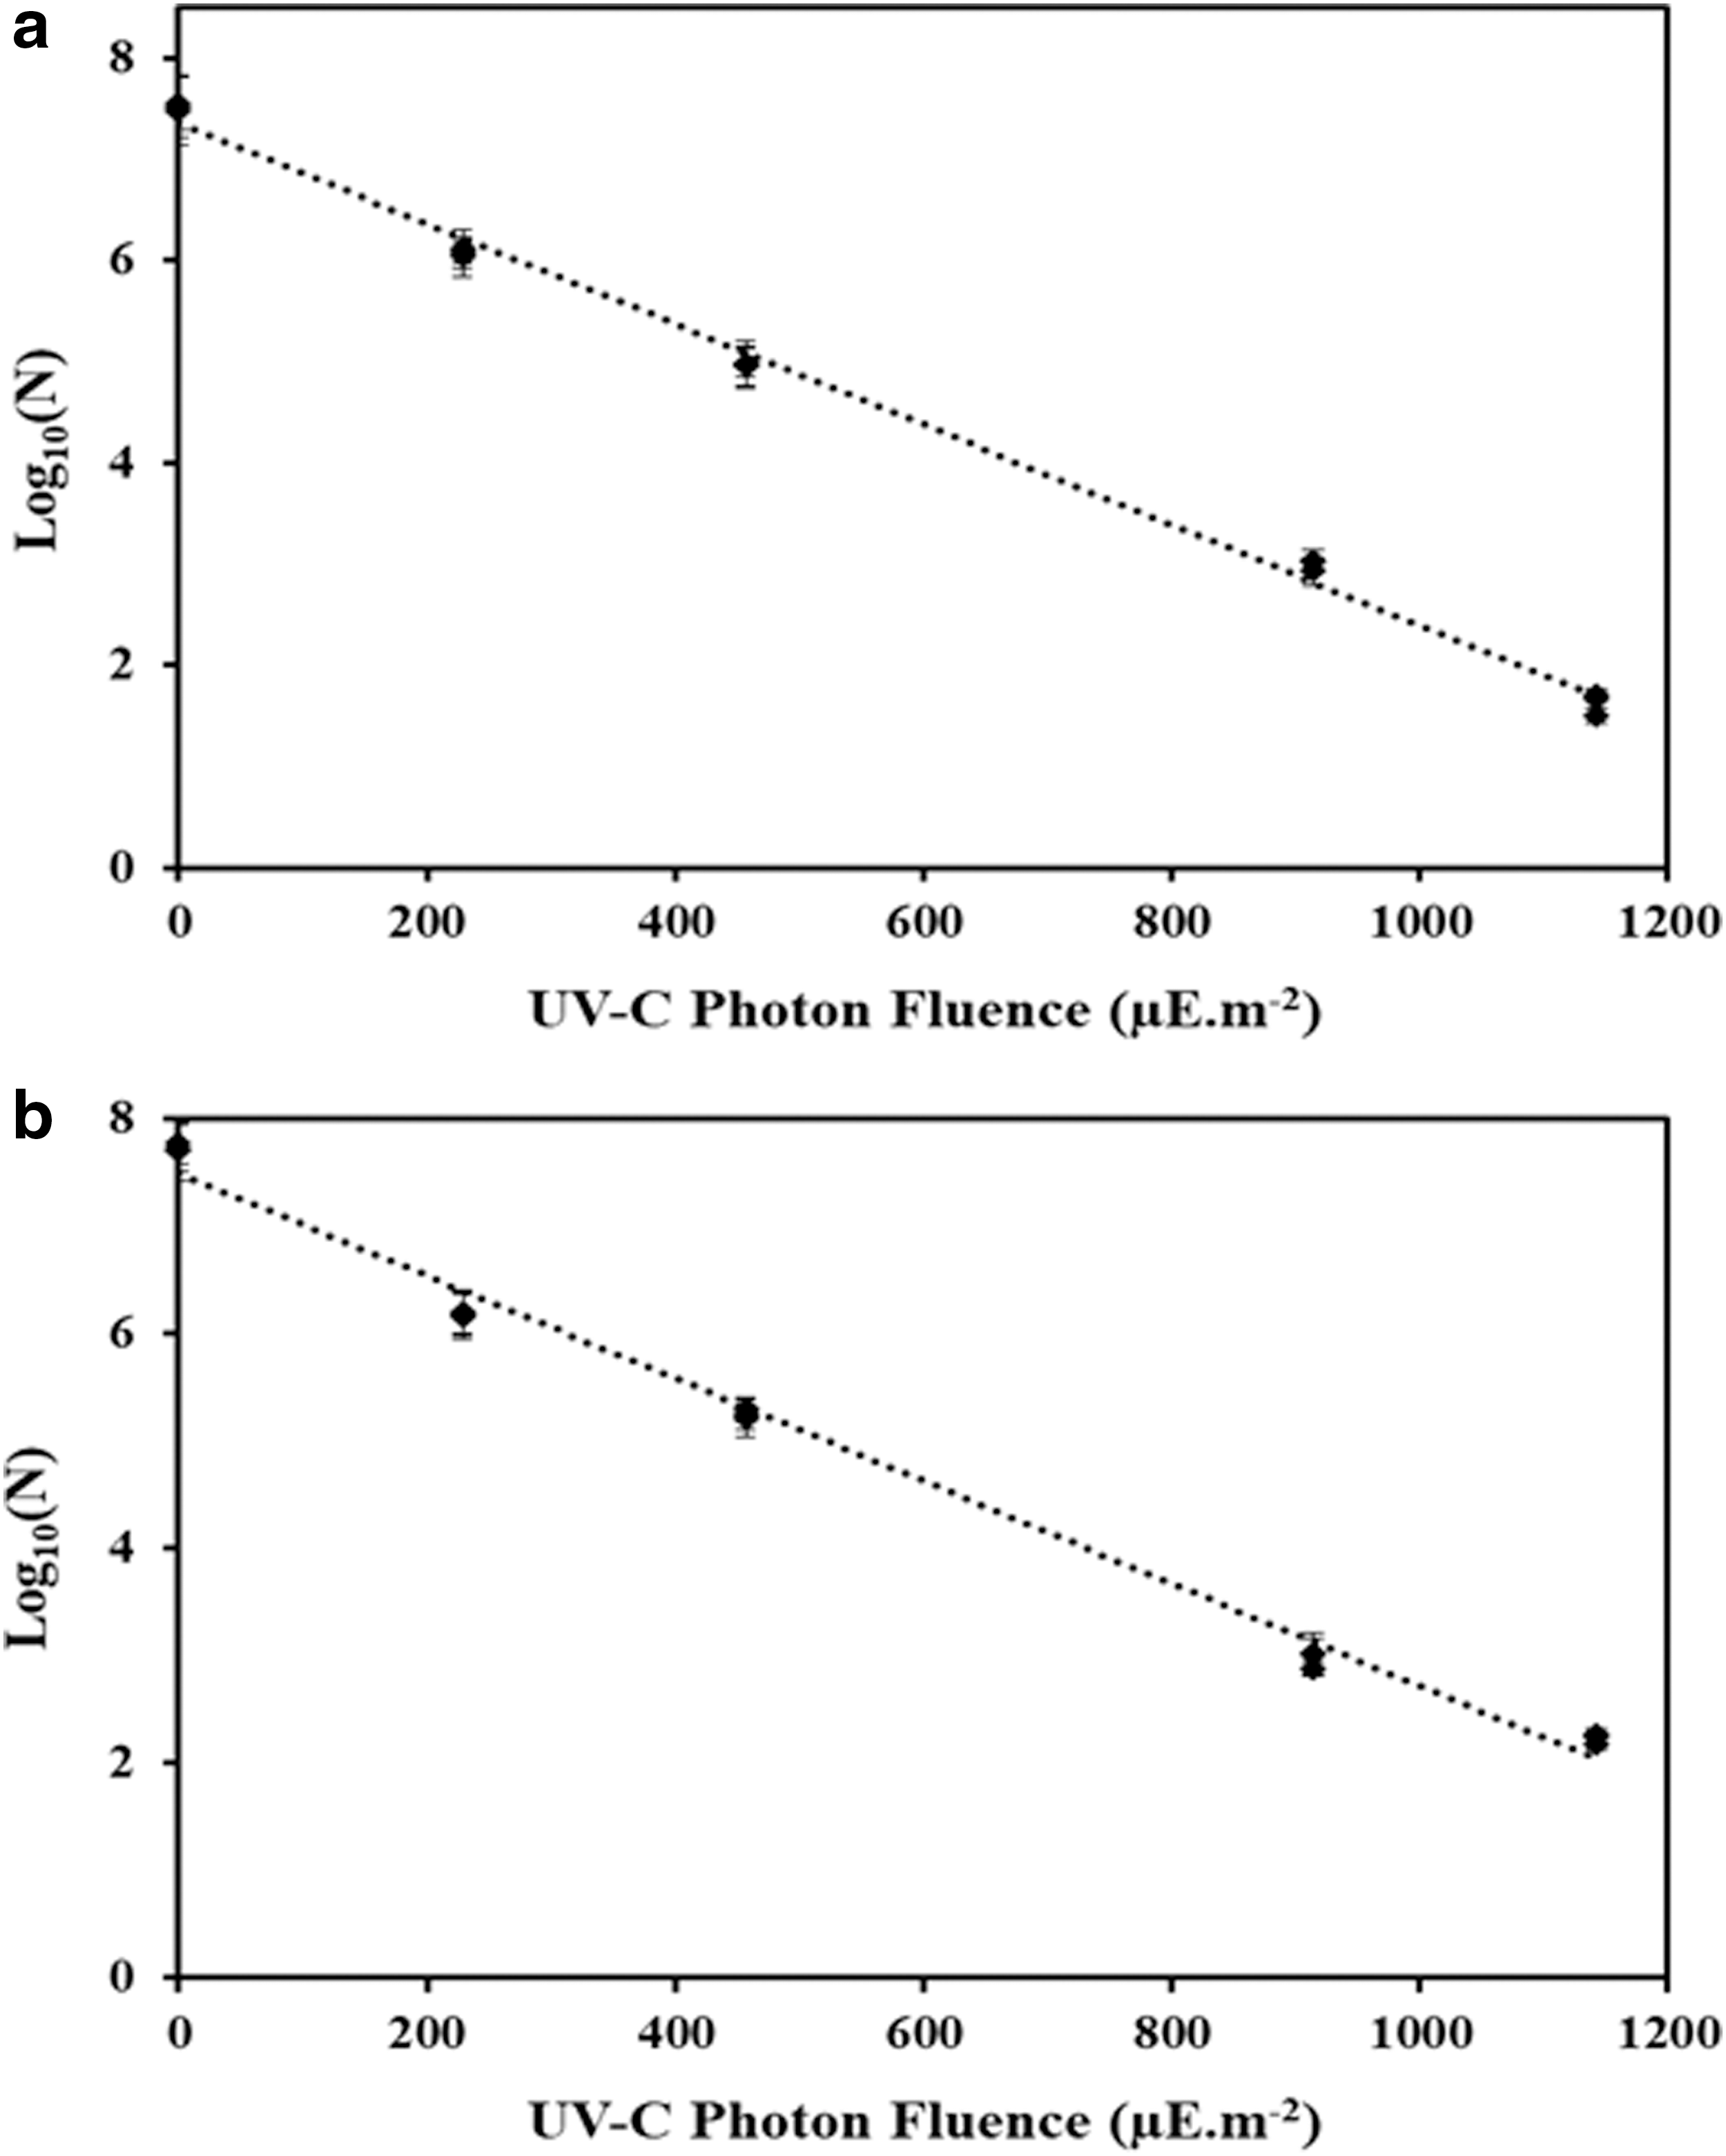
UV-C photon fluence response curves of Bacillus cereus spores in
A log-linear model was able to describe B. cereus inactivation kinetics during UV treatment. The parameters of the log linear model are shown in Table 2. The log linear model provided a good fit with R 2 = 0.99 and D10 value of 194 ± 3.4 and 197 ± 2.3 μE·m−2, for SW and CW. Statistical analysis revealed the p-value corresponding to the F-statistic of one-way ANOVA is 0.27, which is higher than 0.05, suggesting that the D10 values of B. cereus in SW and CW are not significantly different for that level of significance. This result also supports the fact that “photon fluence is photon fluence,” so no matter in what fluid the microbe is suspended, photon fluence-based inactivation rate constant would be identical. This also shows that consideration of optics of the fluids to provide specific UV-C photon fluence delivery (Table 1) to spores results in the same inactivation in both test fluids (Fig. 3 and Table 2).
Kinetic Parameters of Log Linear Regression Model
D10—90% reduction in microbial concentration or 10% survival.
Statistical analysis of D10 values was performed separately for B. cereus and C. sporogenes.
ATCC, American Type Culture Collection; CW, coconut water; RMSE, root mean square error; SW, sterile water.
Some authors have reported that UV sensitivity is affected by the fluid in which the organism is suspended. For example, the D10 of the bacterial strain E. coli K12 (ATCC 25253) suspended in variety of fruit juices (fresh squeezed white grape juice, lemon melon juice, and apple juice) has been reported as 31 J·mL−1, 0.4 J·mL−1, and 442 mJ·cm−2 respectively (Unluturk and Atilgan, 2014; Kaya et al., 2015; Akgün and Ünlütürk, 2017). These studies did not account for fluid optical properties and the authors calculated fluence based on incident irradiance at the surface of the sample. Data obtained with different optical properties may only be compared if absorbance is considered and UV fluence in the fluid suspension is calculated appropriately. The CB approach used in the present study accounts for all relevant optical factors as discussed in material and method section.
UV-C inactivation curves in both fluid types for both spores followed log-linear behaviour without tailing (Fig. 3). For a purified spore sample, this confirms uniform distribution of photon fluence delivery attributed to efficient mixing of fluid throughout the reactor. Incontrast deviations from linearity (tailing) can result from nonuniform photon fluence distribution caused by inefficient mixing of fluid in the reactor system (Koutchma et al., 2004).
Some studies have reported extremely high UV photon fluence required for inactivating B. cereus. Clauß (2006) reported a high D10 value 52 mJ·cm−2 (equivalent to photon fluence of 1103 μE·m−2) for B. cereus ATCC 11778 spores irradiated with UV-C light in 85 mm standard polystyrene petri dishes (working volume 25 mL, fluid depth of 4.4 mm) “without intermixing and shade effects.” In this case, the spores present in top layers of suspension would have been exposed to higher photon fluence as compared to spores at the bottom layers, leading to nonuniform distribution of UV photon fluence and low inactivation. The results of Blatchley et al. (2005) are in good agreement with our results, with reported D10 of 8.75 mJ·cm−2 (equivalent to photon fluence of 186 μE·m−2) for aqueous spore suspension of B. cereus T in 0.01 M NaHCO3 (pH 8.0). For other Bacillus species, Mamane-Gravetz and Linden (2004) identified D10 value of 24 mJ·cm−2 (equivalent to photon fluence of 510 μE·m−2) for aqueous spore suspension of B. subtilis.
C. sporogenes
UVT of the test fluids ranged from 8.36E-07—0.00043%·cm−1 at 254 nm wavelength (Table 1). Figure 4 illustrates the inactivation of C. sporogenes spores in SW and CW. At maximum UV-C photon fluence of 1919 μE·m−2, the results show 6.0 log reduction in SW and 5.9 log cycle reduction of CW (Fig. 4). Like B. cereus, the data followed a log linear trend, hence a log linear model was able to describe C. sporogenes inactivation kinetics. The model parameters are shown in Table 2. The results show R 2 > 0.98 and D10 value of 300 ± 12 and 318 ± 4.6 μE·m−2, for SW and CW. Statistical analysis of D10 values of C. sporogenes in SW and CW revealed the p-value corresponding to the F-statistic of one-way ANOVA is 0.44, which is higher than 0.05, suggesting that the values in the two fluids are not significantly different for that level of significance. This also further confirms under the condition of similar photon fluence delivery to spore particles (Table 1), the test fluids did not affect spore inactivation kinetics (Fig. 4 and Table 2). Based on the extrapolated data, FDA recommended 12 log reduction of C. sporogenes could be achieved at UV-C photon fluence delivery of 3580–3820 μE·m−2 (169–180 mJ·cm−2) (Table 1).
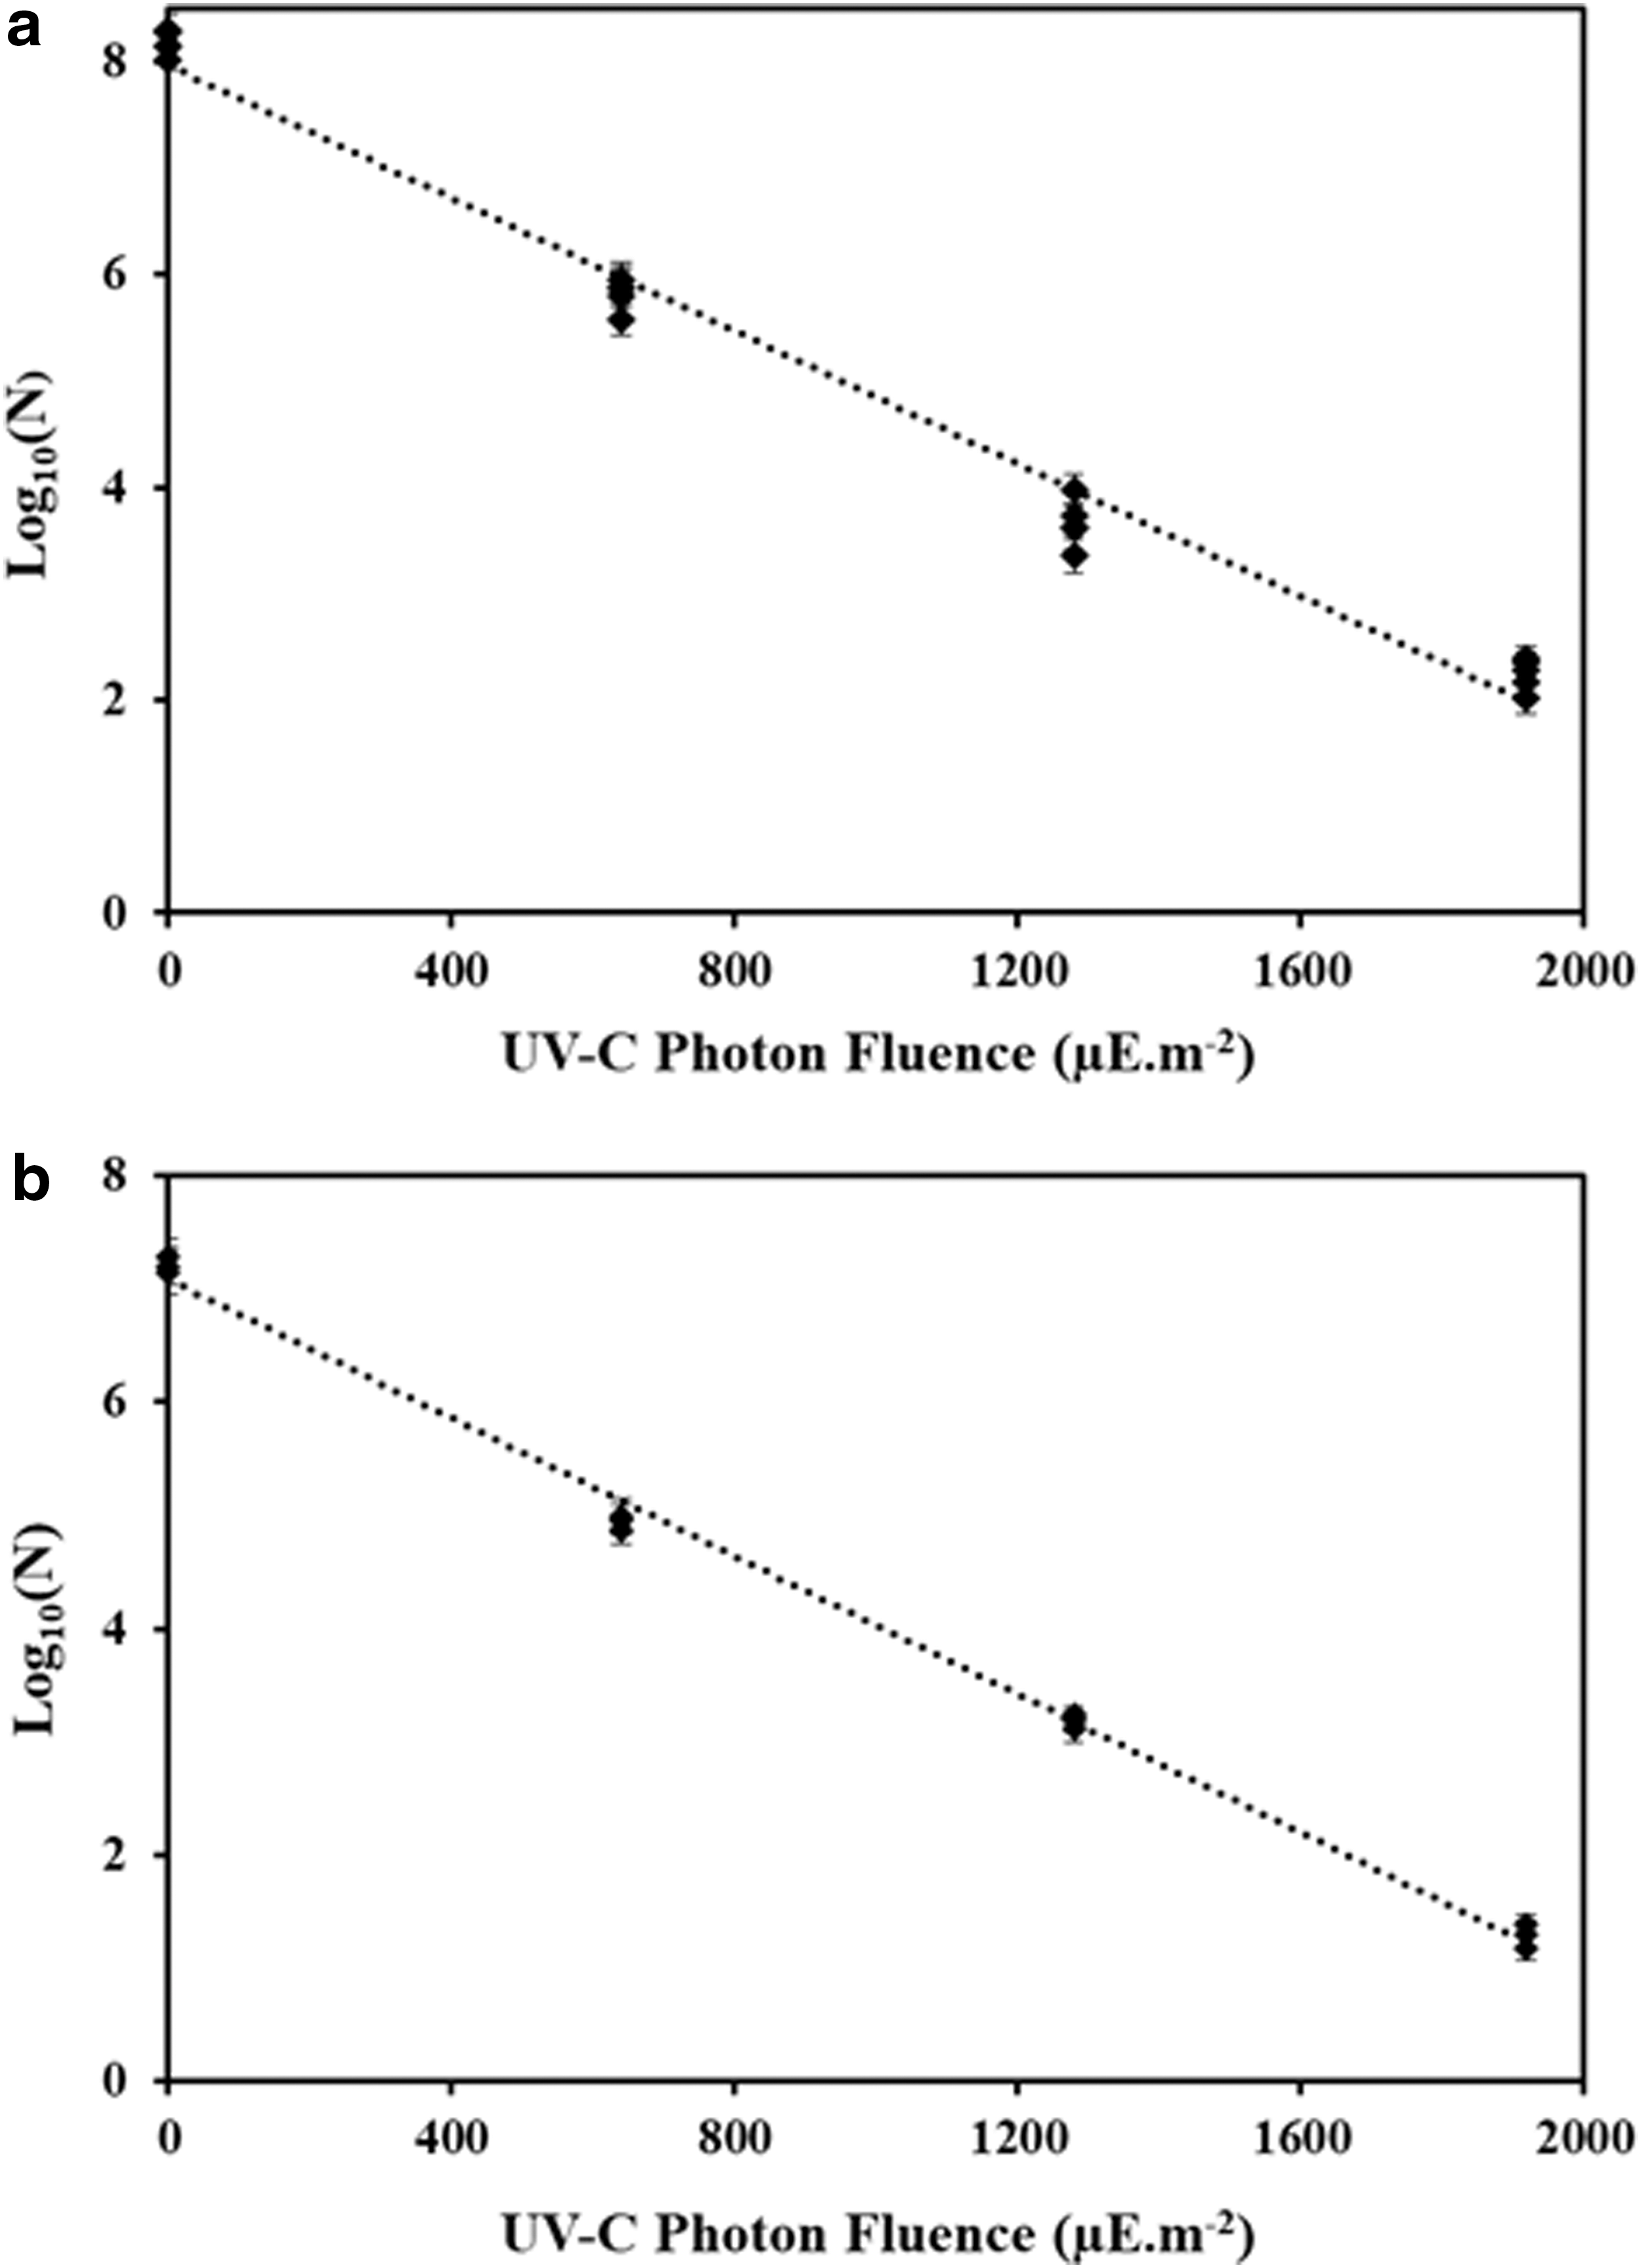
UV-C photon fluence response curves of Clostridium sporogenes spores in
To date, no published studies are available on inactivation of C. sporogenes spores using 254 nm UV-C light. The present study used C. sporogenes as a practical nonpathogenic surrogate for the toxin-producing C. botulinum. Durban and Grecz (1969) reported a very similar D10 value 16.53 mJ·cm−2 (equivalent to photon fluence of 351 μE·m−2) for inactivation of C. botulinum 33A spores. While the results are in good agreement, there are concerns regarding the methods used to irradiate the samples in the Durban study. In that work aliquots (5 mL) of the spore suspension were placed into sterile petri dishes, exposed to UV-irradiation. During irradiation, the petri dishes were rotated by hand to keep the spores uniformly suspended, but they were not stirred. It is doubtful that rotation by hand would result in a uniform photon fluence delivery throughout the suspension.
Experimental results revealed that C. sporogenes spores are more resistant to UV-C light than B. cereus. This might be due to differences in biophysical and biochemical composition of both spores, which can influence the specific UV-C photon fluence delivery to spore DNA. Different bacterial species show variation in UV-C light resistance (Keyser et al., 2008; Koutchma, 2009).
Conclusions
This study evaluated the UV inactivation of dormant spores of two bacterial species, B. cereus and C. sporogenes. It was found that the inactivation followed first-order kinetics over at least 6 log of inactivation. The photon fluence per log, D10, was 194 ± 3.4 μE·m−2 for B. cereus spores and 300 ± 12 μE·m−2 for C. sporogenes spores. So long as the optics of the fluid medium is considered in photon fluence calculations, the inactivation was found to be independent of the fluid media, with the same inactivation found in buffered water and CW. Overall, this study demonstrated the efficacy UV-C light in inactivating endospores in highly opaque fluids. The UV sensitivity data generated from this research study will be used to conduct spore inactivation studies in pilot scale continuous flow UV systems.
Footnotes
Acknowledgments
This project is funded under the Agriculture and Food Research Initiative (Food Safety Challenge Area), United States Department of Agriculture, Award number (2015-69003-23117). The authors would like to thank Trojan Technologies for providing valuable guidance in this project.
Disclosure Statement
No competing financial interests exist.