
Abstract
This study evaluated the acid tolerance response (ATR) of two strains of Listeria monocytogenes (serotype 1/2a and 4b) and one strain of Listeria innocua under different mildly acid conditions. Cells were incubated in combinations of three concentrations of lactic acid medium (3, 4.75, and 15 mM) and three external pH's (pHex 5.0, 6.0, and 6.5), plus, a HCl control, and a blank control (pH 7.4). Results showed that lactic acid induced lower log reduction of all three strains when challenged in severe acid conditions (pH 3.0) after being habituated at a pHex of 5.5 or 6.0 until the log phase, compared with a pHex of 6.5 or the two controls. This indicates that when the pHex was either 5.5 or 6.0 this induced a higher ATR of the strains, which may be caused by the ability of the strains to retain intracellular pH (pHi) homeostasis with pHi maintained in the range of 7.4–7.9. It was also found that a pHex of 5.5 resulted in the highest pHi of the strains across all incubated conditions, which indicates that the pHi may play an important role in the induction of ATR when Listeria cells are habituated in lactic acid, and if the higher pHi can be maintained, the ATR would be stronger. The concentration of lactic acid per se has no significant effect on ATR, which it is proposed was due to the pHi homeostasis maintained within the cells. However, the difference in ATR among three strains was also significant, which cannot be explained by the stable pHi of all tested strains. Therefore, other underlying mechanisms to mediate ATR under different conditions need to be explored in further studies.
Introduction
Listeria monocytogenes, a Gram-positive intracellular pathogen, causes listeriosis in both human and animals, which has been associated with several fatal outbreaks in recent years (Hamon et al., 2006; Milillo et al., 2012). This bacterium is widespread in food processing which is a concern, due to its strong resistance to harsh conditions (Montero et al., 2015). Organic acids such as lactic acid are widely used in the food industry to control pathogens. In the meat industry, lactic acids are currently used as sprays to decontaminate meat surfaces (Cherrington et al, 1991; Ricke, 2003; Carpenter and Broadbent, 2009).
However, acid adaptation of L. monocytogenes is believed to be crucial for its survival, which results in the persistence of this pathogen in food-processing environments (Kroll and Patchett, 1992; Smith et al., 2013). As such L. monocytogenes growing in a mild acid environment could increase its resistance to the lethal pH condition in the stomach, and this phenomenon has been called acid tolerance response (ATR) (O'Driscoll et al., 1996; Koutsoumanis et al., 2003). The ATR will also lead to the occurrence of high-risk pathogenic bacteria, which is a potential danger to human health (Phan-Thanh et al., 2000). Lactic and acetic acids can effectively induce the ATR of L. monocytogenes (O'Driscoll et al., 1996; Skandamis et al., 2012). The pH range that induced the ATR of L. monocytogenes was 4.5–6.0 at 30°C or 37°C (Ferreira et al., 2003; Koutsoumanis and Sofos, 2004). Nevertheless, few studies have investigated the effects of different external concentrations of organic acid on ATR in terms of L. monocytogenes.
To our knowledge, the ATR ability of L. monocytogenes is attributed to multiple acid resistance and regulation systems of pHi, including glutamate decarboxylase (GAD) system, arginine deiminase (ADI) system, 2-component regulatory system, and F0F1-ATPase (Ryan et al., 2008; Smith et al., 2013). However, the mechanism of the inducible acid resistance is still not clear, especially from the perspective of the pHi. Carpenter et al. (2009) pointed out that it is possible to explore the influence of the adjusted external pH and concentration of organic acid on the pHi of L. monocytogenes. Moreover, previous studies found that pHi is a major factor in the induction of ATR in Bacillus cereus and Lactococcus lactis (Sullivan and Condon, 1997; Thomassin et al., 2006). We presumed that adjusting the extracellular concentration of lactic acid and pH of L. monocytogenes growth environment will influence the ATR of this pathogen through the alteration of the concentration of pHi.
Therefore, the objective of this current study was to explore the ATR in L. monocytogenes exposed to lactic acid and to find out the optimal condition which can trigger the highest ATR at three different pHs (5.5, 6.0, and 6.5) and three lactic concentrations (3, 4.75, and 15 mM) and then contribute to unravel the underlying mechanism of ATR in L. monocytogenes from the perspective of pHi values.
Materials and Methods
Bacterial strains and culture conditions
Three bacterial strains used in this study include L. monocytogenes serotype 1/2a strain CMCC 54002 and L. monocytogenes serotype 4b strain ATCC19115 (both from Nanjing Agricultural University) and L. innocua strain ATCC 33090 (from China National Research Institute of Food and Fermentation). Stock cultures of each strain were maintained in brain-heart infusion (BHI; Beijing Land Bridge Technology) with 25% (v/v) glycerol at −20°C. The three strains were activated at 37°C for 18 h.
The growth medium was used in modified BHI without glucose. The baseline control treatment was 100 mL of modified BHI (pH 7.4). Hydrochloric acid (HCl) control treatments were 100 mL modified BHI adjusted to pH 5.5, 6.0, and 6.5 with HCl. Organic acid treatments were 100 mL modified BHI containing 3, 4.75, and 15 mM of L-lactic acid (Aladdin Reagent Shanghai) and which was adjusted for pH to 5.5, 6.0, and 6.5 with HCl, respectively.
Growth curves
Three activated strains were individually transferred into abovementioned 13 different mediums by a 1 mL inoculum (1%; v/v), and the method was according to the description by Zhang et al. (2014).
Measurement of inducible resistance to acid
Three activated strains were transferred into 13 different mediums as above mentioned, and cells were harvested at 8 h (mid-log phase) by centrifugation (5000 g for 10 min; 5804R, Eppendorf, Germany) at 4°C. The method was according to as described by Zhang et al. (2014). Briefly, duplicate samples (1 mL) of each treatment were subjected to the acid stress culture (previously adjusted to the pH 3 with HCl) for 1 h at 37°C and then plated on brain-heart infusion agar (BHIA). Survival was calculated based on the equation: log reductions (log CFU/mL) = logN0 - logNC.
Measurement of intracellular pH
The pHi of the above three strains in different mediums when cells were grown to mid-log phase was determined by the method described previously (Breeuwer et al., 1996).
Cells loaded with fluorescent probe
Briefly, harvested cells were centrifugated, washed, and resuspended in 50 mM HEPES buffer (pH 7.2, with 5 mM EDTA). Subsequently, cells were incubated for 30 min at 37°C in the presence of 1.0 μM 5- (and 6-) carboxyfluorescein succinimidyl ester (cFSE, #22028, AAT Bioquest®), then resuspended in 50 mM potassium phosphate buffer (pH 6.8), and incubated with glucose (10 mM) for an additional 30 min at 37°C. The cells were then resuspended in phosphate buffer (pH 6.8), making a cell density of ∼107 CFU/mL.
Establish calibration curves
The cells in baseline control were used to establish calibration curves, which were determined in buffers (50 mM glycine, 50 mM citric acid, 50 mM Na2HPO4 · 2H2O, and 50 mM KCl) with the pH ranging from 5.5 to 8.5 (eight sampling points). The intracellular and external pH were equilibrated by addition of valinomycin (Val, 1 μM) and nigericin (Nig, 1 μM). After 15 min incubation, the fluorescence intensities of samples were measured by a spectrofluorometer (RF-5301PC, SHIMADZU, Japan). The excitation wavelengths were set at 490 and 435 nm, respectively, and the emission wavelength was 520 nm, when the excitation and emission slit widths were both 5 nm. The calibration curve was plotted by polynomial regression analysis between ratio490/435 and the equilibrated pHi values. The goodness of the model fitting was tested by R-square (R 2) and residual mean square error values; the Akaike Information Criterion (AIC) values were also calculated to analyze the overfitting: AIC = nln(SSE) +2p (Chen et al., 2019; Zhao et al., 2019a, 2019b).
Measurement of pHi of strains
The fluorescence intensities and the ratios490/435 of the treated cells described above in 13 different mediums were measured. The pHi values were calculated by substituting the ratios490/435 into the fitting formula of the calibration curves. All data were reported as the mean of three independent experiments.
Statistical analysis
The MIXED procedure (SAS, version 9.0) was applied with strain, pH, lactic acid concentration and their interactions as fixed factors, and repetition as a random factor, to analyze inducible acid resistance and pHi values. Least square means were separated using the PDIFF option and were considered significant at p < 0.05. The pHi calibration curves were obtained by R software regression treatment.
Results and Discussion
Growth curves
Growth curves for each Listeria strain in the organic or inorganic acid treatments were determined to establish sampling times for the measurement of inducible acid resistance of each strain (Figs. 1–3). It found that the growth curves created based on absorbance values were inconsistent with those based on the total viable count. Several previous studies presented similar results (Francois et al., 2005; Tessema et al., 2012; Zhang et al., 2014). In our study, we relied on plate counting methodology to ensure the accurate determination of L. monocytogenes growth and survival.
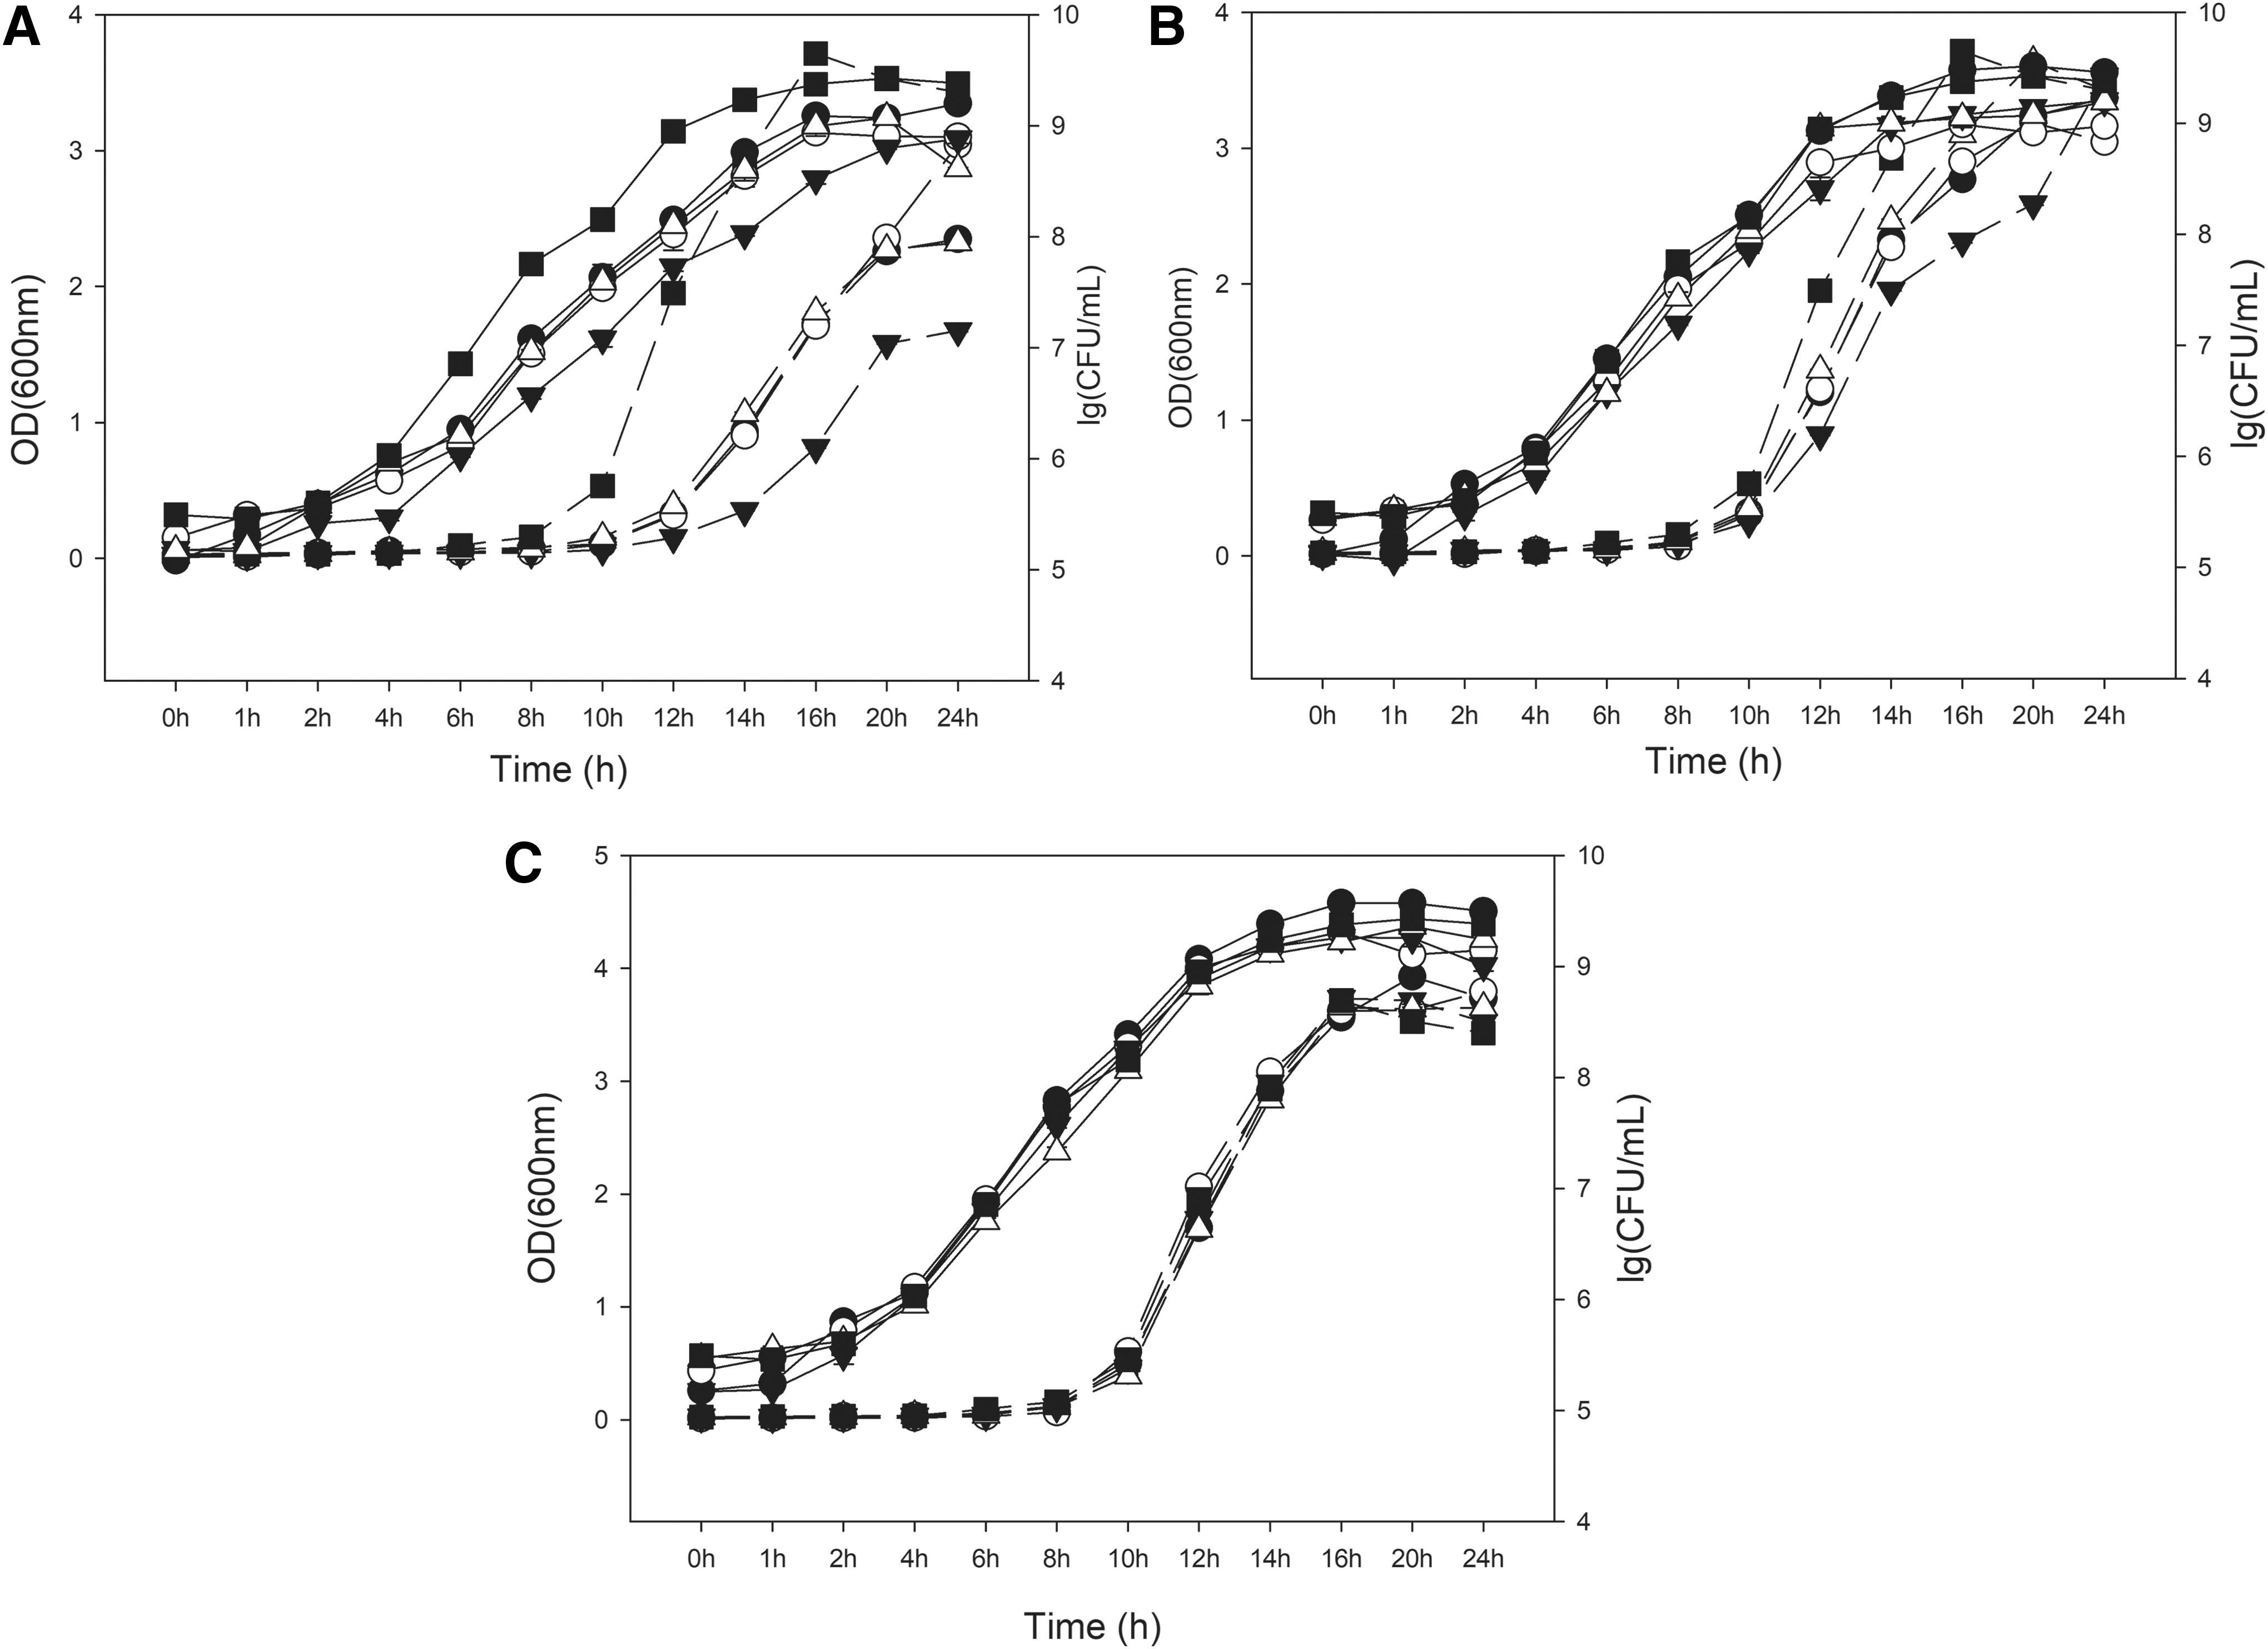
Comparison of growth curves for Listeria monocytogenes serotype 4b in various acid concentrations (37°C). Dotted lines are OD600, while solid lines indicate plate count numbers. Symbols: •, 3 mM lactic acid; ○, 4.75 mM lactic acid; ▾, 15 mM lactic acid; ▵, 0 mM HCl without lactic acid; ▪, BHI at pH 7.4.

Comparison of growth curves for L. monocytogenes serotype 1/2a in various acid concentrations (37°C). Dotted lines are OD600, while solid lines indicate plate count numbers. Symbols: •, 3 mM lactic acid; ○, 4.75 mM lactic acid; ▾, 15 mM lactic acid; ▵, 0 mM HCl without lactic acid; ▪, BHI at pH 7.4. Panel
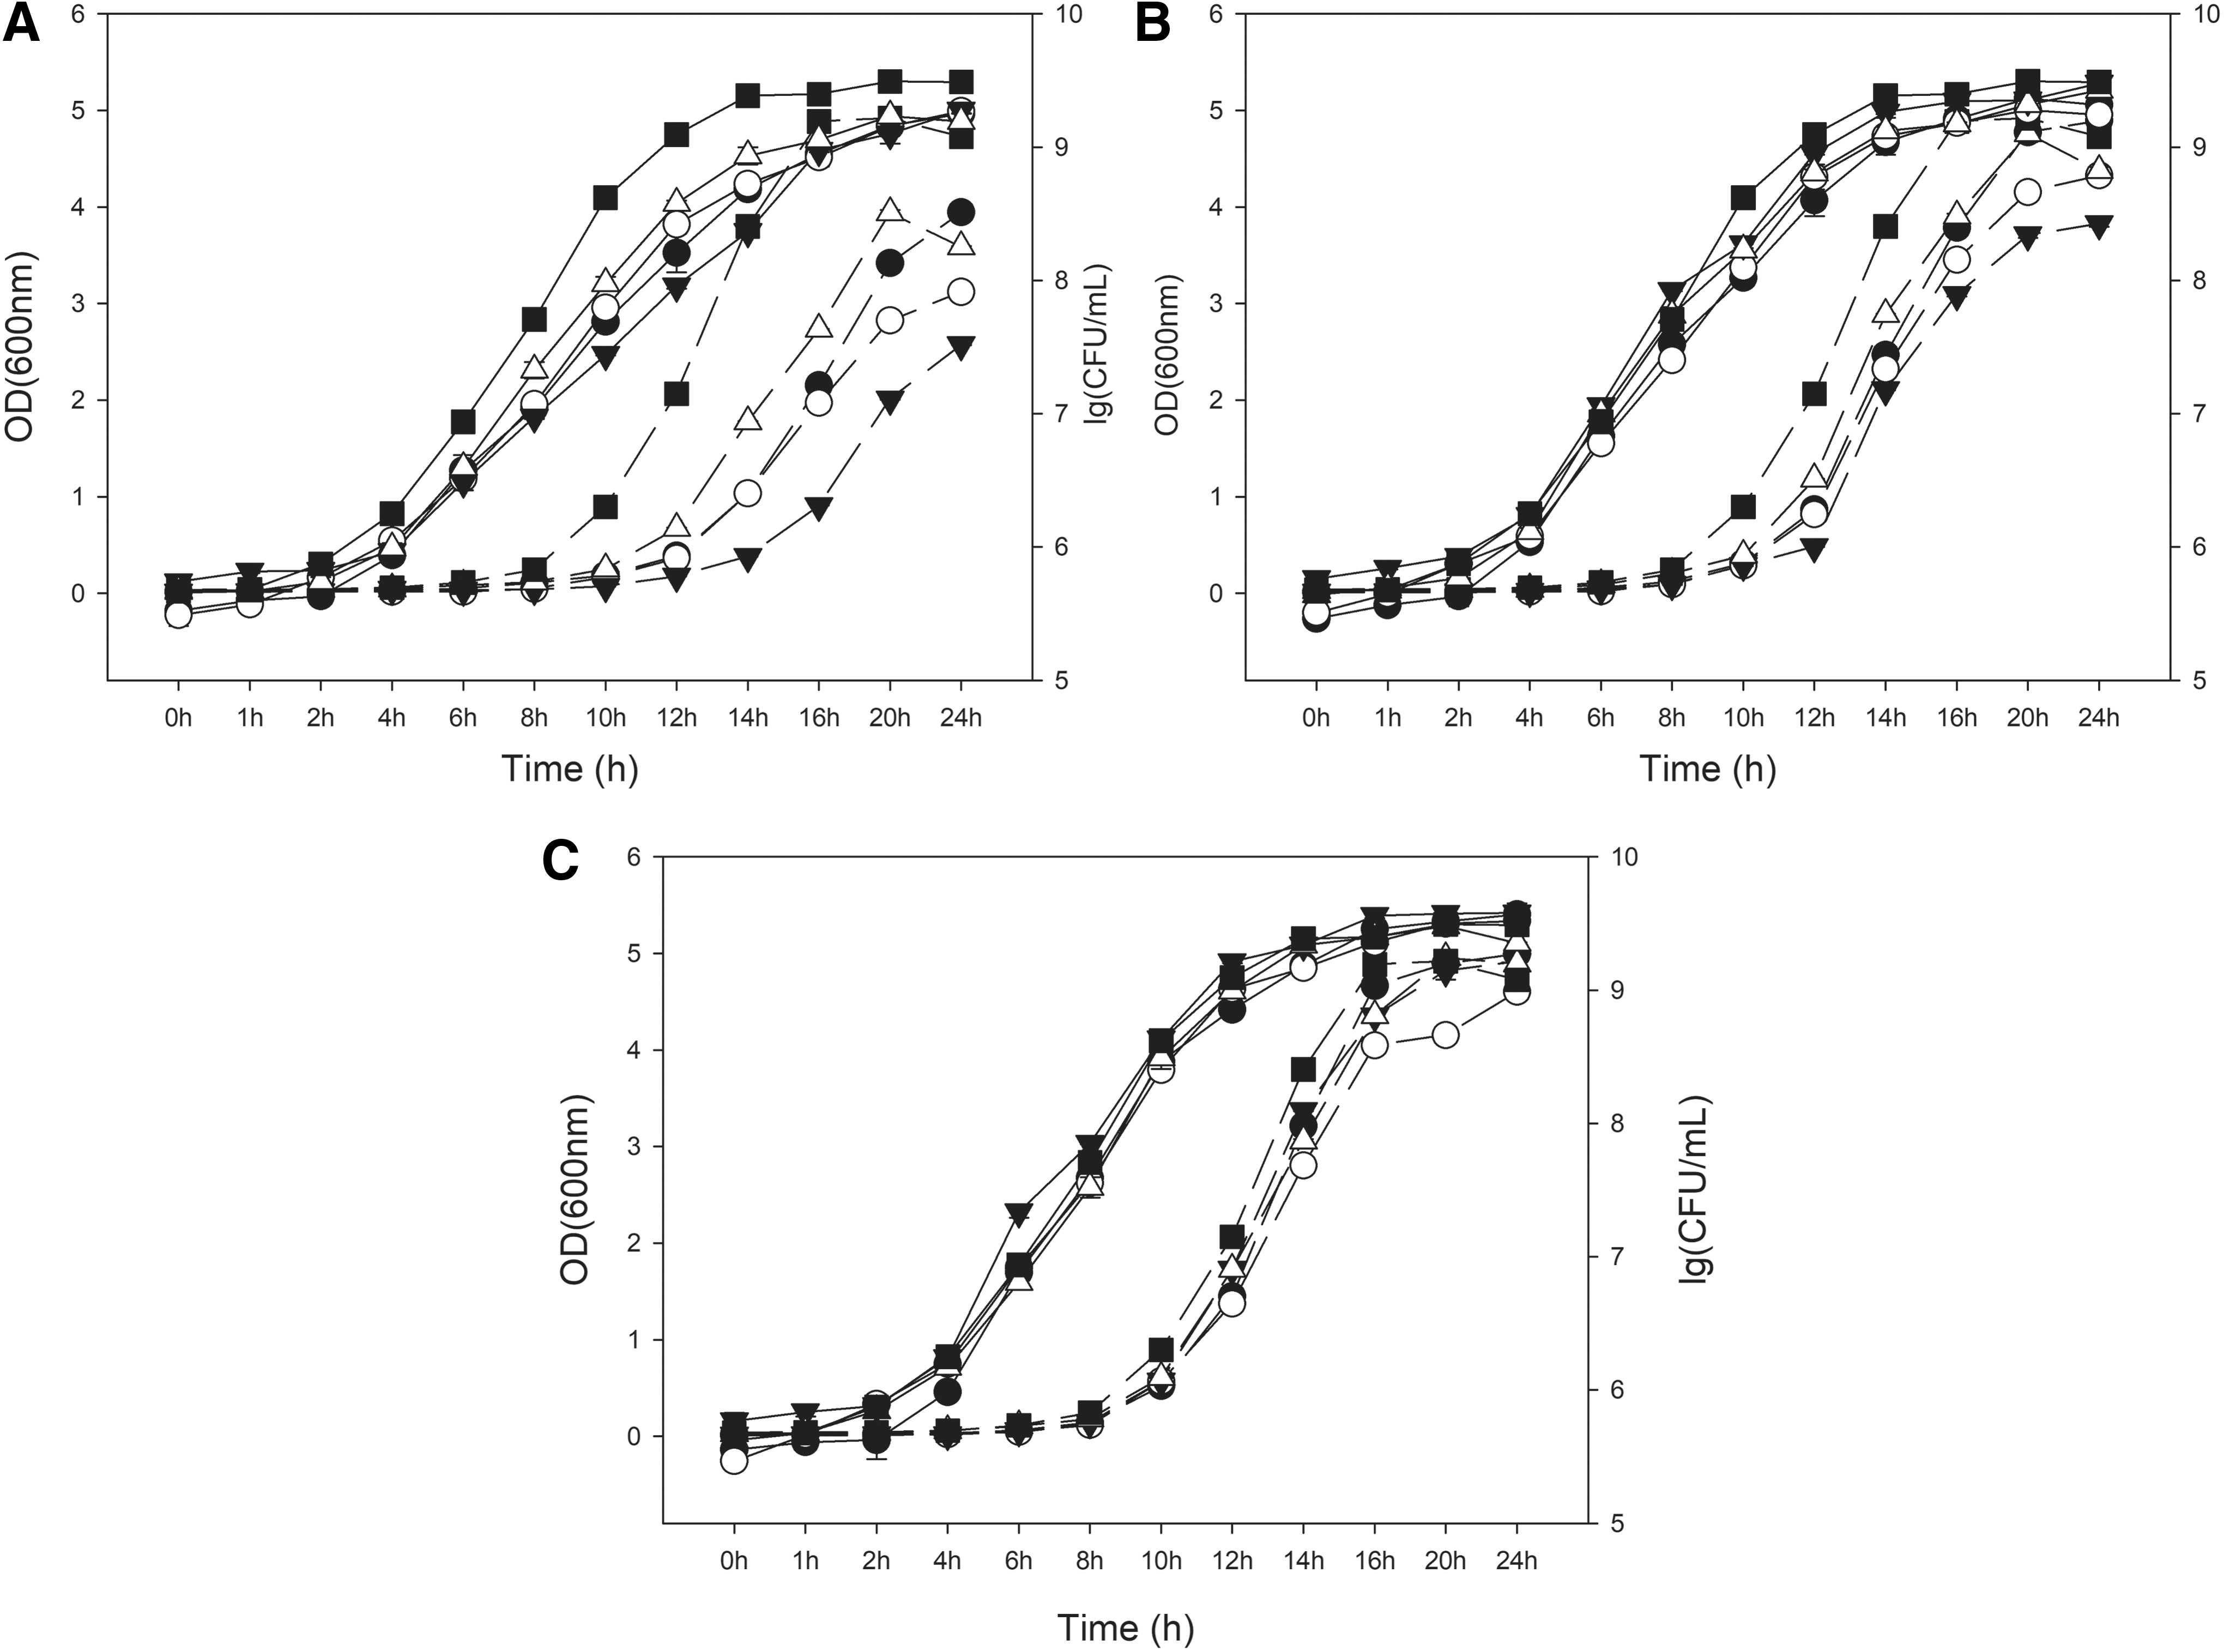
Comparison of growth curves for L. innocua in various acid concentrations (37°C). Dotted lines are OD600, while solid lines indicate plate count numbers. Symbols: •, 3 mM lactic acid; ○, 4.75 mM lactic acid; ▾, 15 mM lactic acid; ▵, 0 mM HCl without lactic acid; ▪, BHI at pH 7.4.
As showed in Figures 1–3, all the curves reached obvious mid-log phase of growth at about 8 h, and growth curves of three strains had similar trends in each treatment. The optimal pH for growth of the three strains was pH 7.4, and the growth of cells slowed down as the pH of the medium decreased. Lactic acids exerted more inhibitory effect on Listeria cells than did HCl, and the growth of cells slowed down as the concentration of lactic acid increased (Figs. 1–3). These results are similar to some previous reports that organic acids were more antimicrobial than inorganic acids (Russell 1991; Trcek et al., 2015).
Inducible acid resistance
Log reduction of cells was used to illuminate the acid resistance of each strain in each treatment, and the higher this value represented lower inherent or induced acid resistance of strains.
The inherent acid resistance of the three strains was determined by the log reductions of uninduced cells in baseline control treatments after challenge for 1 h at pH 3.0, and the results for L. innocua, L. monocytogenes serotype 1/2a, and L. monocytogenes serotype 4b were 4.45, 3.52, and 5.26 (Table 1), respectively. It indicates that L. monocytogenes serotype 1/2a has the highest inherent acid resistance, and it also showed a stronger induced acid tolerance than other two strains in the acid treatments (p < 0.05). There was a significant strain × lactic acid concentration × pH interaction effect on log reductions (p < 0.05). pHex was a critical factor to affect acid resistance of cells. The log reduction of all strains significantly increased with the increase of habituated pH in most lactic acid concentrations (p < 0.05), which indicates that exposure to a pH of 5.5 resulted in the strongest ATR for Listeria. Similarly, Koutsoumanis et al. (2004) explored the effects of the induced pH on the ATR in L. monocytogenes (serotype 4b and 1/2a) grown to the stationary phase, and they found that the pH range from 5.0 to 6.0 induced the ATR of Listeria and a pH of 5.5 induced the maximum acid resistance. Our results demonstrate that when pH ranged from 5.5 to 6.5 this was also effective for inducing the ATR in log-phase cells.
Log Reductions (Log CFU/mL) of Habituated Log-Phase Strains After 1 h Challenge at pH 3.0
Means in a column within a strain with a different letter differ (p < 0.05).
Means in a row within a strain with a different letter differ (p < 0.05).
Means in a column within an acid concentration with a different letter differ (p < 0.05).
S = specie of strain.
C = lactic acid concentrations.
SE, standard error; LM, Listeria monocytogenes.
Habituation of L. monocytogenes serotype 4b in organic acid conditions induced significant acid resistance compared to inorganic acid conditions (HCl control, 0 mM lactic acid), while there were no differences among different lactic acid concentrations (3, 4.75, and 15 mM, p > 0.05). This is consistent with previous established knowledge that lactic and acetic acids were more effective in inducing the ATR than HCl (O'Driscoll et al., 1996; Zhang et al., 2014). It was shown previously that dissociated organic anions inside cells can kill the bacteria if the anions were not expelled or consumed. Accumulation of anions could induce cell burst due to increasing osmolality and pressure (Carpenter et al., 2009). However, in the current study, there were no differences in the inducible acid resistance among three external concentrations of lactic acid (3, 4.75, and 15 mM) within same pHex of three strains (p > 0.05). These results indicate that the effects of lactic acid induced acid resistance of L. monocytogenes were largely related to the pH conditions instead of the concentration of the organic acid.
Intracellular pH
Calibration curves
Calibration curves (Ratio490/435 and pHi) were plotted for each strain in BHI as indicated that curves established by 8 sampling points (pHex 5.5–8.5) were found to be best fitted by third-degree polynomial equations shown in Figure 4. R 2 values were all above 0.96, which indicated that the method using cFSE as a fluorescent indicator to measure Listeria pHi was stable and applicable to all strains in this study.
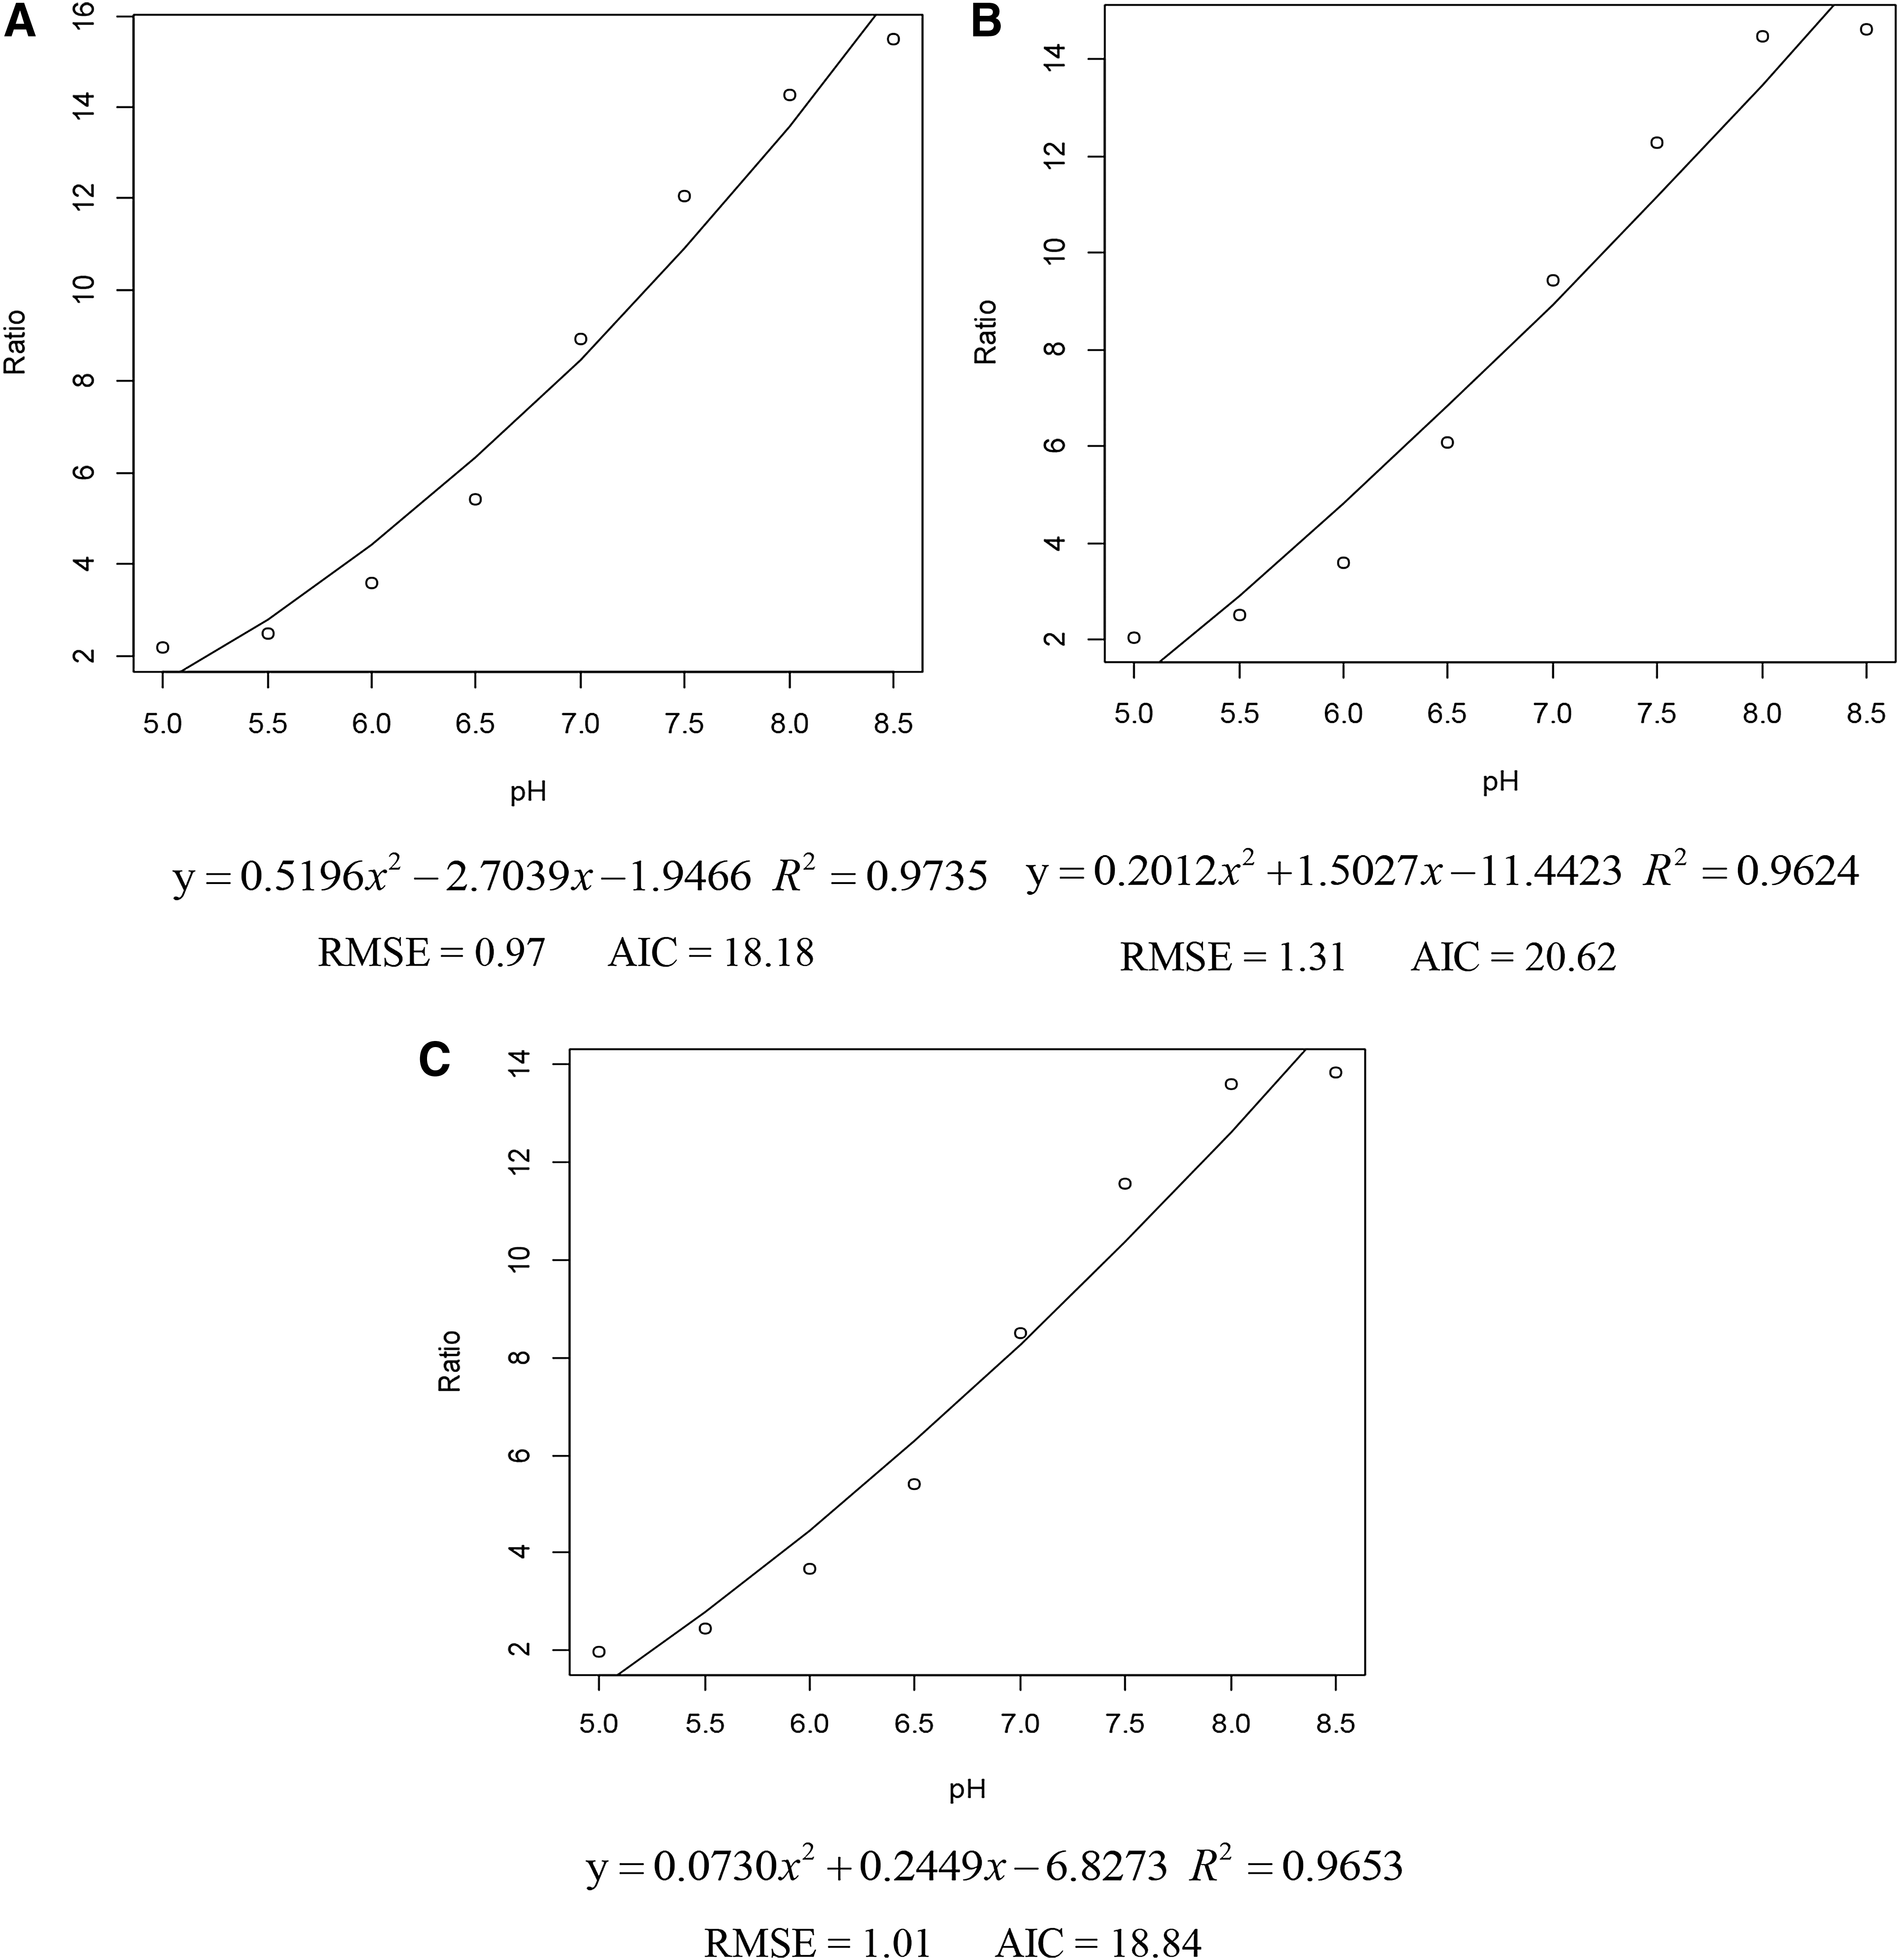
The relationship between the pH and the ratio (490–435 nm) of cFSE in BHI of three strains
Intracellular pH of strains
In the blank control treatment, the pHi of L. monocytogenes serotype 1/2a was 7.72, which was higher (p < 0.05) than L. innocua and L. monocytogenes serotype 4b (7.44 and 7.35, respectively). The pHi of strains in acid treatments is shown in Table 2. There were no differences of factor's interaction for pHi, while strains and pH showed effects (p < 0.05). All three strains maintained their pHi within a narrow range of 7.4–7.9 when exposed to extracellular pH ranging from 5.5 to 6.5. Analogous results were reported by previous studies (Siegumfeldt et al., 1999; Budde and Jakobsen, 2000), which showed that the pHi of L. monocytogenes was almost constant (approximately pH 8.0) when the pHex changed within the range from 5.0 to 9.0. The ability of Listeria to maintain pHi homeostasis is critical for many cellular processes, such as DNA transcription, protein synthesis, and enzyme activities in acidified environments (Kastbjerg et al., 2009). And pHi homeostasis also plays an important role in acid stress regulations in L. monocytogenes (Cheng et al., 2015).
Intracellular pH Values of Three Strains After 8 h Acid Adapted at Different Conditions
Mean strains with a different letter differ (p < 0.05).
Mean pH values with a different letter differ (p < 0.05).
S = specie of strains.
C = lactic acid concentrations.
SE, standard error; LM, Listeria monocytogenes.
As stated previously, L. monocytogenes serotype 1/2a has the highest basal pHi and greatest inherent acid tolerance. It also showed a stronger induced acid tolerance and a higher pHi compared with the other two strains in the acid treatments (p < 0.05). These results indicate that L. monocytogenes serotype 1/2a exerted a better ability to coping with the acid stress than other two strains. Recent researches showed that organic acids may induce a coordinated metabolic and virulence gene transcription response of L. monocytogenes (Stasiewicz et al., 2011; Davis et al., 2019). Compared to the strain H7858 (serotype 4b), organic acid treatment induced transcription of the PrfA virulence regulon in F6854 (serotype 1/2a), but the factor SigB (a global stress response regulator in Listeria) did not detect significant changes in both strains (Stasiewicz et al., 2011). In addition, protein regulated by gad genes, which contributes to the acid resistance of L. monocytogenes, is missing from L. innocua CLIP11262 (Cotter et al., 2005). Overall, the possible relationship between inherent acid tolerance and pHi homeostasis of Listeria cells still requires further study.
Moreover, all strains produced stronger ATR at pHex 5.5 and 6.0 than at 6.5, meanwhile the pHi of the three strains at pHex 5.5 and 6.0 conditions was higher than pHex 6.5 conditions (p < 0.05). This illustrates that the pHi homeostasis of Listeria was more likely to be induced at pHex 5.5 and 6.0 than at 6.5. At different pHex, the concentrations of the undissociated lactic acid were different. The extra hydrogen ions (HCl) can push the ionization equilibrium of lactic acid toward formation side and keep more lactic acid molecules in the medium. Therefore, there are more lactic acid molecules that can freely diffuse into the Listeria cells at the lower pHex conditions. This process may induce the cells to stimulate the regulation systems to maintain the pHi homeostasis, which resulted in the above difference of pHi. Similar discoveries had been reported by Thomassin et al. (2006) that the pHi of Bacillus cereus ATCC14579 was higher at pHex 5.5 compared to pHex 6.0, suggesting that mechanisms of pHi homeostasis were induced. Furthermore, the concentrations of lactic acid exert little effect on ATR of Listeria, which were also consistent with the pHi values. This indicates that the induced ATR was modulated by pHex, and pHi may play an important role in the induction of ATR. Similar study had been investigated in Lactococcus lactis, where the cells with the same inducing pHex value (pHex 5.0) in different kinds of acids produced different pHi values, which resulted in very different rates of survival. This result further proved that pHi is a major factor in the induction of ATR (Sullivan et al., 1997).
Nevertheless, there are still some ATR results which cannot be explained from the perspective of pHi. For instance, L. innocua and L. monocytogenes serotype 4b also exhibited a difference in ATR in most acid conditions, but there was no difference in their pHi values. Further differences in ATR between organic acid treatments and the HCl control were also not reflected in pHi values. GAD pathway and ADI pathway play important roles in acid resistance of L. monocytogenes. The two pathways can reduce the proton concentrations in the cytoplasm by incorporating intracellular protons with glutamate and ammonia, respectively (Cotter et al., 2001; Ryan et al., 2008). Meanwhile, F0F1-ATPase can also work in a reverse direction by hydrolyzing ATP and pumping protons out of the cell (Cotter et al., 2000). Moreover, the changes of acid anions could be a probable cause to influence the ATR of bacteria (Hirshfield et al., 2003). Metabolic changes of Listeria cells under different acidic conditions will also be a good point for exploration (Liu et al., 2017, 2018; Zhao et al., 2019a, 2019b). Therefore, there is a need to undertake further investigation into the full underlying mechanism of ATR of L. monocytogenes.
Conclusions
In this study, lactic acids induced ATR in three Listeria strains, and the inducible acid resistance reduced with increasing pHex, of which pHex 5.5 induced the strongest ATR in cells. From the perspective of pHi, the ATR induced by mildly acidic conditions is caused by the ability of Listeria to stable the homeostasis of pHi, where the lower pHex (pH 5.5) resulted in a higher pHi of strains. Meanwhile, the concentrations of lactic acid exerted no effects on pHi, which may partially explain the similar ATR level induced by different concentrations of lactic acid. It indicates that pHi is an important factor to influence the ATR of Listeria induced by lactic acid. The difference in ATR among three strains was also significant, which cannot be explained from the perspective of pHi. It suggests that other mechanisms such as intracellular acid anions may be related to the development of the ATR in Listeria. Therefore, in future study, the mechanism exploration through determining the lactic acid anion levels in the habituated cells and the influence of pathways could make a better understanding of the ATR in L. monocytogenes and could finally promote a more sensible prevention of food safety risk.
Footnotes
Disclosure Statement
No competing financial interests exist.
Funding Information
This work was supported by earmarked fund for China Agriculture Research System-beef (CARS-37), funds of Shandong “Double Tops” program (SYL2017XTTD12).