
Abstract
The objectives of this study were (1) to estimate the prevalence and concentration of the seven major Shiga toxin–producing Escherichia coli (STEC) serogroups (O26, O45, O103, O111, O121, O145, and O157), collectively called STEC-7, on cattle hides collected in different seasons and beef processing plants; and (2) to determine associations of season, plant, and hide cleanliness scores with the prevalence and concentration of STEC-7. A total of 720 hide surface samples (240/season) were collected over three seasons (summer and fall 2015 and spring 2016) from beef cattle carcasses in four commercial processing plants in the United States. Samples were subjected to selective culture and spiral plating methods. Overall model-adjusted mean prevalence (95% confidence interval) was 0.3% (0.03–2.3%) for STEC O26; 0.05% (<0.01–8.5%) for STEC O45; 0.2% (0.02–1.9%) for STEC O103; 0.05% (<0.01–8.5%) for STEC O145; and 3.1% (0.6–15.2%) for STEC O157. Four percent of hide samples were enumerable for STEC O157; mean concentration (standard deviation) = 2.1 (0.7) log10 colony-forming units (CFUs)/100 cm2. No samples were enumerable for non-O157 STEC. Hide-on prevalence of STEC O157 and STEC non-O157 (specifically of STEC O103) was higher in summer and spring, respectively. Across seasons and plants, the most common STEC non-O157 serogroups in this study (O26 and O103) were associated with a higher prevalence of STEC O157. Season and plant played a role in prevalence and concentration of STEC in beef cattle hides, varying by serogroup. Tailoring mitigation strategies at the plant can be challenging and processors would benefit from supplementary preharvest interventions to reduce overall contamination pressure at the plant, especially in fall and spring months when hide-on prevalence of STEC non-O157 is higher.
Introduction
Several serogroups of Shiga toxin–producing Escherichia coli (STEC) have been associated with outbreaks of human illness, with E. coli O157 being the serogroup most frequently isolated in North America (Brooks et al., 2005). Conversely, serogroups O26, O45, O103, O111, O121, and O145 were reported to account for 71% of all non-O157 STEC human enteric infections occurring between 1983 and 2002 in the United States (Scallan et al., 2011). Given the increase in cases of human illnesses associated with the six non-O157 serogroups, the U.S. Department of Agriculture's Food Safety and Inspection Service (USDA-FSIS) declared them adulterants of raw beef and nonintact products in 2012 (USDA-FSIS, 2012).
Cattle are the major natural reservoir of STEC, both O157 and non-O157 (Bettelheim, 2000). After bacterial colonization of their lower gastrointestinal tract, cattle shed STEC in their feces (Caprioli et al., 2005; Pennington, 2010). At slaughter plants, fecal contamination of hides can occur while cattle are in lairage pens, during dehiding, and during carcass processing through cross-contamination with equipment, viscera, or utensils (Elder et al., 2000; Arthur et al., 2004; Bosilevac et al., 2005; Ekong et al., 2015).
Processing plants implement numerous interventions to reduce contamination and transfer of STEC from cattle hides to carcasses and beef products (Wheeler et al., 2014). The USDA-FSIS encourages the use of a mud scoring system to quantify the amount of mud on cattle upon arrival and identify animals that may pose an increased risk of contamination during hide removal. Processing plants may use that information to decrease the speed of the line, add trimmers, or modify other processes (USDA-FSIS, 2017). Other early interventions may consist of applying bacteriophages to reduce STEC in lairage pens and hide water washes to decrease contamination with large particles, mud, and dust as cattle enter the processing plant. Microbiological testing of hides can also be implemented to determine the bacterial load of incoming cattle, and several other best practices are recommended during hide removal, especially regarding mechanical dehiding (USDA-FSIS, 2017).
Although there is evidence pointing to hides as an important source of carcass contamination, most of those studies pertain to STEC O157. Data regarding prevalence and concentration of STEC non-O157 serogroups on hides to assess the bacterial load of beef cattle upon arrival at the processing plant and the impact of season, plant, and mud scores on prevalence are still limited or inconsistent (Ekong et al., 2015; Stromberg et al., 2015; Schneider et al., 2018). Therefore, the objectives of this study were (1) to determine the prevalence and concentration of the seven major STEC serogroups (O26, O45, O103, O111, O121, O145, and O157) on hides of beef cattle carcasses collected from four Midwestern commercial beef processing plants in different seasons; and (2) to determine associations of season, processing plant, and hide cleanliness scores (mud scoring) with the prevalence and concentration of STEC on hides.
Materials and Methods
Sample collection and processing
Samples were collected from four large, commercial processing plants located in the states of Kansas, Nebraska, and Texas in the United States. Each plant was visited three times during summer (June/July 2015), fall (October/November 2015), and spring (March/April 2016) seasons.
Plants processed between 340 and 490 cattle per hour, and the source population consisted of adult fed beef cattle procured from Midwest feedlot operations (the majority being European crosses). The study sample consisted of 20 hide samples collected per visit, per plant, and per season. One hide from every ten (given the speed of carcass processing) individual beef cattle carcasses was collected, immediately postexsanguination and before hide wash and/or removal, at routine plants' chain speeds and during normal operating hours.
The hide sampling area consisted of 2730 cm2 (30 × 91 cm), ∼15 cm from the midline and from the elbow line to the umbilicus area (brisket to flank) (modified from USDA-FSIS, 2005; Noll et al., 2018; Cernicchiaro et al., 2019) (Fig. 1). Before hide sampling and immediately after carcass exsanguination, a member of the research team assigned beef cattle hides a contamination score of 0, 1, or 2 based on the presence of feces and/or mud on the ventral and lateral sides of the abdomen, from the brisket to the umbilicus, as follows: 0 if <10% of the sampling area was covered with feces or mud; 1 if 10–30% of the sampling area was covered; and 2 if >30% of the sampling area was covered with feces or mud (modified from Hauge et al., 2012). Sampling was done with Whirl-Pak® Speci-Sponges (Nasco, Fort Atkinson, WI) saturated in 35 mL of Butterfield's buffer (Hardy Diagnostics, Santa Maria, CA) with 0.1% Tween 20 (Fisher Scientific, Pittsburg, PA). Samples were collected by applying 10 two-directional strokes (five strokes per sponge side) up and down or side to side. After sample collection, the sponge was placed into the Whirl-Pak bag and its contents were manually mixed five times (modified from the study by Arthur et al., 2004).
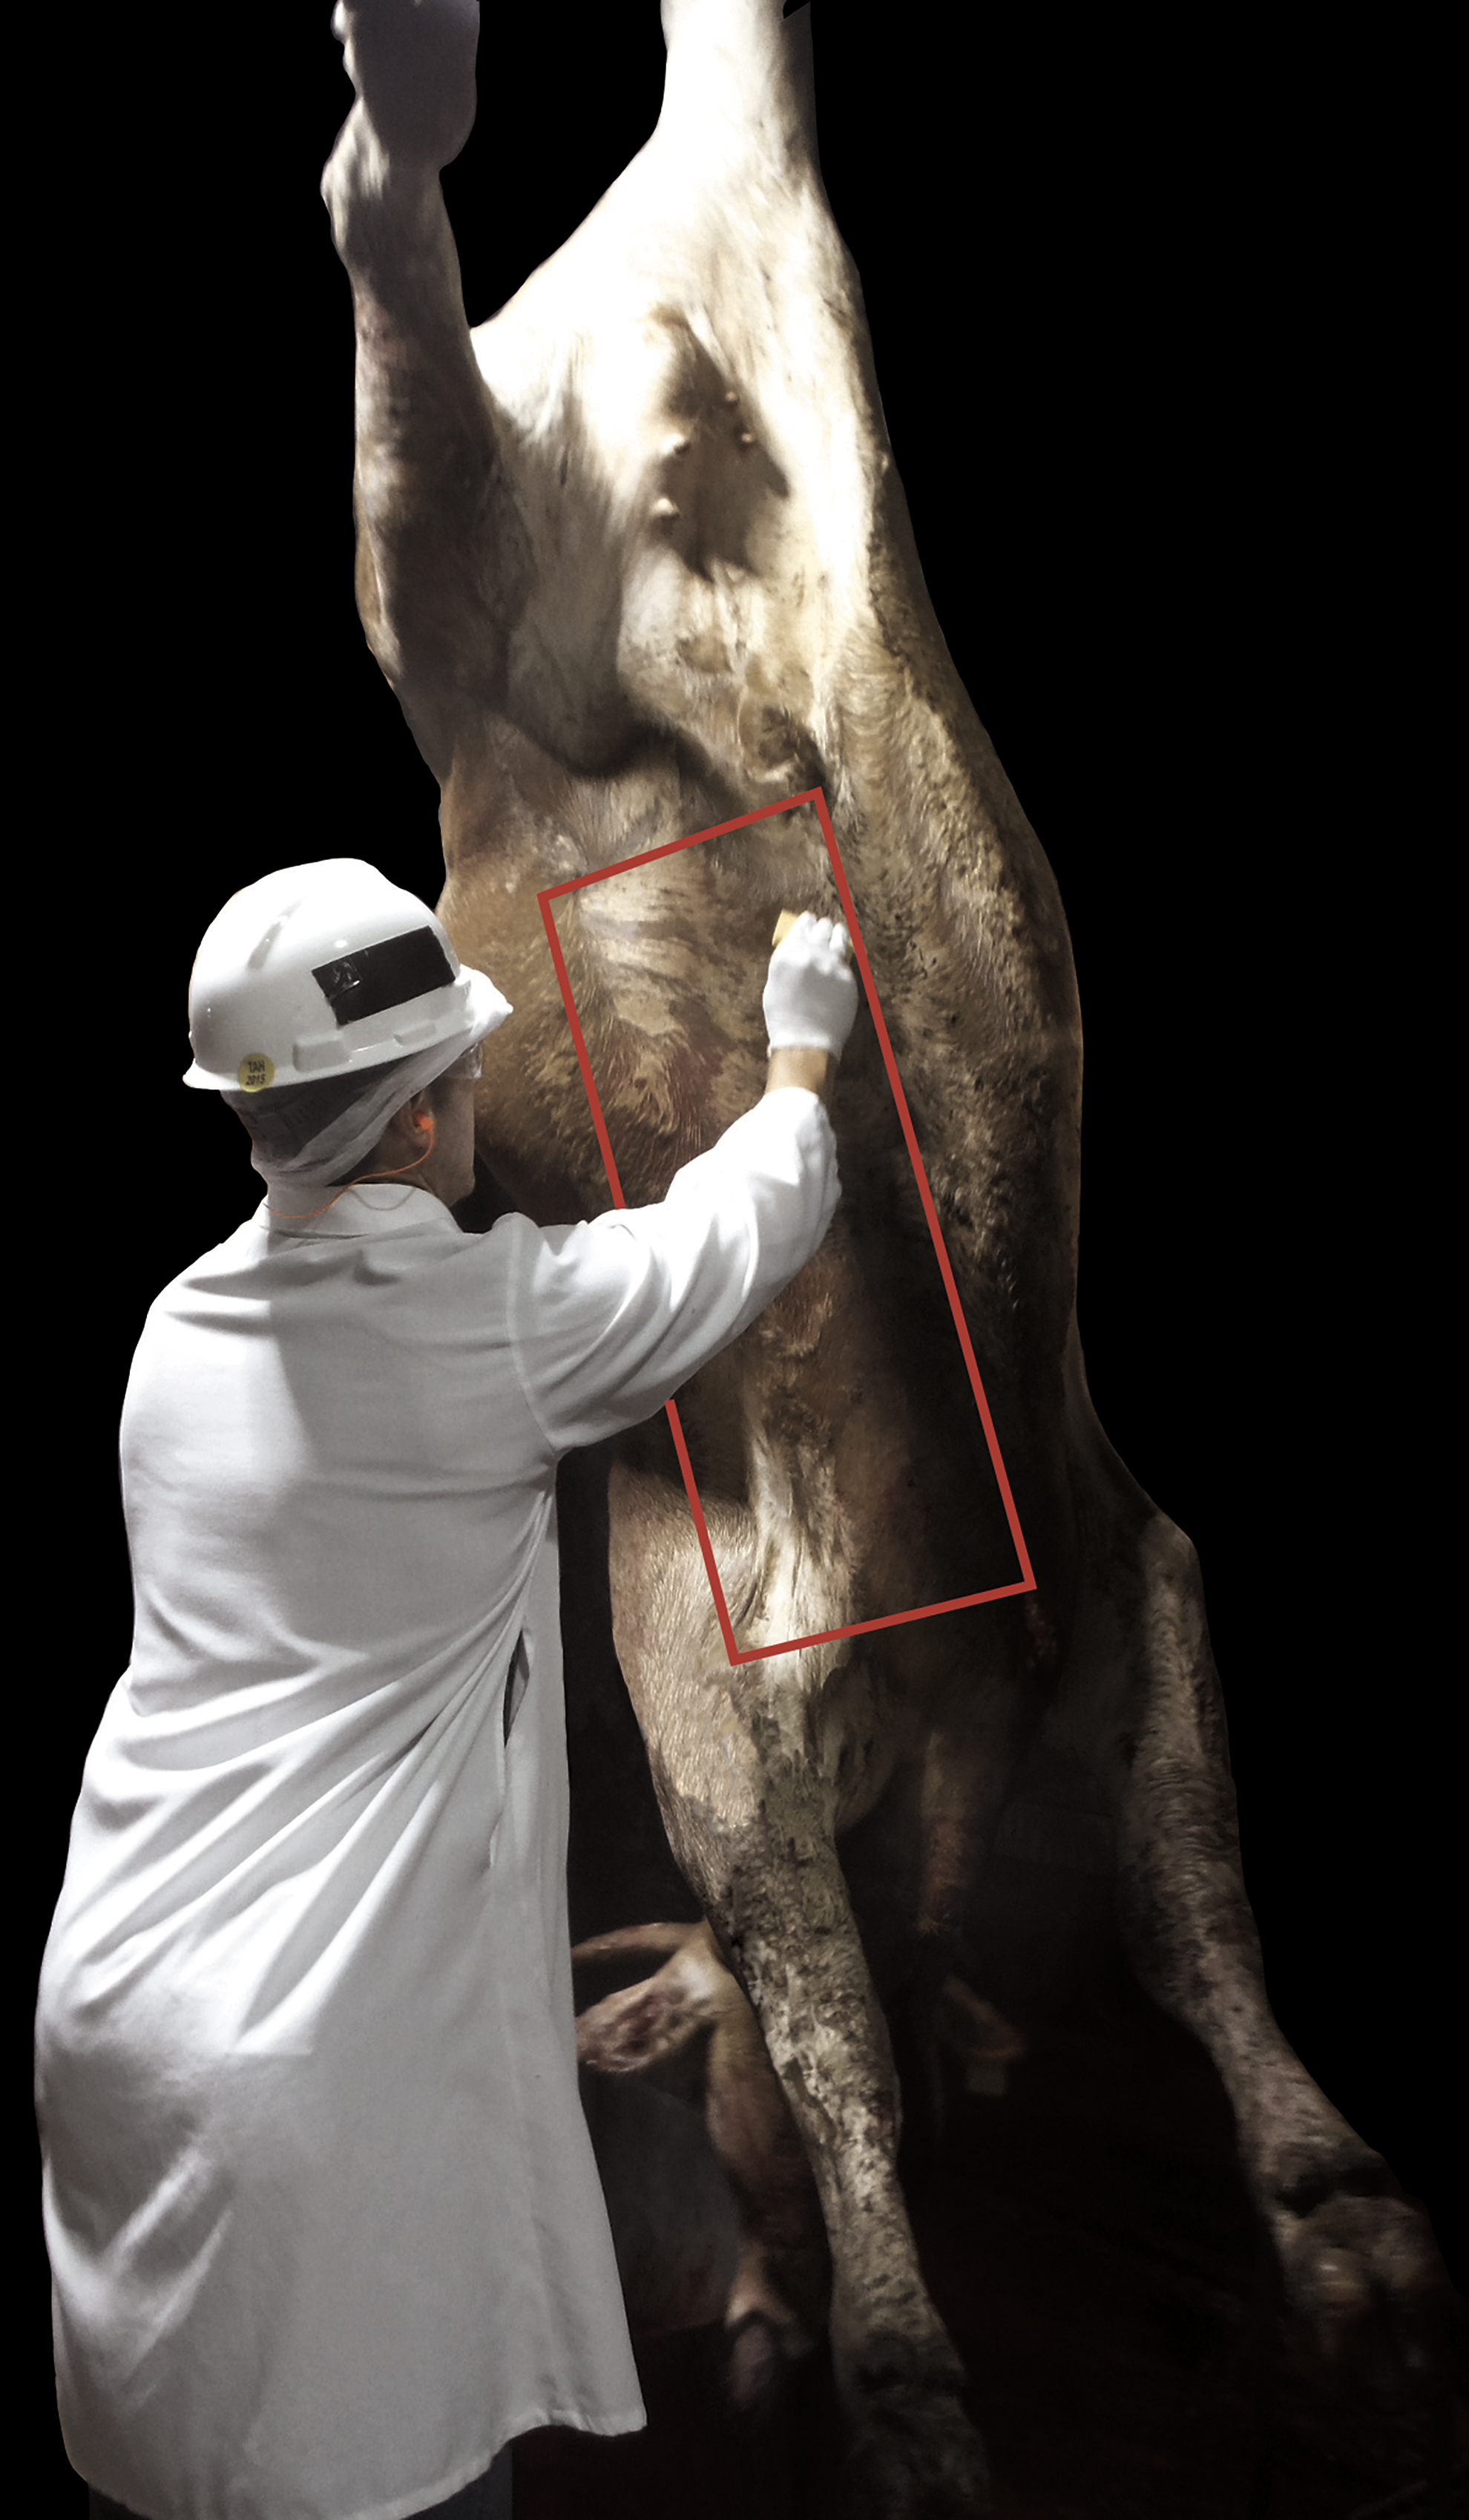
Diagram depicting hide sampling area. (Picture by Dr. Natalia Cernicchiaro, diagram courtesy of Mrs. Mal Hoover, Illustrator, College of Veterinary Medicine, Kansas State University.) Color images are available online.
Samples were refrigerated immediately after collection (placed in coolers with ice packs) and then transported to the Pre-Harvest Food Safety Laboratory at the College of Veterinary Medicine, Kansas State University, where they were kept refrigerated at 4°C until being processed within 24 h.
After homogenizing the content of the Whirl-Pak bags, sponges were discarded, and the liquid was removed using a 50-mL transfer pipette. A 10-mL aliquot of each sample was returned to the Whirl-Pak bags for enrichment, and the remaining liquid (approximately 18–19 mL) was transferred to sterile test tubes for spiral plating.
Culture-based method for detection of STEC
For enrichment, 90 mL of E. coli broth (Oxoid Ltd., Hampshire, United Kingdom) was added to each Whirl-Pak bag (containing 10 mL of sample), then squeezed and incubated at 40°C for 6 h. Postenriched samples were subjected to immunomagnetic separation (IMS) using a Kingfisher™ Flex Magnetic Particle Processor (Thermo Scientific, Waltham, MA): IMS beads for O157 (Abraxis, Warminster, PA); pooled IMS beads for O26, O45, and O111; and pooled IMS beads for O103, O121, and O145 IMS (Noll et al., 2016). For the O157 IMS treatment, 20 μL of O157 IMS beads and 980 μL of enriched sample were added to a well of a 96-well plate. For the pooled IMS beads, 20 μL of each individual IMS bead and 940 μL of the enriched sample were added to a well of a 96-well plate. After the IMS treatment, 25 μL of bead suspension was spread plated onto sorbitol-MacConkey agar supplemented with cefixime (0.5 mg/L) and potassium tellurite (2.5 mg/L; CT-SMAC; for O157) or a modified Possé (MP) agar plate (for non-O157 serogroups) (Noll et al., 2015). Plates were incubated at 37°C for 20–24 h.
Ten chromogenic colonies from MP agar plates were selected, streaked onto blood agar plates, and incubated at 37°C for 20–24 h. Isolates were then pooled and subjected to a 10-plex polymerase chain reaction (PCR) assay, targeting genes for the major serogroups and three major virulence genes, stx1, stx2, and eae, for STEC confirmation (Bai et al., 2012). Six nonsorbitol-fermenting colonies from CT-SMAC plates were selected, streaked onto blood agar plates, and incubated at 37°C for 20–24 h. Isolates were tested for O157 confirmation by latex agglutination, indole production, and a six-plex PCR (Bai et al., 2010).
Spiral plating for quantification of STEC
One milliliter of each sample (pre-enrichment) was transferred to a microcentrifuge tube for spiral plating. One hundred microliters were spiral plated (Eddy Jet Spiral Plater; IUL Instruments, Barcelona, Spain) onto an MP agar plate for non-O157 STEC enumeration. Another 100-μL aliquot was spiral plated onto CT-SMAC for STEC O157 enumeration. Plates were incubated at 37°C for 20–24 h and then enumerated using a counting grid that relates colony counts to sample volume deposited in the area (Gilchrist et al., 1973; Shridhar et al., 2017), with the range of detection limit being 2 × 10² − 4 × 10⁵ colony-forming units (CFUs)/mL (IUL, S.A., 2012) (Eddy Jet 2 User's Guide V. 1.0., Barcelona, Spain). Verification of STEC was performed by PCR methods, as described in the previous section.
Statistical analyses
All statistical analyses were performed in Stata 12 (StataCorp LP, College Station, TX). A sample was considered STEC positive if for a specific O serogroup, stx1 and/or stx2 virulence genes were detected in at least one sample isolate by culture methods. The percent of positive samples consisted of the number of hide-on samples that tested positive for each of the seven STEC serogroups by culture methods divided by the total number of samples collected per season and per plant. Mean, median, standard deviation, and minimum and maximum concentration of STEC colonies on enumerable plates (plates with at least one visible colony) from hide samples, in log10 CFU/100 cm2, were summarized per study season and per plant. Distribution of hide cleanliness scores by STEC O group, season, and processing plant is presented in frequency tables.
Associations between risk factors of interest (season, plant, and hide cleanliness score) and the prevalence of STEC-7 serogroups were estimated using multilevel, mixed-effect logistic regression models with a binary distribution, logit link, and adaptive quadrature estimation (xtmelogit command in Stata 12). Dependent variables consisted of test results at the sample level for each STEC O group (modeled as presence/absence [1/0]). Separate models were run for each of the seven STEC serogroups if the effective sample size allowed it. Independent variables tested included season (modeled as a categorical variable: summer, fall, and spring), processing plant (categorical: plants 1–4), and hide cleanliness score (categorical: 0–2). Two types of models were built: (1) Univariable models: to determine associations of season and plant as fixed effects, in separate models, with the prevalence of each STEC O serogroup. To account for the hierarchical structure of the study, random intercepts for pen and sampling week were incorporated, except when plant was evaluated as a fixed effect (in that case, sampling week was incorporated as the random intercept). (2) Multivariable models: to determine associations of hide cleanliness scores with hide-on prevalence of STEC O157 after accounting for season as a confounding variable. This model included the prevalence of STEC O157 as an outcome, hide scores and season as fixed effects, and random intercepts for plant and week of sampling. Due to the small, effective sample size, only univariable models were fitted for STEC O26 and O103 prevalence outcomes (n = 12 and 21, respectively) and only main effects, but no interaction terms, were fitted in the multivariable model for STEC O157.
Unconditional associations of season, plant, and hide cleanliness scores with the concentration of STEC O157 (in log10 CFU/100 cm2) were evaluated using multilevel, mixed-effect linear regression models with a Gaussian distribution, identity link, and restricted maximum likelihood (xtmixed command in Stata 12). Models were built as described above.
Residual diagnostics consisted of the graphical evaluation of the distribution of the best, linear unbiased prediction for the plant and sampling week random intercepts. In addition, standardized and delta deviance residuals at the sample level were graphically evaluated to identify potential outlier and influential observations. Associations were considered statistically significant at p < 0.05. Model-adjusted mean prevalence, or mean concentrations, and their 95% confidence intervals (CIs) were computed, and Bonferroni adjustments were used to correct p-values for multiple comparisons.
Results
Prevalence of STEC and associated risk factors
Of the 720 hide samples, 117 (16.3%) tested positive for at least one of the STEC O serogroups. Overall number and percent of positive samples, as well as model-adjusted mean prevalence for each STEC serogroup, by season and by processing plant, are presented in Tables 1 –3. No hide samples tested positive for STEC O111 or O121. E. coli O157 was the most predominant STEC serogroup detected (10.8%), followed by O103 (2.9%) and O26 (1.7%). Most of these STEC-positive samples also harbored the intimin (eae) gene (Supplementary Table S1).
Number and Percent of Test-Positive Cattle Hide Surface Samples (Total Tested = 720) and Model-Adjusted Mean Prevalence, and Their Corresponding 95% Confidence Intervals, of Shiga Toxin–Producing Escherichia coli Serogroups
From intercept-only, multilevel logistic regression models.
CI, confidence interval; STEC, Shiga toxin–producing E. coli.
Number and Percent of Test-Positive Samples and Model-Adjusted Mean Prevalence of Shiga Toxin–Producing Escherichia coli Serogroups on Cattle Hide Surface Samples, as Determined by Culture-Based Methods, by Sampling Season
240 Hide-on samples were collected in each season for a total of 720 samples.
Indicates that STEC prevalence varied significantly (p < 0.05) by season.
Different superscripts indicate a significant difference between model-adjusted mean prevalence between seasons within the STEC serogroup.
Number and Percent of Test-Positive Samples and Model-Adjusted Mean Prevalence of Shiga Toxin–Producing Escherichia coli Serogroups on Cattle Hide Surface Samples, as Determined by Culture-Based Methods, by Processing Plant
180 Samples were collected from each plant for a total of 720 samples.
Indicates that STEC prevalence varied significantly (p < 0.05) by processing plant.
Different superscripts indicate a significant difference between model-adjusted mean prevalence between plants within the STEC serogroup.
Season was significantly associated with hide prevalence of STEC O103 (p < 0.01) and STEC O157 (p < 0.01) (Table 2). For STEC O103, the highest prevalence was detected in spring, followed by summer and fall (Table 2). For STEC O157, the highest prevalence was observed in summer, being ∼4.5 times greater compared with the prevalence observed in the spring or fall season (Table 2). Hide prevalence of STEC O26 tended to vary by season (p = 0.07).
The prevalence of STEC O103 (p = 0.01) and O157 (p < 0.01) varied significantly by processing plant (Table 3). Plant was not significantly associated with prevalence of STEC O26 (p = 0.23).
The most common hide sample score (47.8%) was 1, followed by 38.6% of hides that were scored as 0 and 13.6% that were scored as 2 (Tables 4 –6). The distribution of hide cleanliness scores by season and plant is presented in Tables 5 and 6. In the unconditional analysis, the hide cleanliness score was not significantly associated (p = 0.13) with mean prevalence of STEC O103 (the confounding effect of season or processing plant could not be evaluated given the small sample size). In contrast, the cleanliness score was significantly associated with the prevalence of STEC O157 (p < 0.01) after controlling for the confounding effect of season (p < 0.01). Hides assigned a score of 1 or 2 had a significantly higher mean prevalence of STEC O157 (12.3% and 11.6%, respectively) compared with hides assigned a score of 0 (4.9%), after controlling for season of sampling (Table 7).
Number and Percentage of Test-Positive Samples for Each Shiga Toxin–Producing Escherichia coli O Group by Hide Cleanliness Score
Distribution of Hide Cleanliness Scores by Season
Distribution of Hide Cleanliness Scores by Processing Plant
Associations of Hide Cleanliness Scores and Season with Mean Prevalence of Shiga Toxin–Producing Escherichia coli O157 on Hides
From the multivariable model estimating associations of hide cleanliness scores and season with prevalence of STEC O157, accounting for plant and week of sampling as random intercepts.
Overall p-value (Wald chi-square test).
p-Values adjusted for multiple comparisons (Bonferroni).
Further analysis of our data indicated that the presence of STEC O26 and of STEC O103 was significantly associated with the mean prevalence of STEC O157 in hides (Supplementary Table S2).
Concentration of STEC and associated risk factors
None of the hide samples were enumerable for non-O157 STEC. However, for STEC O157, over the 3 seasons, there were 28 enumerable samples (3.9%; 28/720) (Table 8).
Mean Concentration of Shiga Toxin–Producing Escherichia coli O157 Among Enumerable Samples (n = 28) by Season, Plant, and Hide Cleanliness Score
Among enumerable samples.
12 Samples were not assigned a hide score.
Different superscripts indicate a significant difference between model-adjusted mean concentration of STEC O157 and each variable (p < 0.05).
CFU, colony-forming unit; n, number of enumerable samples; SD, standard deviation.
Mean concentration of STEC O157 significantly varied by season (p < 0.01), with concentration being significantly higher in summer compared with fall (p < 0.01) and spring (p = 0.03). Mean concentration of STEC O157 significantly varied by plant (p = 0.02), being significantly higher in plant 1 compared with plant 2 (p < 0.01). Hide cleanliness scores were not significantly associated (p = 0.32) with mean concentration of STEC O157.
Discussion
Season (summer), processing plant, >10% of hide surface covered in mud or feces, and the presence of STEC O103 or STEC 26 on hide samples were significantly associated with higher hide-on prevalence of STEC O157, the predominant serogroup in this study. Similarly, a subset (∼4%) of samples was enumerable for STEC O157, with concentration differing by plant and season of sampling. Within non-O157 groups, although at low prevalence, STEC O103 and O26 were the most commonly detected, with O103 also significantly varying by season (spring) and by plant.
Hides are an important source of fecal bacterial contamination of carcasses during cattle processing (Reid et al., 2002; Barkocy-Gallagher et al., 2003; Nou et al., 2003; Bosilevac et al., 2005). Monitoring the prevalence and concentration of STEC on hides and throughout the slaughter process is critical to assess the efficacy of in-plant interventions for controlling STEC and other foodborne pathogens (Arthur et al., 2004; USDA-FSIS, 2017). Arthur et al. (2009) reported an association between fecal shedding in cattle and contamination of hides, suggesting that a reduction of E. coli prevalence in feces and a reduction of the levels of shedding below a certain threshold (200 CFU/g) were important to prevent and control cross-contamination of hides.
In the present study, cumulative model-adjusted prevalence of STEC non-O157 and O157 on beef cattle hides was lower than previously reported, ranging from 0.1% for O45 and O145 and 0.2% for O103 to 0.3% for O26 and 3.1% for O157. Using similar culture procedures for isolation of STEC non-O157, Stromberg et al. (2015) and Noll et al. (2018) also found very low prevalence (0 to 6.8%) of all STEC-7 serogroups on hides of fed cattle. Potential reasons for the low prevalence of STEC non-O157 on hides include potential misclassification of test results based on the sensitivity of the sampling procedures and diagnostic tests used as well as the effectiveness of hide interventions employed at the processing plant. Epidemiological studies play a significant role in the assessment of risks and risk factors associated with environmental pathogens and for informing regulatory standards and policy. Specifically, consistency of findings across studies is central for accurate estimation, evaluating the body of evidence, informing risk assessment, and supporting causal inference. Although limited, data on prevalence and risk factors for STEC serogroups on hides in beef processing plants are highly heterogeneous, with prevalence estimates ranging from 0% (by culture-dependent methods) to 74.5% for STEC non-O157 (by the culture-independent NeoSEEK® method) (Stromberg et al., 2015, 2016; Noll et al., 2018; Schneider et al., 2018) and a pooled prevalence estimate of 56.4% for STEC O157 (95% CI: 48.6–64.1%; obtained from 16 publications) (Ekong et al., 2015). Differences in factors such as management practices, diet and animal type, laboratory methodologies, sampling period, study design, geographical location, and plant interventions may explain the observed heterogeneity and discrepancies between the results reported in other studies and the data presented in the current study.
Fecal shedding of STEC in cattle, specifically of O157, has been linked to warmer months (Hussein, 2007; Williams et al., 2010; Lal et al., 2012; Ekong et al., 2015). The length of daylight and temperature have been suggested as possible factors associated with the growth and survival of E. coli in the cattle environment, which could explain increased exposure, and therefore shedding, in cattle (McClure and Hall, 2000; Edrington et al., 2006; Ekong et al., 2015). Other studies point to no association or association between seasons other than summer with higher STEC prevalence on hides. Brichta-Harhay et al. (2008) reported no significant association between season and prevalence, whereas Schneider et al. (2018) reported higher prevalence of enterohemorrhagic E. coli (EHEC) O145 on hides of cattle during winter, O26 during fall, and O103 and O121 during spring. In the present study, among non-O157 STEC, only the prevalence of STEC O103 significantly varied by season, peaking during spring months. In a previous study, O103 was the most prevalent STEC serogroup isolated in feces of preslaughter feedlot cattle during summer months. Notably, the O103 serogroup, without Shiga toxin or intimin genes, was also detected in individual fecal samples (41%) and in all study pens (17–92%) during the winter months (Dewsbury et al., 2015). Whether the O103 serogroup can survive tougher environmental conditions such as the ones observed in winter or spring months, or displace other organisms and potentially acquire virulence genes, is not known and warrants further investigation. Collecting information on weather variables such as rainfall and temperature may provide additional metrics for predicting spikes in shedding, prompting the application of additional mitigation steps.
In certain seasons, when husbandry practices and environmental factors differ and are favorable for bacterial growth or survival, cattle may have higher mud scores than in other seasons. In previous studies, and likely because animals included are from different production systems, an association between hide cleanliness scores and prevalence of pathogenic bacteria has not been consistently reported (van Donkersgoed et al., 1997; Brown, 2000; Keen and Elder, 2002; Smith et al., 2005; Nastasijevic et al., 2007; Antic et al., 2010; Blagojevic et al., 2012; Schneider et al., 2018). In this study, we found that after accounting for season, hides with scores 1 and 2 were associated with significantly higher prevalence of STEC O157 than hides with score 0. Although subjective in nature, hide cleanliness scores (contamination metric) can be taken into account when considering modifying or supplementing production processes (USDA-FSIS, 2017). Among the plants evaluated in this study, the implementation and frequency of application of interventions depended upon the plants' management practices as well as the season, with additional interventions (i.e., spraying bacteriophage targeting E. coli in holding pens and rinsing hides with high-pressure water upon entry to the processing facility and after knocking) being more likely to be employed during warmer months (March to October). Although we could not concurrently test the association of season and plant (via an interaction term) with prevalence of STEC serogroups due to the small number of positives obtained, the prevalence of STEC O157 and O103 on hides did significantly vary by processing plant, which may be related to differences in plant management (e.g., infrastructure, standard operating procedures, hygiene, employee practices, and interventions) as well as the region of origin of beef cattle (representing differences in husbandry practices and diet, among others).
The nondetection of enumerable (concentration testing) samples for STEC non-O157 is probably due to low prevalence, below the detection limit of the procedure. On the contrary, and in accordance with results of previous studies, we did quantify STEC O157, with the highest concentration being observed during the summer sampling (Barkocy-Gallagher et al., 2003; Schneider et al., 2018).
Conclusions
This study points to a higher hide-on prevalence of STEC O157 in summer and of STEC non-O157 (specifically of STEC O103) in spring months. It is important, however, to note that none of the hide samples were enumerable for non-O157 STEC. Across seasons and plants, the presence of the most common STEC non-O157 serogroups in this study (O26 and O103) was associated with a higher prevalence of STEC O157. Given the challenges of sampling, testing, and monitoring non-O157 STEC on hides within plants, preharvest interventions targeting reduction of O157 on hides could be useful in reducing overall STEC contamination pressure at the plant. Nonetheless, plants could benefit from extending the application of interventions against STEC beyond summer and into fall and spring months when hide-on prevalence of STEC non-O157 is higher.
Footnotes
Acknowledgments
The authors thank STEC Coordinated Agricultural Program (CAP) interns (Hannah Seger, Justin Ludwig, Christine Bartley, and Carlee Wollard), veterinary research scholar program (VRSP) students (John Brandsma and Austin Pauly), student workers (Antoinette Lona, Alison Cioffi, and Amanda Katherns), graduate students (Charley Cull and Aurelio Cabezas), Dr. Christy Hanthorn, and laboratory technicians (Xiaorong Shi, Neil Wallace, and Leigh Ann Feuerbacher) for their help and technical assistance. The authors also thank collaborators and students at West Texas A&M University for assisting with the sample collection and processing plants for allowing them to collect samples at their facilities.
Disclosure Statement
The authors declare no conflicts of interest.
Funding Information
This research was supported by the Agriculture and Food Research Initiative STEC CAP Grant (number 2012-68003-30155) from the United States Department of Agriculture National Institute of Food and Agriculture (USDA NIFA) and the College of Veterinary Medicine at Kansas State University.
Supplementary Material
Supplementary Table S1
Supplementary Table S2
References
Supplementary Material
Please find the following supplemental material available below.
For Open Access articles published under a Creative Commons License, all supplemental material carries the same license as the article it is associated with.
For non-Open Access articles published, all supplemental material carries a non-exclusive license, and permission requests for re-use of supplemental material or any part of supplemental material shall be sent directly to the copyright owner as specified in the copyright notice associated with the article.