




Abstract
Tylosin phosphate (TYL) is administered to more than 50% of U.S. beef cattle to reduce the incidence of liver abscesses but may increase the risk of macrolide–lincosamide–streptogramin-resistant bacteria disseminating from the feedlot. Limited evidence has been collected to understand how TYL affects the proportion of resistant bacteria in cattle or the feedlot environment. We created a mathematical model to investigate the effects of TYL administration on Enterococcus dynamics and examined preharvest strategies to mitigate the impact of TYL administration on resistance. The model simulated the physiological pharmacokinetics of orally administered TYL and estimated the pharmacodynamic effects of TYL on populations of resistant and susceptible Enterococcus within the cattle large intestine, feedlot pen, water trough, and feed bunk. The model parameters' population distributions were based on the available literature; 1000 Monte Carlo simulations were performed to estimate the likely distribution of outcomes. At the end of the simulated treatment period, the median estimated proportion of macrolide-resistant enterococci was only 1 percentage point higher within treated cattle compared with cattle not fed TYL, in part because the TYL concentrations in the large intestine were substantially lower than the enterococci minimum inhibitory concentrations. However, 25% of the simulated cattle had a >10 percentage point increase in the proportion of resistant enterococci associated with TYL administration, termed the TYL effect. The model predicts withdrawing TYL treatment and moving cattle to an antimicrobial-free terminal pen with a low prevalence of resistant environmental enterococci for as few as 6 days could reduce the TYL effect by up to 14 percentage points. Additional investigation of the importance of this subset of cattle to the overall risk of resistance transmission from feedlots will aid in the interpretation and implementation of resistance mitigation strategies.
Introduction
Antimicrobial use in livestock can increase the prevalence of resistant bacteria in their gastrointestinal tract that can then be transferred to humans through contaminated meat and dairy products (Marshall and Levy, 2011), direct contact, or environmental pathways. Macrolides are categorized as a highest priority critically important antimicrobial for human health by the WHO (2016). Tylosin phosphate (TYL), a macrolide, is commonly used in the U.S. beef industry to reduce the incidence of liver abscesses (NAHMS, 2019) and selects for macrolide resistance in commensal Enterococcus species (Jacob et al., 2008; Zaheer et al., 2013; Amachawadi et al., 2015; Beukers et al., 2015), which are indicators of Gram-positive bacterial resistance burden (Karp et al., 2017). Tylosin may also enhance the spread of resistance genes to other enteric bacteria (Hoelzer et al., 2017).
Strategies to reduce macrolide-resistant bacteria in cattle must be feasible for animal welfare and producer economics since tylosin is the predominant means of reducing the incidence of liver abscesses (Amachawadi and Nagaraja, 2016). Extended withdrawal periods after antimicrobial administration in cattle decrease the prevalence of some resistant bacteria and resistance genes in the host's gastrointestinal tract (Beukers et al., 2015; Cazer et al., 2017). No withdrawal time is required after TYL administration because there are no detectible TYL residues in carcasses (FDA, 1976). Enteric bacteria and antimicrobial residues can persist in manure and the pen environment after an antimicrobial is withdrawn (Pruden et al., 2013). Moving cattle to “antimicrobial-free” pens during their withdrawal periods could decrease transmission of pen bacteria and residues to cattle. Additionally, direct-fed microbials consisting of susceptible bacteria could be administered to occupy resources in the gastrointestinal tract and thus preclude expansion of resistant bacterial populations (Franz et al., 2011; Murray et al., 2019).
Studies that have measured the effect of oral TYL on macrolide-resistant enterococci in beef cattle sometimes included other feed additives in the TYL diets (Molitoris et al., 1986; Jacob et al., 2008; Amachawadi et al., 2015), observed increased prevalence of resistant enterococci before ceasing TYL administration (Beukers et al., 2015), observed intermittent differences between the TYL and control groups (Schmidt et al., 2020), or observed no effect of TYL treatment on macrolide-resistant enterococci (Müller et al., 2018). A recent systematic review and meta-analysis found substantial statistical heterogeneity in estimates of TYL's effect on macrolide-resistant enterococci and the potential for publication bias and underreporting of studies that find no effect of TYL (Cazer et al., 2020). Additionally, Schmidt et al.'s (2020) study was published after this systematic review. A mathematical model is well suited to incorporate this population-level variability in cattle and feedlot characteristics and utilize all available data to assess interventions meant to reduce the risk of resistance dissemination.
We modeled the impact of potential interventions on enteric macrolide-resistant enterococci in cattle using population-level parameter distributions to account for variability in cattle and feedlots. Our objectives were to estimate the effect of TYL on Enterococcus populations and to assess the ability of the following interventions to mitigate the TYL effect: (1) a resistance withdrawal period between TYL administration and shipping cattle for slaughter, (2) antimicrobial-free terminal pens, and (3) administering direct-fed microbial probiotics consisting of pan-susceptible Enterococcus species during TYL administration.
Materials and Methods
Model design
Our ordinary differential equation model (represented schematically in Fig. 1) simulates the influence of oral TYL on the dynamics of macrolide-susceptible and macrolide-resistant subpopulations of generic enteric enterococci. Three submodels were combined and parameterized for this purpose: (1) a pharmacokinetic model to determine the concentration of TYL reaching commensal bacteria within the large intestine (Cazer et al., 2014; Volkova et al., 2017), (2) a pharmacodynamic model to simulate the effect of TYL on the growth of susceptible and resistant Enterococcus populations (Volkova et al., 2016; Cazer et al., 2017), and (3) a bacterial metapopulation dynamics model incorporating bacterial growth within and movement between cattle host, water trough, feed bunk, and pen environment (Ayscue et al., 2009).

Metapopulation model schematic. TYL moves through the cattle body compartments (dashed arrows), and enterococci subpopulations can transfer from one compartment of the model to the next (solid arrows). The dashed box within the cattle compartment represents the carrying capacity of enterococci in the large intestine. TYL, tylosin phosphate.
One model simulation represents treating one pen of animals and the resultant changes to the Enterococcus subpopulations. Equations for each submodel are included in Tables 1 and 2 and parameters are defined in Tables 3 –5. The model was parameterized using data from the literature whenever possible; parameterization and model structure are described in detail in the Supplementary Materials (Supplementary Model Structure, Supplementary Model Parameterization, Supplementary Table 1). Briefly, TYL is administered orally at the labeled dose of 90 mg per head per day (Elanco US, Inc., 2020) for 143 days (NAHMS, 2013). TYL moves through the gastrointestinal tract, undergoes biotic and abiotic degradation, and is assumed to not be absorbed from the gastrointestinal tract in appreciable amounts (FDA, 1976; Lewicki, 2006). The impact of TYL on the growth of enterococci was estimated with a sigmoid E max model; susceptible enterococci were assumed to be more sensitive to sub-Minimum Inhibitory Concentration (MIC) TYL concentrations than resistant enterococci. Enterococci from cattle feces entered the pen environment and, from the pen environment, could contaminate water troughs and feed bunks.
Tylosin Phosphate Pharmacokinetic and Pharmacodynamic Model Equations
j, enterococci either R (resistant) or S (susceptible) populations.
bw, body weight.
Enterococci Metapopulation Model Equations
M to N, enterococci move from niche (P, C, W, or F) to niche N (P, C, W, or F).
CFU, colony-forming unit.
Tylosin Phosphate Pharmacokinetic Model Parameters and Distributions
Realized range gives the minimum, median, and maximum rounded to two significant digits. Truncate gives the minimum and maximum allowed values.
Tylosin Phosphate Pharmacodynamic Model Parameters and Distributions
Realized range gives the minimum, median, and maximum rounded to two significant digits. Truncate gives the minimum and maximum allowed values.
Enterococcus Metapopulation Model Parameters and Distributions
Realized range gives the minimum, median, and maximum rounded to two significant digits. Weibull distribution lists shape followed by scale. Beta distribution lists shape 1 followed by shape 2. Truncate gives the minimum and maximum allowed values. M niche refers to C (cattle host), W (water trough), F (feed bunk), or P (pen environment). j refers to S (susceptible) or R (resistant) Enterococcus subpopulations.
Model implementation
The model differential equations were implemented in MatLab® R2019a (MathWorks, Natick, MA) using a timestep of 0.1 h. The model was allowed to reach an approximate equilibrium in the concentration of enterococci in the cattle compartment before the simulated experiments were initiated. We investigated the degree to which each of the following scenarios diminished or reversed the TYL effect (i.e., the change in the proportion of resistant enterococci in cattle attributable to TYL administration): (1) no interventions (NI), (2) a 30-day resistance withdrawal time (RWT), (3) moving cattle to antimicrobial-free “terminal” pens for 30 days before slaughter while withholding TYL (AFTP), or (4) providing direct-fed pan-susceptible Enterococcus throughout the treatment period (DFM). Control (CON) scenarios, without TYL administration, were also run for each scenario. One thousand simulations representing 1000 pens of cattle were run for each of these scenarios. Comparisons (Table 6) were made to isolate the effect of TYL and the effect of each intervention on the proportion of resistant enterococci. The impact of each intervention on baseline enterococci populations was determined by comparing intervention with NI scenarios for both the TYL (e.g., TYL_AFTP vs. TYL_NI; Table 6, #1–3) and CON groups (e.g., CON_AFTP vs. CON_NI; Table 6, #4–6). The effect of TYL was determined by comparing a TYL scenario with the counterfactual CON scenario, with all parameters equal except for the feeding of TYL (Table 6, #7–9). The TYL effect under intervention scenarios was contrasted to the baseline TYL effect (i.e., TYL_NI vs. CON_NI) to assess the ability of each intervention to minimize the TYL effect. An ideal intervention would drive the TYL effect to 0 by the end of the feeding period.
Analytical Comparisons to Isolate the Effect of Tylosin Phosphate and the Effect of Each Intervention on the Proportion of Resistant Enterococci
The total simulation time was the same across all scenarios; hence, the TYL duration of administration in the RWT and AFTP scenarios was 113 days. The withdrawal duration (30 days) was selected based on simulated withdrawal periods for infeed chlortetracycline- and tetracycline-resistant Escherichia coli (Cazer et al., 2017). We simulated AFTP by eliminating the resistant enterococci within the pen environment at day 113 at the same time as TYL withdrawal to approximate cattle being moved to a new environment uncontaminated with resistant bacteria from previous antimicrobial use. DFM was incorporated into the model by limiting the total carrying capacity of bacteria within the cattle compartment (Volkova et al., 2013); the DFM bacteria were not counted among the modeled enterococci.
The model was validated by comparing the simulated effect of TYL on the proportion of resistant enterococci (TYL-NI vs. CON-NI simulations) with the TYL effect identified in five TYL feeding trials (Fig. 2). Data from one feeding trial CON group and pretreatment TYL group were used to parameterize the cattle enterococci carrying capacity (Schmidt et al., 2020). Four feeding trials (Zaheer et al., 2013; Beukers et al., 2015; Müller et al., 2018; Schmidt et al., 2020) reported pretreatment (day 0) proportions of resistant enterococci for the CON and TYL groups. Therefore, the comparison to these four feeding trials is an internal validation, and the remaining feeding trial is an external validation (Jacob et al., 2008).
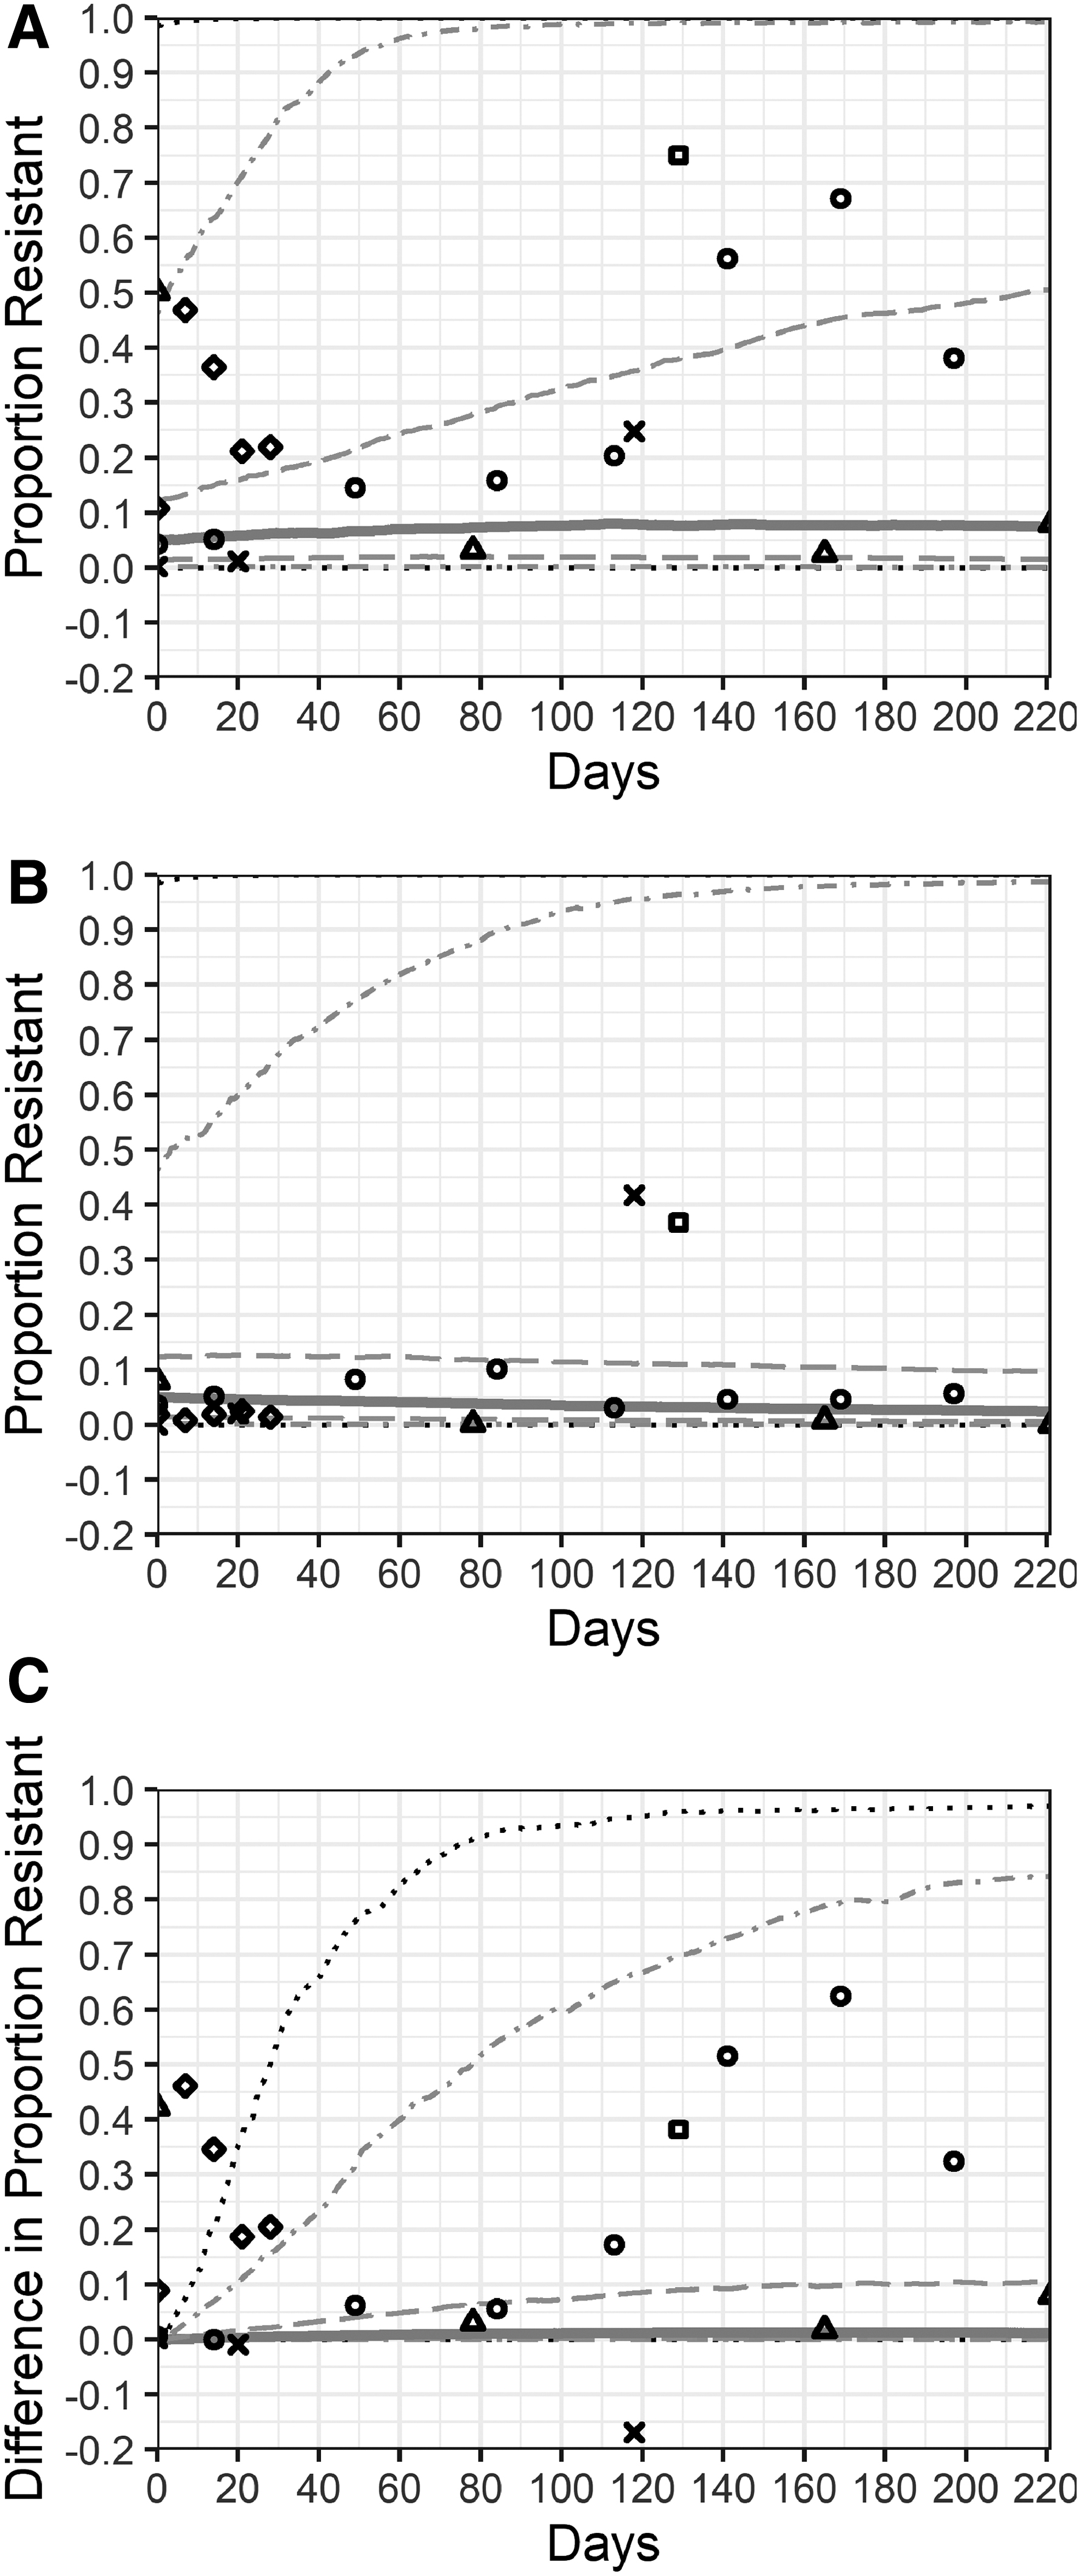
Resistant enterococci in the cattle large intestine from mathematical model and five tylosin feeding trials. The distribution of the proportion of resistant enterococci cattle from pens fed tylosin
Descriptive statistics and figures were produced with R (version 3.6.1; R Core Team, 2017); Figure 1 was created with Microsoft® PowerPoint® (Microsoft Corporation, Alpharetta, GA). A sensitivity analysis was performed using the Kendall correlation coefficients and the Benjamini–Hochberg procedure to limit the false discovery rate to 5%. All codes required to reproduce this analysis are available at DOI: 10.5281/zenodo.3724910.
Results
Model validation
The simulated proportions of resistant enteric enterococci were compared with the results from five TYL feeding trials (Fig. 2). Approximately half of the TYL group observations in these feeding trials and 70% of the CON group observations fall within the 25th to 75th percentiles of the simulated NI pen; nearly all the feeding trial observations fall within the 5th to 95th percentile range (Fig. 2A, B). Fewer feeding trial observations agree with the difference in proportion resistant between the simulated TYL_NI and CON_NI groups; ∼50% fall within the 5th to 95th percentile range (Fig. 2C). The study (Zaheer et al., 2013) with an atypical feedlot environment (individual-pens and short-duration TYL exposure) drives this difference between the model simulations and feeding trial observations. The result of the feeding trial not used in model parameterization (Jacob et al., 2008) falls in the 90th percentile of differences between the TYL_NI and CON_NI groups.
TYL and interventions
The concentration of TYL in the cattle large intestine ranged from a median peak of 0.6 μg/mL at the beginning of treatment to 0.4 μg/mL at the end of the treatment period (Fig. 3). When TYL was fed for 143 days with no intervention (TYL_NI), 38% of simulated pens of TYL-treated cattle had a decrease in the proportion of resistant enterococci in the large intestine over the feeding period, with a maximum decrease of 15 percentage points. In control pens with no intervention (CON_NI), 81% had a decrease in the proportion resistant (up to 21 percentage points). Thirty-two percent of the TYL pens had a minimal increase (<10 percentage points), 16% experienced moderate increase (10–50 percentage points), and 14% had a substantial increase (>50 percentage points) in the proportion of resistant enteric enterococci over time (Fig. 2A). In simulated CON pens, 9% had a minimal increase, 6% had a moderate increase, and 4% had a substantial increase in the proportion of resistant enterococci (Fig. 2B).
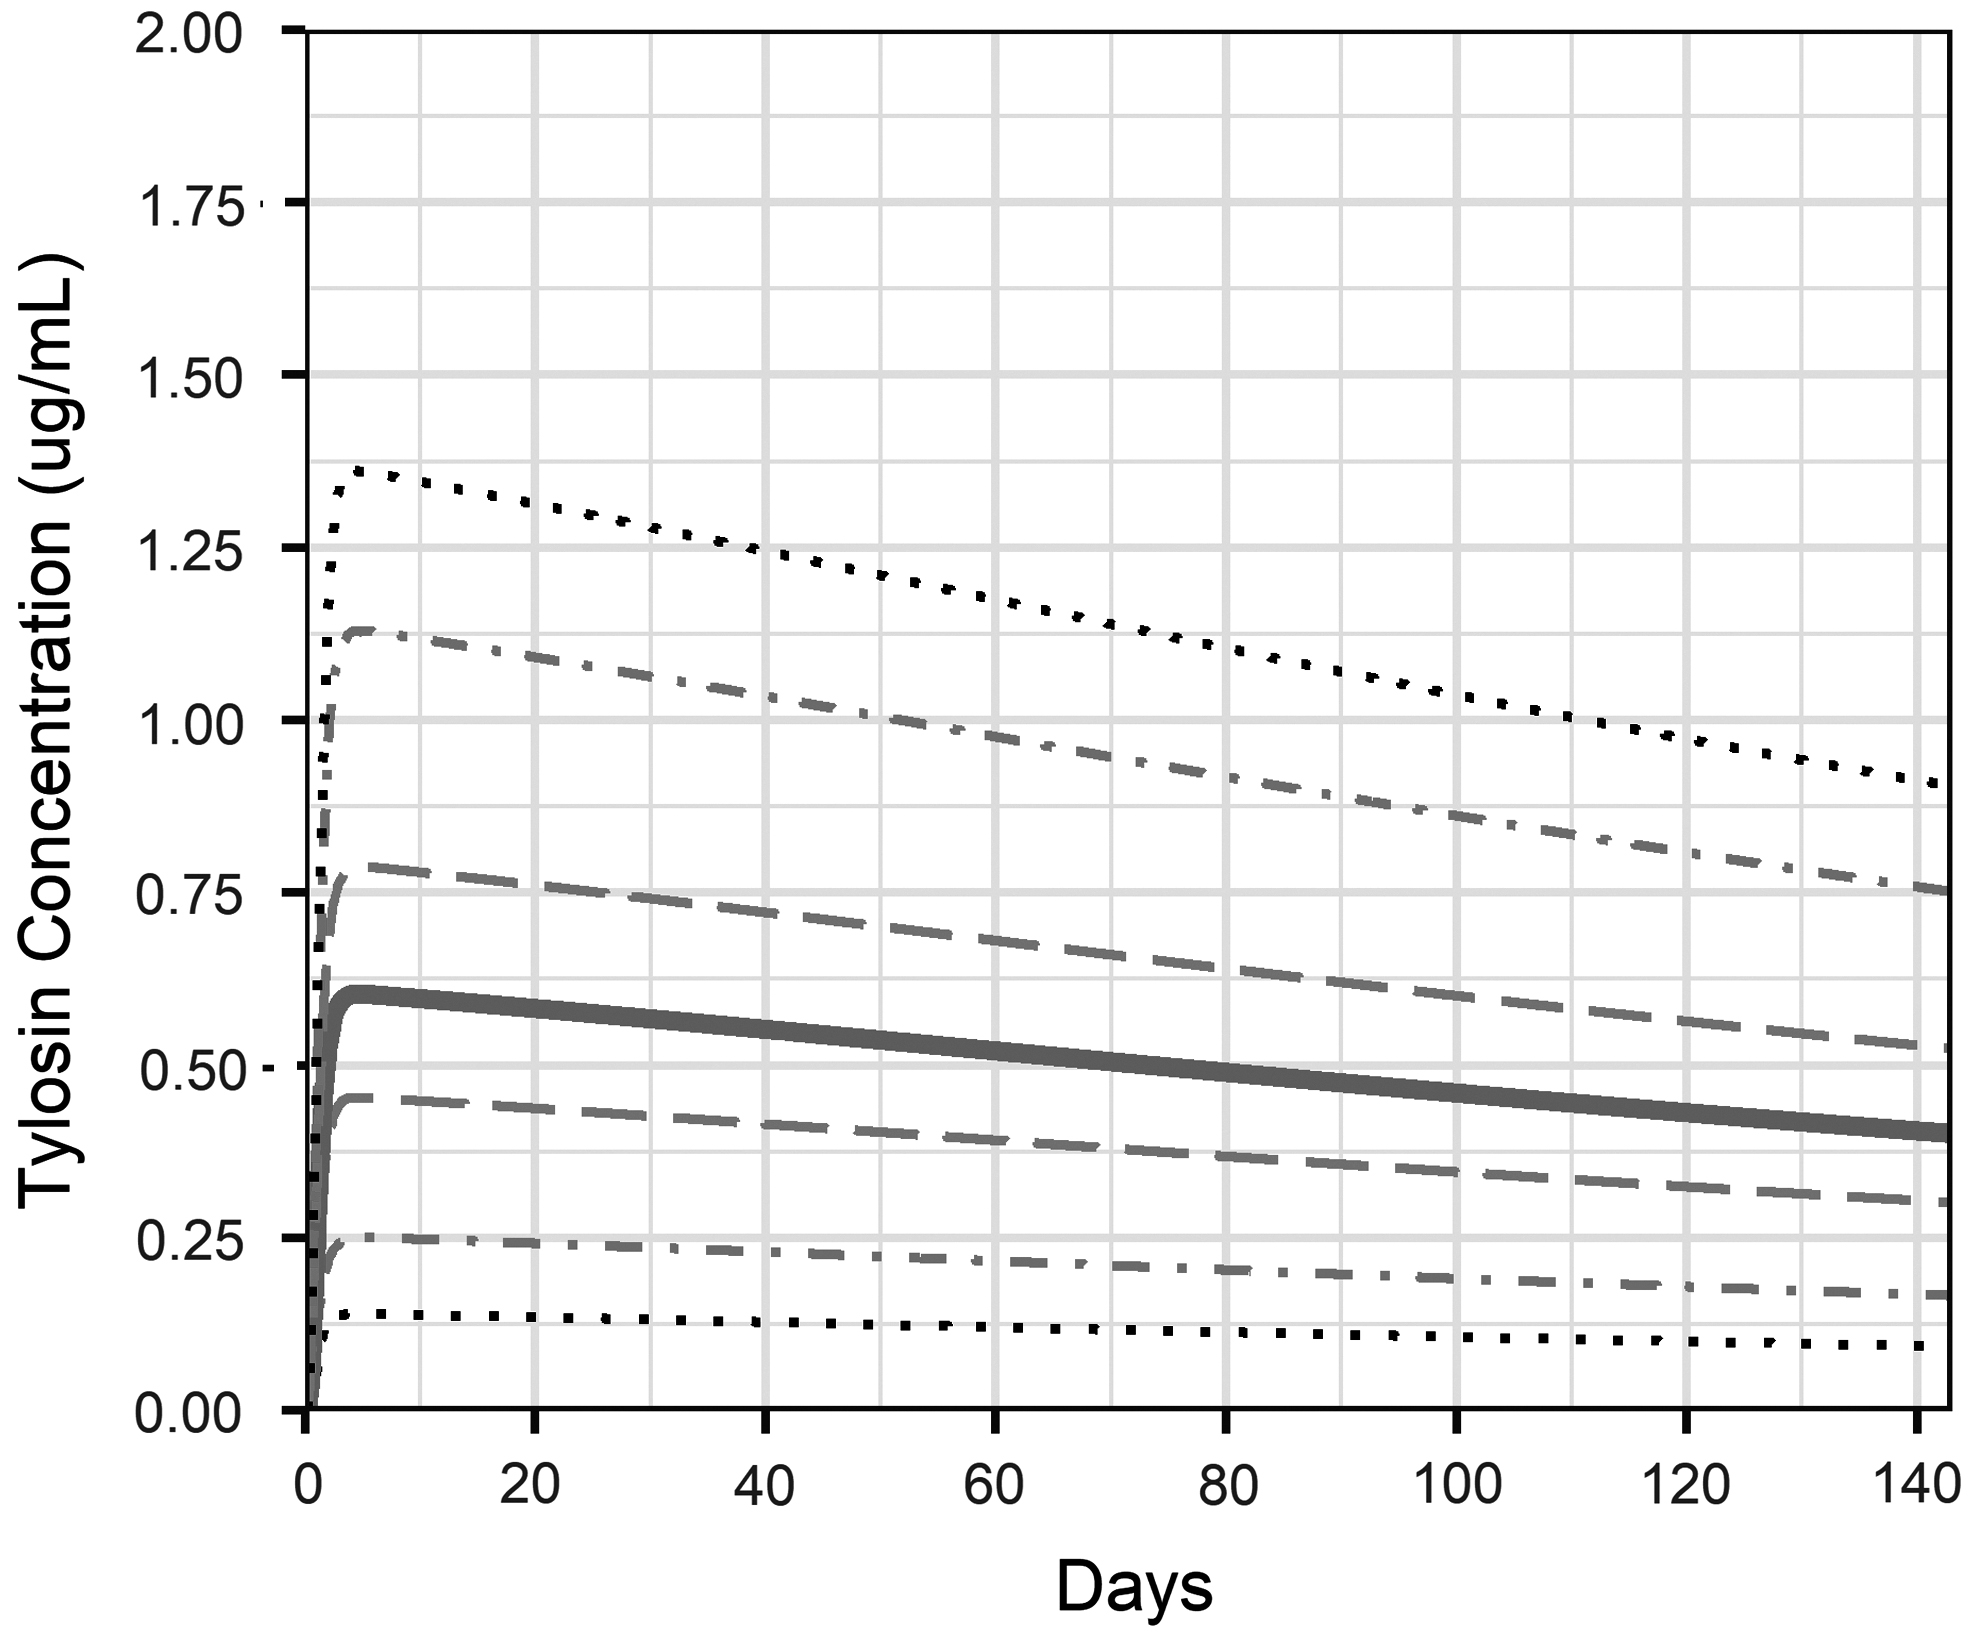
Tylosin concentration in the cattle large intestine lumen during 143 days of tylosin administration. The solid line represents the median across 1000 simulations; dashed lines are the 25th and 75th percentiles; dot-dash lines are the 5th and 95th percentiles; dotted lines are the 1st and 99th percentiles.
TYL generally had a small effect on the proportion of resistant enterococci in cattle, as measured by the difference between simulated TYL_NI pens and counterfactual CON_NI pens (Table 6, #8). The majority (75%) of simulations had either a minimal increase (70%) or no change (5%) in the proportion of resistant enterococci attributable to TYL administration (Fig. 2C). Sixteen percent of simulations showed a moderate increase, and 9% showed a substantial (>50 percentage points) increase in the TYL_NI cattle enteric resistance compared with the CON_NI cattle enteric resistance.
The interventions minimally dampened the effect of TYL on the proportion of resistant enterococci in cattle (Fig. 4). DFM had no impact on the difference between the proportion of resistant enterococci in TYL cattle and CON cattle (Fig. 4B), compared with the NI scenario (Fig. 2C). RWT increased the percentage of simulations with a minimal difference between TYL and CON cattle to 79% from 75% (NI) and decreased the percentage of simulations with moderate differences to 14%. Among simulations with a substantial increase in the proportion of resistant enterococci attributable to TYL treatment, RWT reduced the TYL effect by 2 to 5 percentage points (Fig. 4A). AFTP reduced the TYL effect by 15 to 17 percentage points in the small percentage of simulations that had substantial increases in the proportion of resistant enterococci (Fig. 4C). Environmental niches reflect the resistance prevalence and trends similar in cattle (Supplementary Fig. S1). The effect of interventions on enterococci concentrations and the differences between intervention and NI scenarios in a TYL or CON background (Table 6, #1–6) were minimal (Supplementary Figures 1–3).
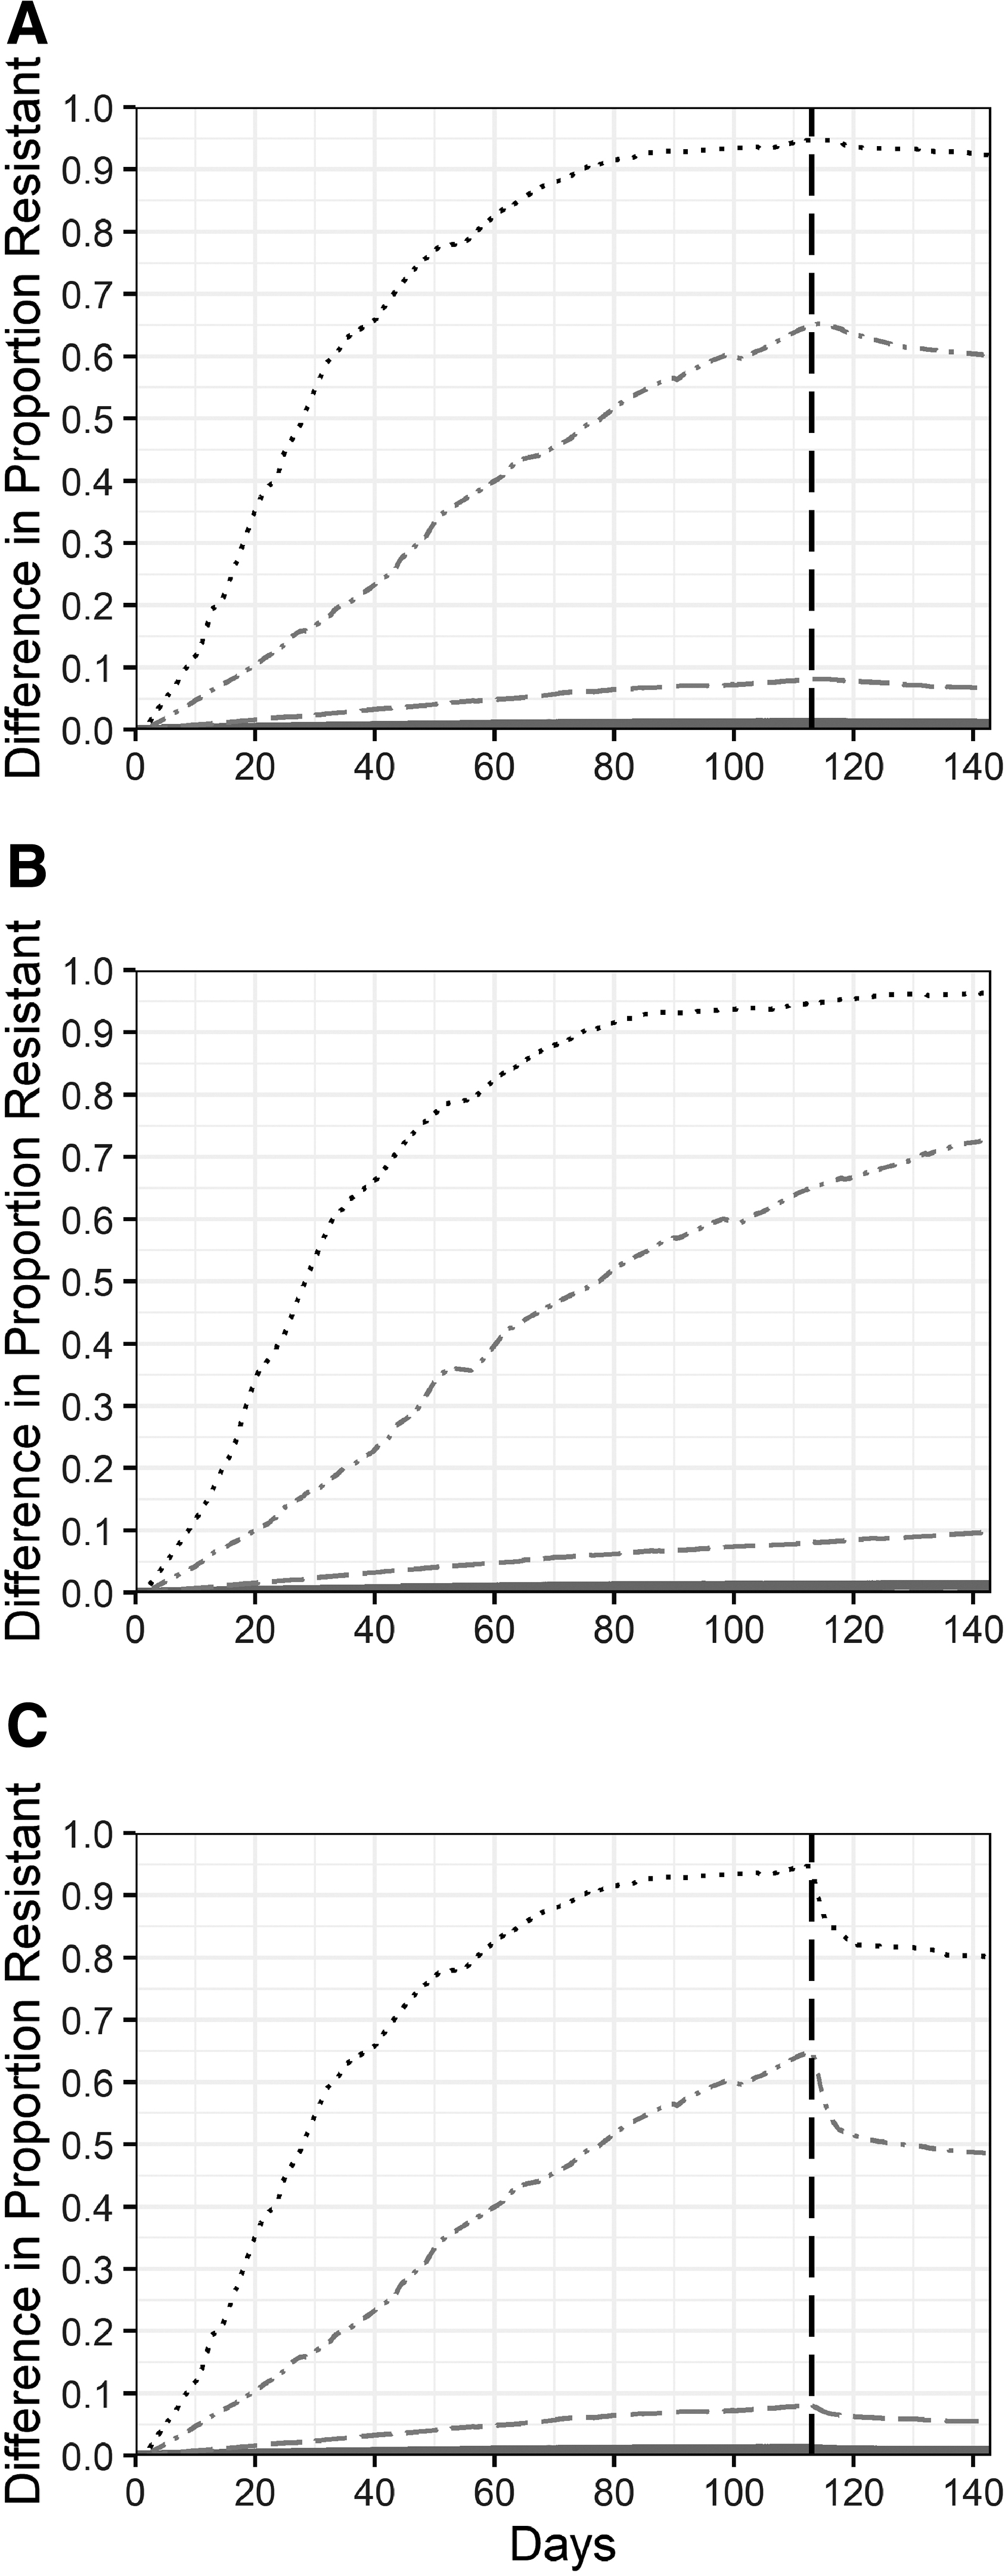
Effect of tylosin on the proportion of resistant enteric enterococci under intervention scenarios. The effect of tylosin is the difference between tylosin-fed and control simulations. Three intervention scenarios were modeled: 30-day resistance withdrawal period
Sensitivity analysis
The simulated effect of TYL (NI) on the proportion of resistant enterococci was correlated with parameters of each submodel (Fig. 5). The percentage of TYL sorbed to digesta (μ) and the rate of TYL leaving the large intestine (λli) each negatively correlated with the TYL effect. There was a smaller difference between the proportion of resistant enterococci in TYL and CON simulations if more TYL sorbed to digesta or if TYL left the large intestine faster. The TYL effect decreased if a greater susceptible MIC (log2MIC S ), susceptible Hill coefficient (HS ), or anaerobic correction factor (ψ) were used in a simulation. Variability of the starting proportion of resistant bacteria within each niche (YC , YF , YP ) had a significant impact on resistant Enterococcus proportions. A larger initial resistant proportion in cattle (YC ) resulted in a larger difference between TYL and CON simulations. The enterococci death rate in the pen environment (RP ) also was positively correlated with the TYL effect. A larger fitness cost for macrolide resistance genes (α r ) was marginally correlated with a smaller TYL effect. Taken together, these results reflect expected pharmacokinetic and pharmacodynamic dynamics. A smaller amount of TYL in the large intestine (larger μ or larger λli), an increased bacterial tolerance for TYL (larger log2MIC S , larger HS , or larger ψ), and a greater cost for carrying resistance genes (α r ) all were shown to correlate with a smaller simulated effect of TYL on the proportion of resistant enterococci.
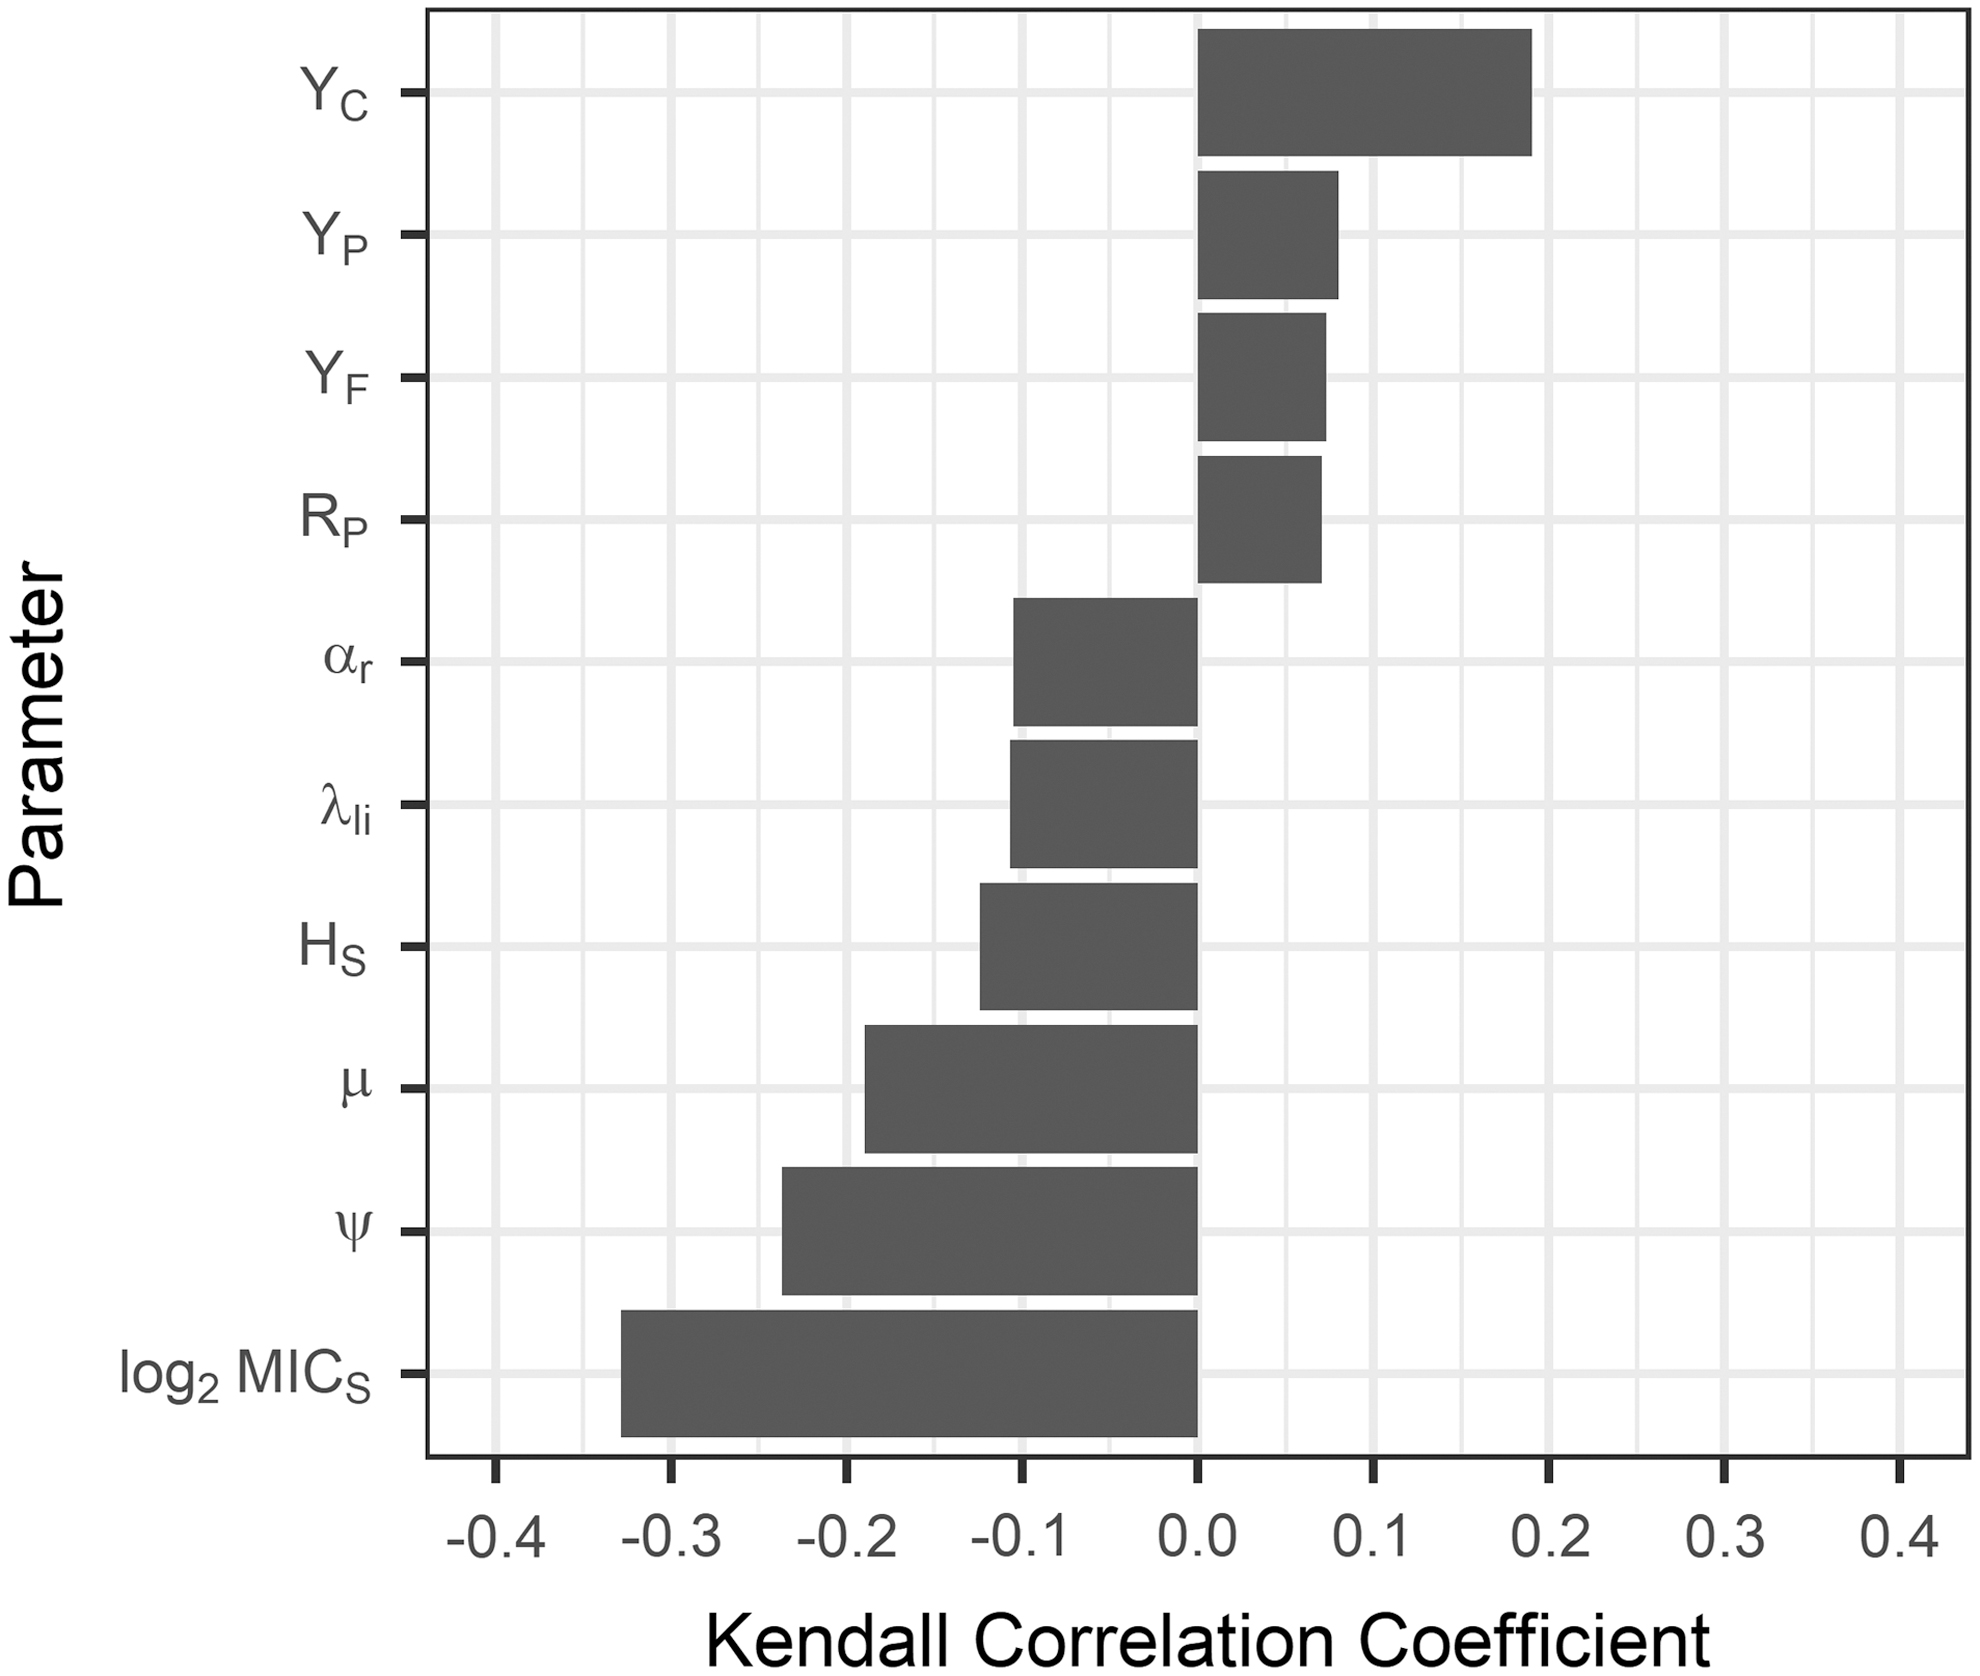
Sensitivity of the difference between the proportion of resistant enterococci in tylosin-fed and control simulations to Monte Carlo parameters. Kendall correlation coefficients were similar across the four modeled niches (cattle, pen, feed, water); thus, averages across the niches are presented. Only correlations that were less than the Benjamini–Hochberg critical value (false discovery rate ≤5%) are shown. The correlations between parameters (defined in Tables 3–5) and the difference between the proportion of resistant enterococci in tylosin and control pens on the last day of the feeding period (day 143) were evaluated using the scenario in which no intervention was implemented.
Discussion
Limitations of this model include incomplete knowledge of oral TYL pharmacokinetics in cattle and in vitro pharmacodynamics. Studies of in vivo TYL pharmacokinetics in feedlot cattle are needed to fully validate this model and may reduce the outcome variability. In vitro TYL pharmacodynamic studies will improve our understanding of TYLs sub-MIC effects on enterococci and other potential foodborne pathogens. Additional in vivo and in vitro experiments to understand the enterococci population structure within the cattle large intestine could enable modeling of distinct Enterococcus species. As with any model, we are unable to capture the full complexity of a feedlot environment. We did not account for any other antimicrobial use, including parenteral macrolides, or antimicrobial use before entering the feedlot. We modeled cattle as a homogeneous population. A substantial amount of data on interindividual variability would be required to create an agent-based model of individual animals. The interactions between cattle and their environment may vary among feedlots and could impact the utility of the AFTP intervention. Although we modeled a static number of cattle per pen, we found that there was no effect of increasing the number of cattle if the stocking density is maintained. Additional discussion of these limitations is presented in the Supplementary Materials (Supplementary Model Limitations and Assumptions).
When TYL is fed as labeled, our model predicts that the concentration of drug reaching enteric bacteria in the large intestine is significantly lower than the TYL intermediate-resistant MIC (16 μg/mL) (FDA, 2017) in all simulated cattle. The sub-MIC concentrations had a minimal effect on the proportion of macrolide-resistant enterococci in most simulations (Figs. 2 and 4); only 25% of simulations showed a TYL-associated increase of >10 percentage points in the proportion of resistant enterococci. The model generally captured the outcomes from five TYL feeding trials (Fig. 2), supporting the model's validity. It is important to note that these field data are limited: 21 observations were recorded across the 5 studies. Furthermore, two studies (Jacob et al., 2008; Zaheer et al., 2013) did not replicate a feedlot environment or feedlot cattle populations. Additional information from field trials representing a larger sample size of feedlot environments would aid in more thorough assessment of the model's validity.
The sensitivity analysis identified model parameters that correlated with the effect of TYL on the proportion of resistant enterococci (Fig. 5). The model's sensitivity to TYL sorption and excretion rates suggests a novel mechanism for reducing TYLs effect on enteric bacteria. Localized increased sorption could be achieved through dietary modification or supplementation with TYL binders that are pH activated. TYL excretion rates can be similarly modified with diet; models show reduced antimicrobial intestinal concentrations with hay-based diets compared with grain-based diets (Volkova et al., 2017). TYL feeding trials have observed an effect of days on feed or diet changes on enterococci concentrations (Davedow et al., 2020; Schmidt et al., 2020) or macrolide resistance (Beukers et al., 2015; Müller et al., 2018; Davedow et al., 2020). Therefore, further field trials must examine the effect of standard feedlot diet changes in addition to the effect of TYL to improve our understanding of the interaction between diet and TYL effects.
Although the majority of simulations showed no to minimal change in macrolide-resistant enterococci in the cattle large intestine, 25% of simulated cattle experience moderate to substantial increases in the proportion of resistant enterococci due to TYL administration. Approximately 45 million cattle are slaughtered in the United States annually (NASS, 2019), and TYL is fed from 52% to 57% of U.S. feedlot cattle (NAHMS, 2019). Therefore, ∼6 million cattle annually could enter the abattoir with an increased proportion of macrolide-resistant enterococci in their large intestine. Postharvest safeguards are designed to prevent the contamination of beef products with enteric bacteria but are not infallible. These cattle could also directly transmit resistant bacteria to feedlot employees and could contribute to the overall emission of resistant bacteria and genes into the environment. Combining an RWT and an AFTP brought TYL-treated cattle with substantial TYL-associated increases in resistance by 12 to 14 percentage points closer to the resistance level of CON cattle within 7 days (Fig. 4C).
Conclusions
The pharmacokinetic model provides the first estimation of the antimicrobial pressure placed on enteric bacteria of cattle fed TYL. Our model demonstrated that, in most cattle, TYL treatment for 143 days led to a minimal increase in the prevalence of resistant enterococci in the large intestine compared with cattle that did not receive TYL. One quarter of simulations resulted in a moderate to substantial TYL-associated increase in the proportion of macrolide-resistant enterococci. An RWT combined with moving cattle to a terminal pen with no environmental resistant enterococci for as little as 1 week had the largest impact but only reduced the TYL effect by 12 to 14 percentage points in cattle with a substantial TYL-associated increase in resistance. Further investigation of the exportation of resistant bacteria from feedlots is required to establish the permissible distribution of resistance, accepting that not all cattle and their microbiomes will respond equally to targeted interventions.
Footnotes
Acknowledgment
The content is solely the responsibility of the authors and does not represent the official views of the National Institutes of Health or the U.S. Department of Agriculture.
Disclosure Statement
No competing financial interests exist.
Funding Information
This work is supported by the USDA National Institute of Food and Agriculture, Agriculture and Food Research Initiative Competitive Grant #2016-68003-24607. Gregory Sean Stapleton was supported through the Cornell University Veterinary Leadership Program, funded by the National Institutes of Health and Department of Health and Human Services under award number 5T35AI007227-30. Casey L. Cazer was supported by the Office of the Director of the National Institutes of Health under award number T32OD011000.
Supplementary Material
Supplementary Material
Supplementary Table 1
Supplementary Figure 1
Supplementary Figure 2
Supplementary Figure 3
References
Supplementary Material
Please find the following supplemental material available below.
For Open Access articles published under a Creative Commons License, all supplemental material carries the same license as the article it is associated with.
For non-Open Access articles published, all supplemental material carries a non-exclusive license, and permission requests for re-use of supplemental material or any part of supplemental material shall be sent directly to the copyright owner as specified in the copyright notice associated with the article.
