




Abstract
Coenzyme Q0 (CoQ0) is a natural compound found in Antrodia cinnamomea, which has a variety of biological activities. Here, the antibacterial activity and possible antibacterial mechanism of CoQ0 against Escherichia coli were investigated. The antibacterial effect was evaluated by determining minimum inhibitory concentration (MIC) and minimum bactericidal concentration (MBC) values, and by assessing bacterial survival and the effect on the growth of E. coli after CoQ0 treatment in Luria-Bertani (LB) broth. To reveal the antibacterial mechanism of CoQ0, changes in intracellular adenosine triphosphate (ATP) concentration, membrane potential, and bacterial protein content, as well as effects on cell morphology and membrane integrity, were investigated. Both the MICs and MBCs of CoQ0 against E. coli were 0.1 mg/mL. After treatment of E. coli (6.5 log colony-forming units/mL) with 0.1 mg/mL of CoQ0 in LB broth for 3 h, the number of viable cells dropped below the detection limit. In addition, CoQ0 treatment resulted in the reduction in intracellular ATP concentration, cell membrane hyperpolarization, decreased bacterial protein concentrations, and damage to cell membrane integrity and cellular morphology. These results indicated that CoQ0 has effective antibacterial activity against E. coli, suggesting potential applications in food industry safety.
Introduction
E
At present, thermal sterilization is an effective way to control food from microbial contamination, but high temperature can destroy some heat-sensitive nutrients in food, and some chemical additives have adverse effects on human health, thus restricting their application in food (Schulz et al., 2015). Therefore, the use of natural products to control food spoilage and pathogenic bacteria is considered as a new antibacterial strategy (Kang et al., 2020).
Antrodia cinnamomea, a fungus that has been traditionally used in Taiwan as a folk medicine, possesses multiple functional metabolites (Zhang et al., 2017). Coenzyme Q0 (2,3-dimethoxy-5-methyl-1,4-benzoquinone [CoQ0]), a ubiquinone compound identified in Antrodia cinnamomea (Chung et al., 2014), has antitumor (Hseu et al., 2017), anti-inflammatory (Yang et al., 2016), and anti-angiogenic activities (Yang et al., 2015). Fan et al. (2018, 2019) showed that CoQ0 has antibacterial activity against Staphylococcus aureus and Listeria monocytogenes. However, the antibacterial and bactericidal activity of CoQ0 against E. coli has not been extensively explored. Therefore, our study aimed at investigating the effect of CoQ0 on E. coli growth and at determining the possible antibacterial mechanism.
Materials and Methods
Reagents
CoQ0 (HPLC 99%, CAS 605-94-7) was purchased from J&K Scientific Co. (Beijing, China), and it was stored at 4°C. CoQ0 was dissolved in dimethyl sulfoxide (DMSO) and diluted with phosphate-buffered saline (PBS) or Luria-Bertani (LB) broth. In all experiments, the final concentration of DMSO was 0.5% (v/v); preliminary studies (data not shown) indicated that DMSO at this concentration did not affect growth or survival of E. coli. All other chemicals were of analytical grade.
Bacterial strains and culture conditions
Escherichia coli ATCC 25922 was used in this study and purchased from the American Type Culture Collection (ATCC, Manassas, VA). Five STEC strains isolated from cattle farms in Shaanxi province of China were also included (see Table 1 for details). All six strains were used for the determination of minimum inhibitory concentration (MIC) and minimum bactericidal concentration (MBC) values, whereas only ATCC 25922 was used for further experiments. All strains were stored in LB broth with 25% (v/v) glycerol at −80°C. Before each assay, stock cultures were streaked onto LB agar and incubated at 37°C for 12 h. One colony from each strain was then inoculated into 30 mL of sterile LB broth and incubated for 12 h at 37°C.
Minimum Inhibitory Concentrations and Minimum Bactericidal Concentrations of Coenzyme Q0 Against Various Escherichia coli Strains
MBC, minimum bactericidal concentration; MIC, minimum inhibitory concentration; Stx, Shiga toxin.
MICs and MBCs
MICs and MBCs were determined via the microdilution method (Sivaranjani et al., 2017). Briefly, CoQ0 was added at different concentrations (1.6, 0.8, 0.4, 0.2, 0.1, 0.05, 0.025, and 0.0125 mg/mL) to LB broth and then mixed with an equal volume of E. coli suspension (5 × 10⁵ colony-forming units [CFU]/mL). Each well of a 96-well plate was then inoculated with 200 μL of the resulting suspensions. The optical density of each suspension at 600 nm (OD600nm) was measured by using a microtiter plate reader (model 680; Bio-Rad, Hercules, CA). After incubation at 37°C for 24 h, the OD600nm of each sample was measured again. To determine the MBCs, 100 μL of bacterial suspension from each well that showed inhibition was plated on an LB agar plate and cultured for 48 h at 37°C. The MIC and MBC were defined as described by Shu et al. (2019).
Growth curve
According to a previous method (Silva-Angulo et al., 2015), equal volumes of CoQ0 solution were mixed with the E. coli suspension (4 × 10⁶ CFU/mL) to achieve final concentrations 0.2, 0.1, 0.05, 0.025, 0.0125, 0.00625, 0.003125, and 0 mg/mL (Control). Aliquots (250 μL) of the mixtures were added to the wells of 100-well honeycomb plates and incubated at 37°C for 36 h. OD600nm measurements were taken at 1-h intervals by using an automatic growth curve analyzer (Bioscreen-C, Bioscreen, Helsinki, Finland).
Bacterial viability assay
E. coli was cultured overnight and adjusted to a final concentration of ∼106 CFU/mL before being treated with different concentrations of CoQ0 (0.4, 0.2, 0.1, 0.05, 0 mg/mL) and incubated at 37°C. Samples were collected at 0, 30, 60, 90, 120, 180, 240, and 360 min post-treatment and used for dilution plate counts to analyze change in viable bacterial numbers.
Membrane potential
Membrane potential was measured as previously described (Sánchez et al., 2010). Bacterial suspension (OD600nm = 0.5) was incubated in black, opaque, 96-well microtiter plates for 30 min at 37°C. After incubation, 1 μM Bis-(1,3-dibutyl barbituric acid) trimethine oxonol (DiBAC4(3); Molecular Probes, Sigma) was added and the mixture was incubated for 30 min at 37°C. CoQ0 was then added to each well to achieve final concentrations of 0, 0.1, or 0.2 mg/mL, and it was incubated for 5 min at room temperature. Fluorescence was measured by using a multifunctional microplate reader (Victor X3; PerkinElmer, Shanghai, China). Results were expressed in relative fluorescence units, which represent the fluorescence intensity minus the control.
Intracellular adenosine triphosphate concentrations
Intracellular adenosine triphosphate (ATP) concentrations were measured as previously described (Shi et al., 2016a). Briefly, CoQ0 was added to Eppendorf tubes containing E. coli cell suspension (OD600nm = 0.5) to achieve final concentrations of 0, 0.1, or 0.2 mg/mL. The suspensions were then incubated at 37°C for 30 min. The intracellular ATP was extracted by an ultrasonicator; then, the top layer was retrieved (8000 × g, 4°C, 5 min) and stored on ice to prevent ATP loss until measurement. Intracellular ATP was measured by using an ATP assay kit (Beyotime, Shanghai, China). Resulting values were defined as the intracellular ATP concentration.
Sodium dodecyl sulfate-polyacrylamide gel electrophoresis-based protein analysis
Proteins from E. coli were analyzed by using sodium dodecyl sulfate-polyacrylamide gel electrophoresis (SDS-PAGE) as described by Kang and Song (2019), with some modifications. E. coli cultures that had been treated with CoQ0 (0, 0.1, 0.2 mg/mL) for 12 h were centrifuged at 10,000 × g for 5 min, and the cell pellets were washed twice with PBS. A Bacterial Protein Extraction Kit (BestBio, Shanghai, China) was used to collect the intracellular proteins, and the protein content of different samples was determined by using a BCA Protein Assay Kit (CoWin Biosciences, Beijing, China). The protein extracts were mixed with SDS-PAGE Loading Buffer (CoWin Biosciences), heated at 100°C for 5 min, and analyzed by SDS-PAGE using a 5% stacking gel and a 12.5% separating gel. After electrophoresis, the gel was stained with Coomassie brilliant blue R-250 (Beyotime).
Confocal laser scanning microscope-based analysis of cell membrane integrity
Cell membrane integrity was determined by using a modified version of the method described by Shi et al. (2016b). An overnight culture of E. coli was harvested by centrifugation at 8000 × g for 5 min at 4°C. The cell pellet was washed twice with 0.85% (w/v) NaCl and then re-suspended in 0.85% (w/v) NaCl to achieve an OD600nm = 0.5. The resulting bacterial suspension was treated with CoQ0 (0, 0.1, 0.2 mg/mL) and incubated at 37°C for 30 min before being centrifuged rapidly (10,000 × g, 2 min, 4°C). The cell pellet was re-suspended in 0.85% (w/v) NaCl. A 3-μL volume of SYTO 9/propidium iodide (PI) mixture (equal volumes of SYTO 9 and PI) was then added to 1 mL of the bacterial suspension and incubated in the dark for 5 min. Each sample was then dropped onto a slide and observed with a confocal laser scanning microscope (CLSM, A1; Nikon, Tokyo, Japan).
Field emission scanning electron microscope analysis of cell morphology
Field emission scanning electron microscope (FESEM)-based analysis was conducted as previously reported, with some modifications (Li et al., 2014). Bacterial cell suspensions (OD600nm = 0.5) without or with CoQ0 (0.1, 0.2 mg/mL) were incubated at 37°C for 2 or 4 h. The cultured cells were then treated according to what Guo et al. (2020) described. Finally, a drop of bacterial suspension was dropped onto a slide to dry and observed by FESEM (S-4800; Hitachi, Tokyo, Japan).
Statistical analysis
All experiments were performed in triplicate. All data were expressed as mean ± standard deviation. SPSS software (version 20.0; IBM Corporation, Armonk, NY) was used for all statistical analyses. Differences between the means were tested by using an independent-sample Student's t-test. p ≤ 0.01 was considered significant.
Results
MICs and MBCs
The MIC and MBC values for CoQ0 against six E. coli strains are shown in Table 1. Overall, CoQ0 has effective antibacterial activity against the tested E. coli strains, and both MICs and MBCs were 0.1 mg/mL.
Growth curve
As shown in Figure 1, the growth of E. coli ATCC 25922 was totally inhibited by CoQ0 at 0.1 and 0.2 mg/mL. CoQ0 at 0.05 mg/mL resulted in a longer lag phase and a lower specific growth rate. However, at 0.003125, 0.00625, and 0.0125 mg/mL, CoQ0 had no significant effects on the growth of E. coli ATCC 25922, compared with the control.
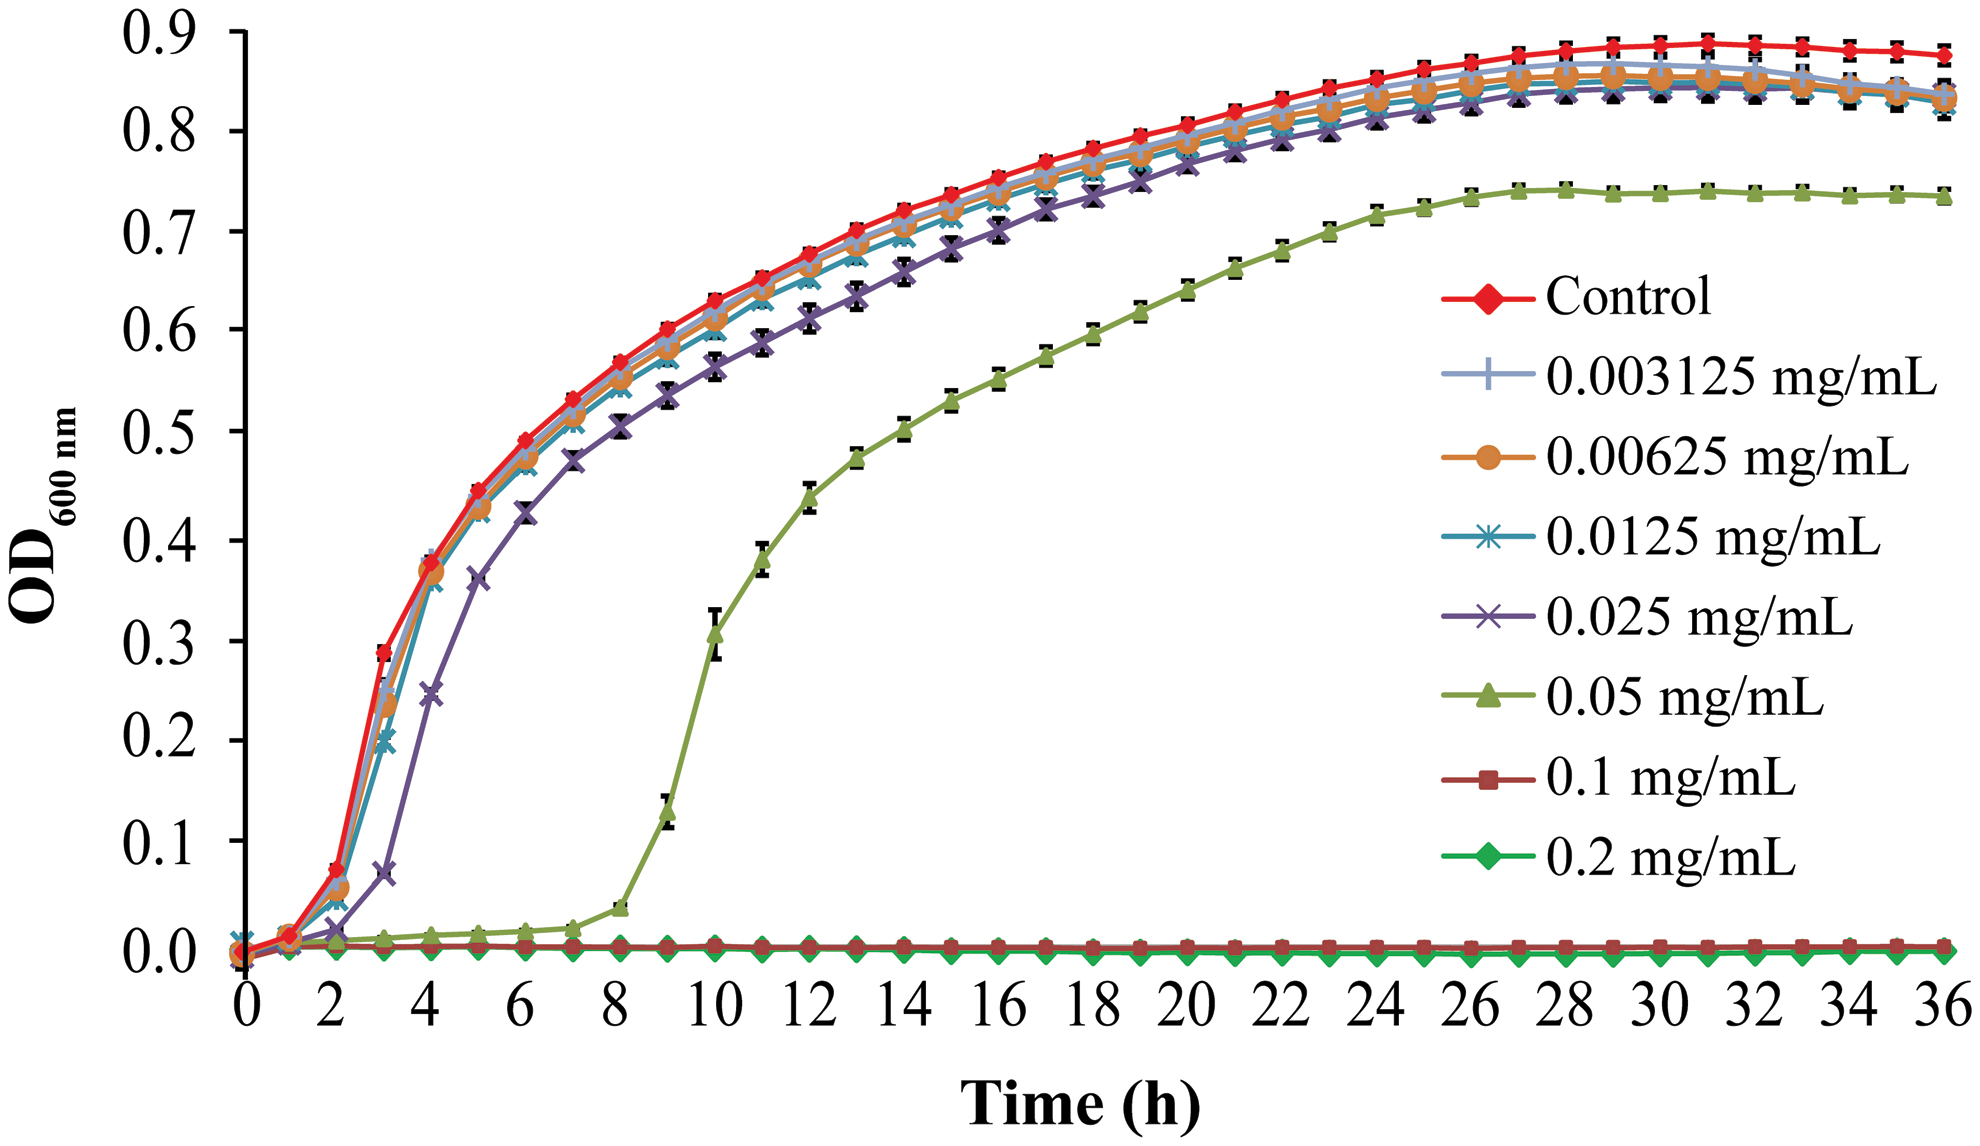
Effects of coenzyme Q0 on the growth curve of Escherichia coli ATCC 25922 in Luria-Bertani broth. Color images are available online.
Bacterial viability assay
Bacterial viability assay is shown in Figure 2; the concentration of E. coli in the control increased to ∼8.8 log CFU/mL after 360 min cultivation in LB broth. In comparison, viable cell counts were reduced by ∼5.6 log CFU/mL after 360 min of cultivation with CoQ0 at 0.05 mg/mL. After treatment with CoQ0 at 0.4, 0.2, or 0.1 mg/mL, viable cell counts dropped below the limits of detection after 90, 120, and 180 min, respectively.

Effects of coenzyme Q0 on bacterial survival of Escherichia coli ATCC 25922 in Luria-Bertani broth. Color images are available online.
Membrane potential
Compared with the control, decreased fluorescence indicates cell hyperpolarization (the phenomenon of decreased potential in the cell membrane), conversely, depolarization. As shown in Figure 3A, compared with the control, the fluorescence intensity of CoQ0-treated samples decreased significantly (p ≤ 0.01) with increases in CoQ0 concentration, indicating that membrane potential was reduced by CoQ0 treatment, resulting in hyperpolarization of E. coli cells.
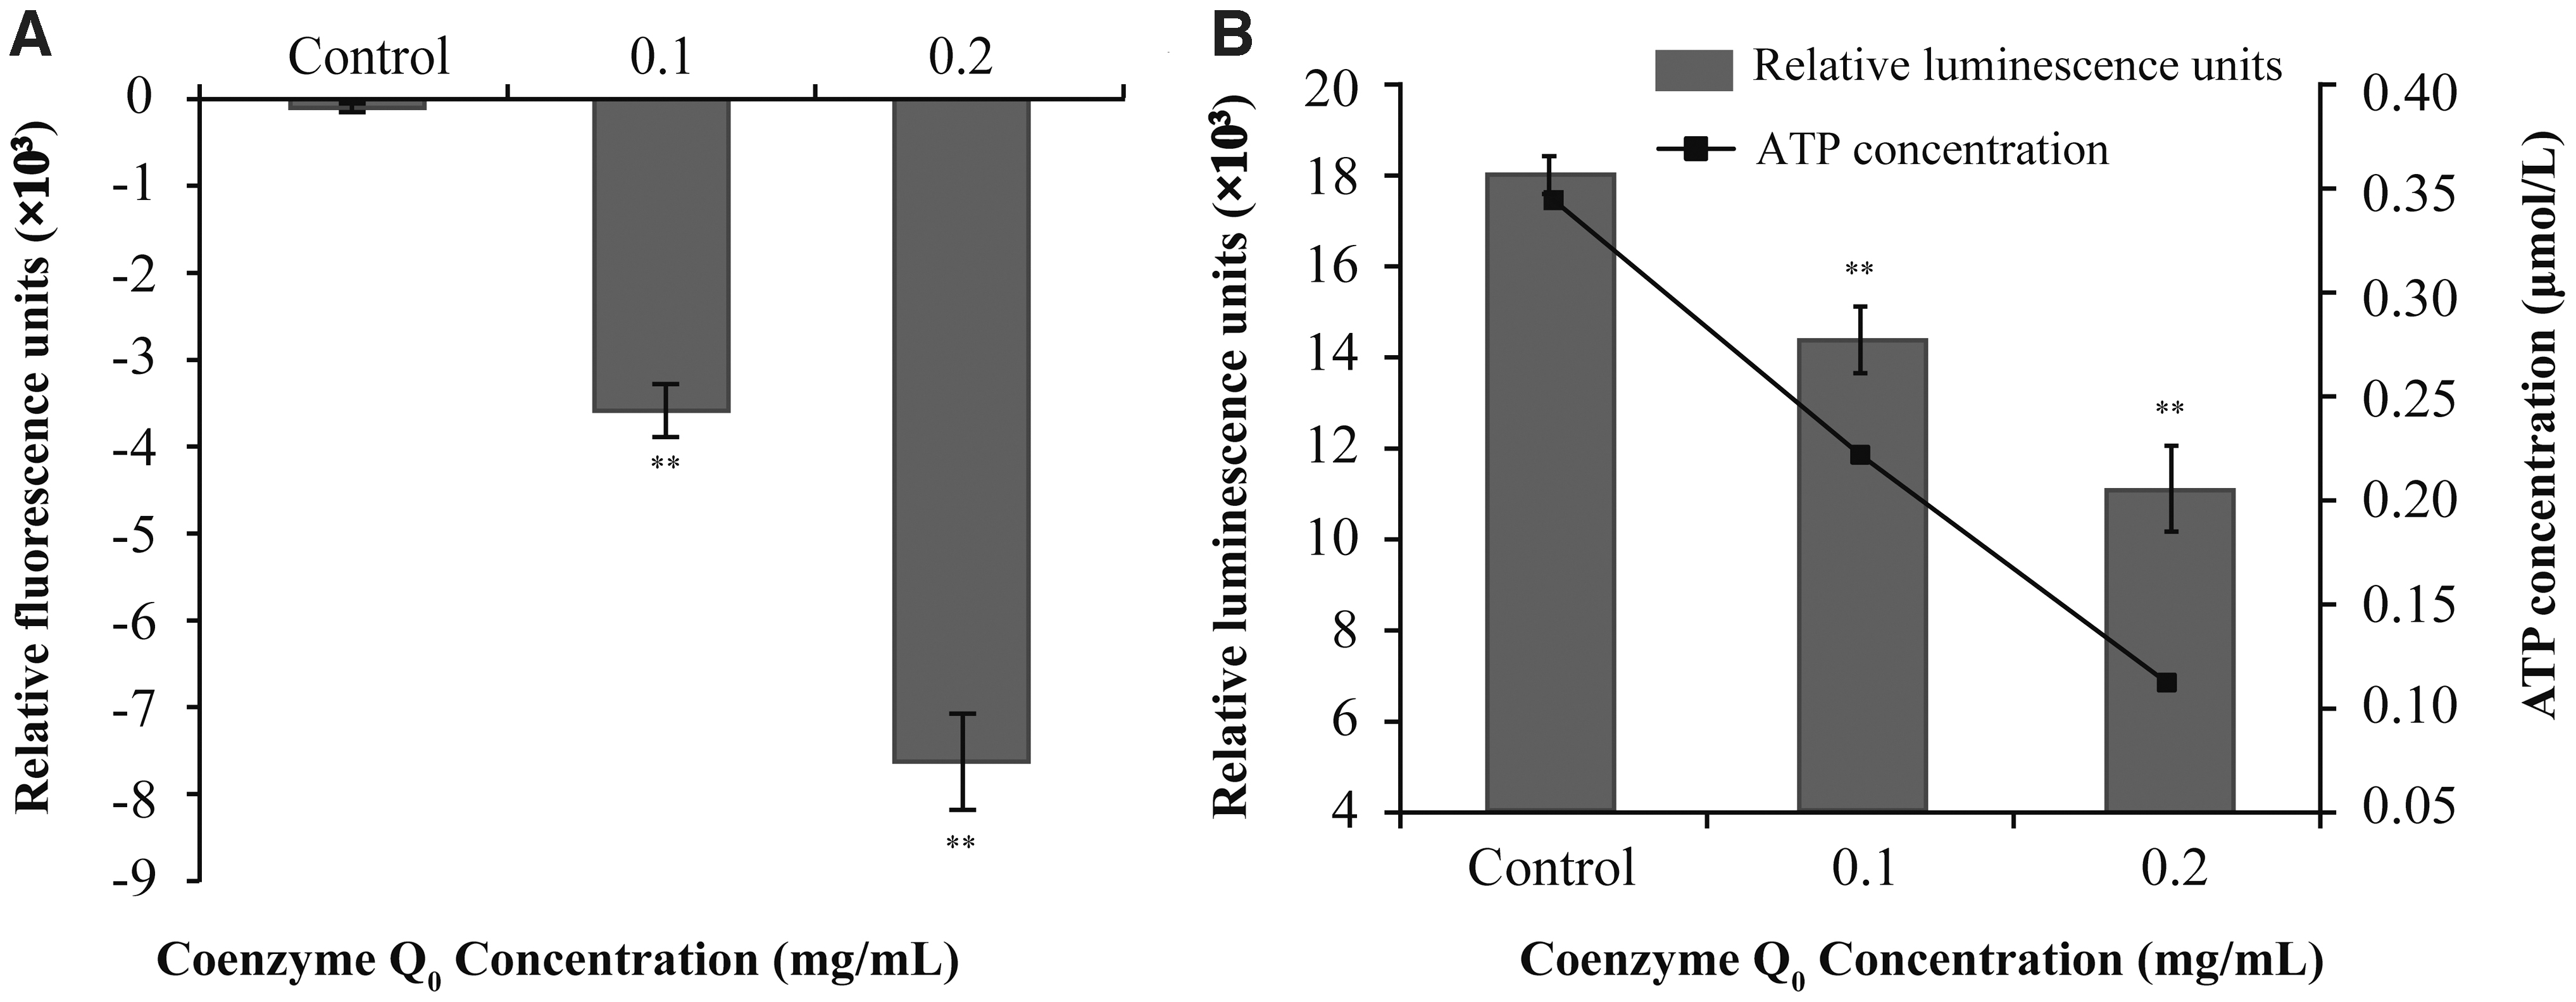
Effects of coenzyme Q0 on the membrane potentials
Intracellular ATP concentrations
The standard curve was constructed from ATP standard solution and luminescence values, and there was a positive correlation between luminescence values and ATP concentration (Formula: y = 29903x + 7752.5; R 2 = 0.9964). Then, the concentration of intracellular ATP was calculated according to the formula. Compared with the control, the intracellular ATP concentration in E. coli cells decreased significantly (p ≤ 0.01) as CoQ0 concentration increased (Fig. 3B). The initial ATP concentration of E. coli was 0.34 ± 0.03 μM, whereas the addition of CoQ0 at 0.1 or 0.2 mg/mL decreased the ATP concentrations to 0.22 ± 0.04 and 0.11 ± 0.01 μM, respectively.
SDS-PAGE-based protein analysis
As shown in Figure 4, strong protein bands were observed in the control sample, whereas the bands corresponding to the CoQ0-treated samples were very faint. Further, the protein bands decreased in intensity with increasing CoQ0 concentration, indicating that the intracellular soluble protein content decreased after CoQ0 treatment.
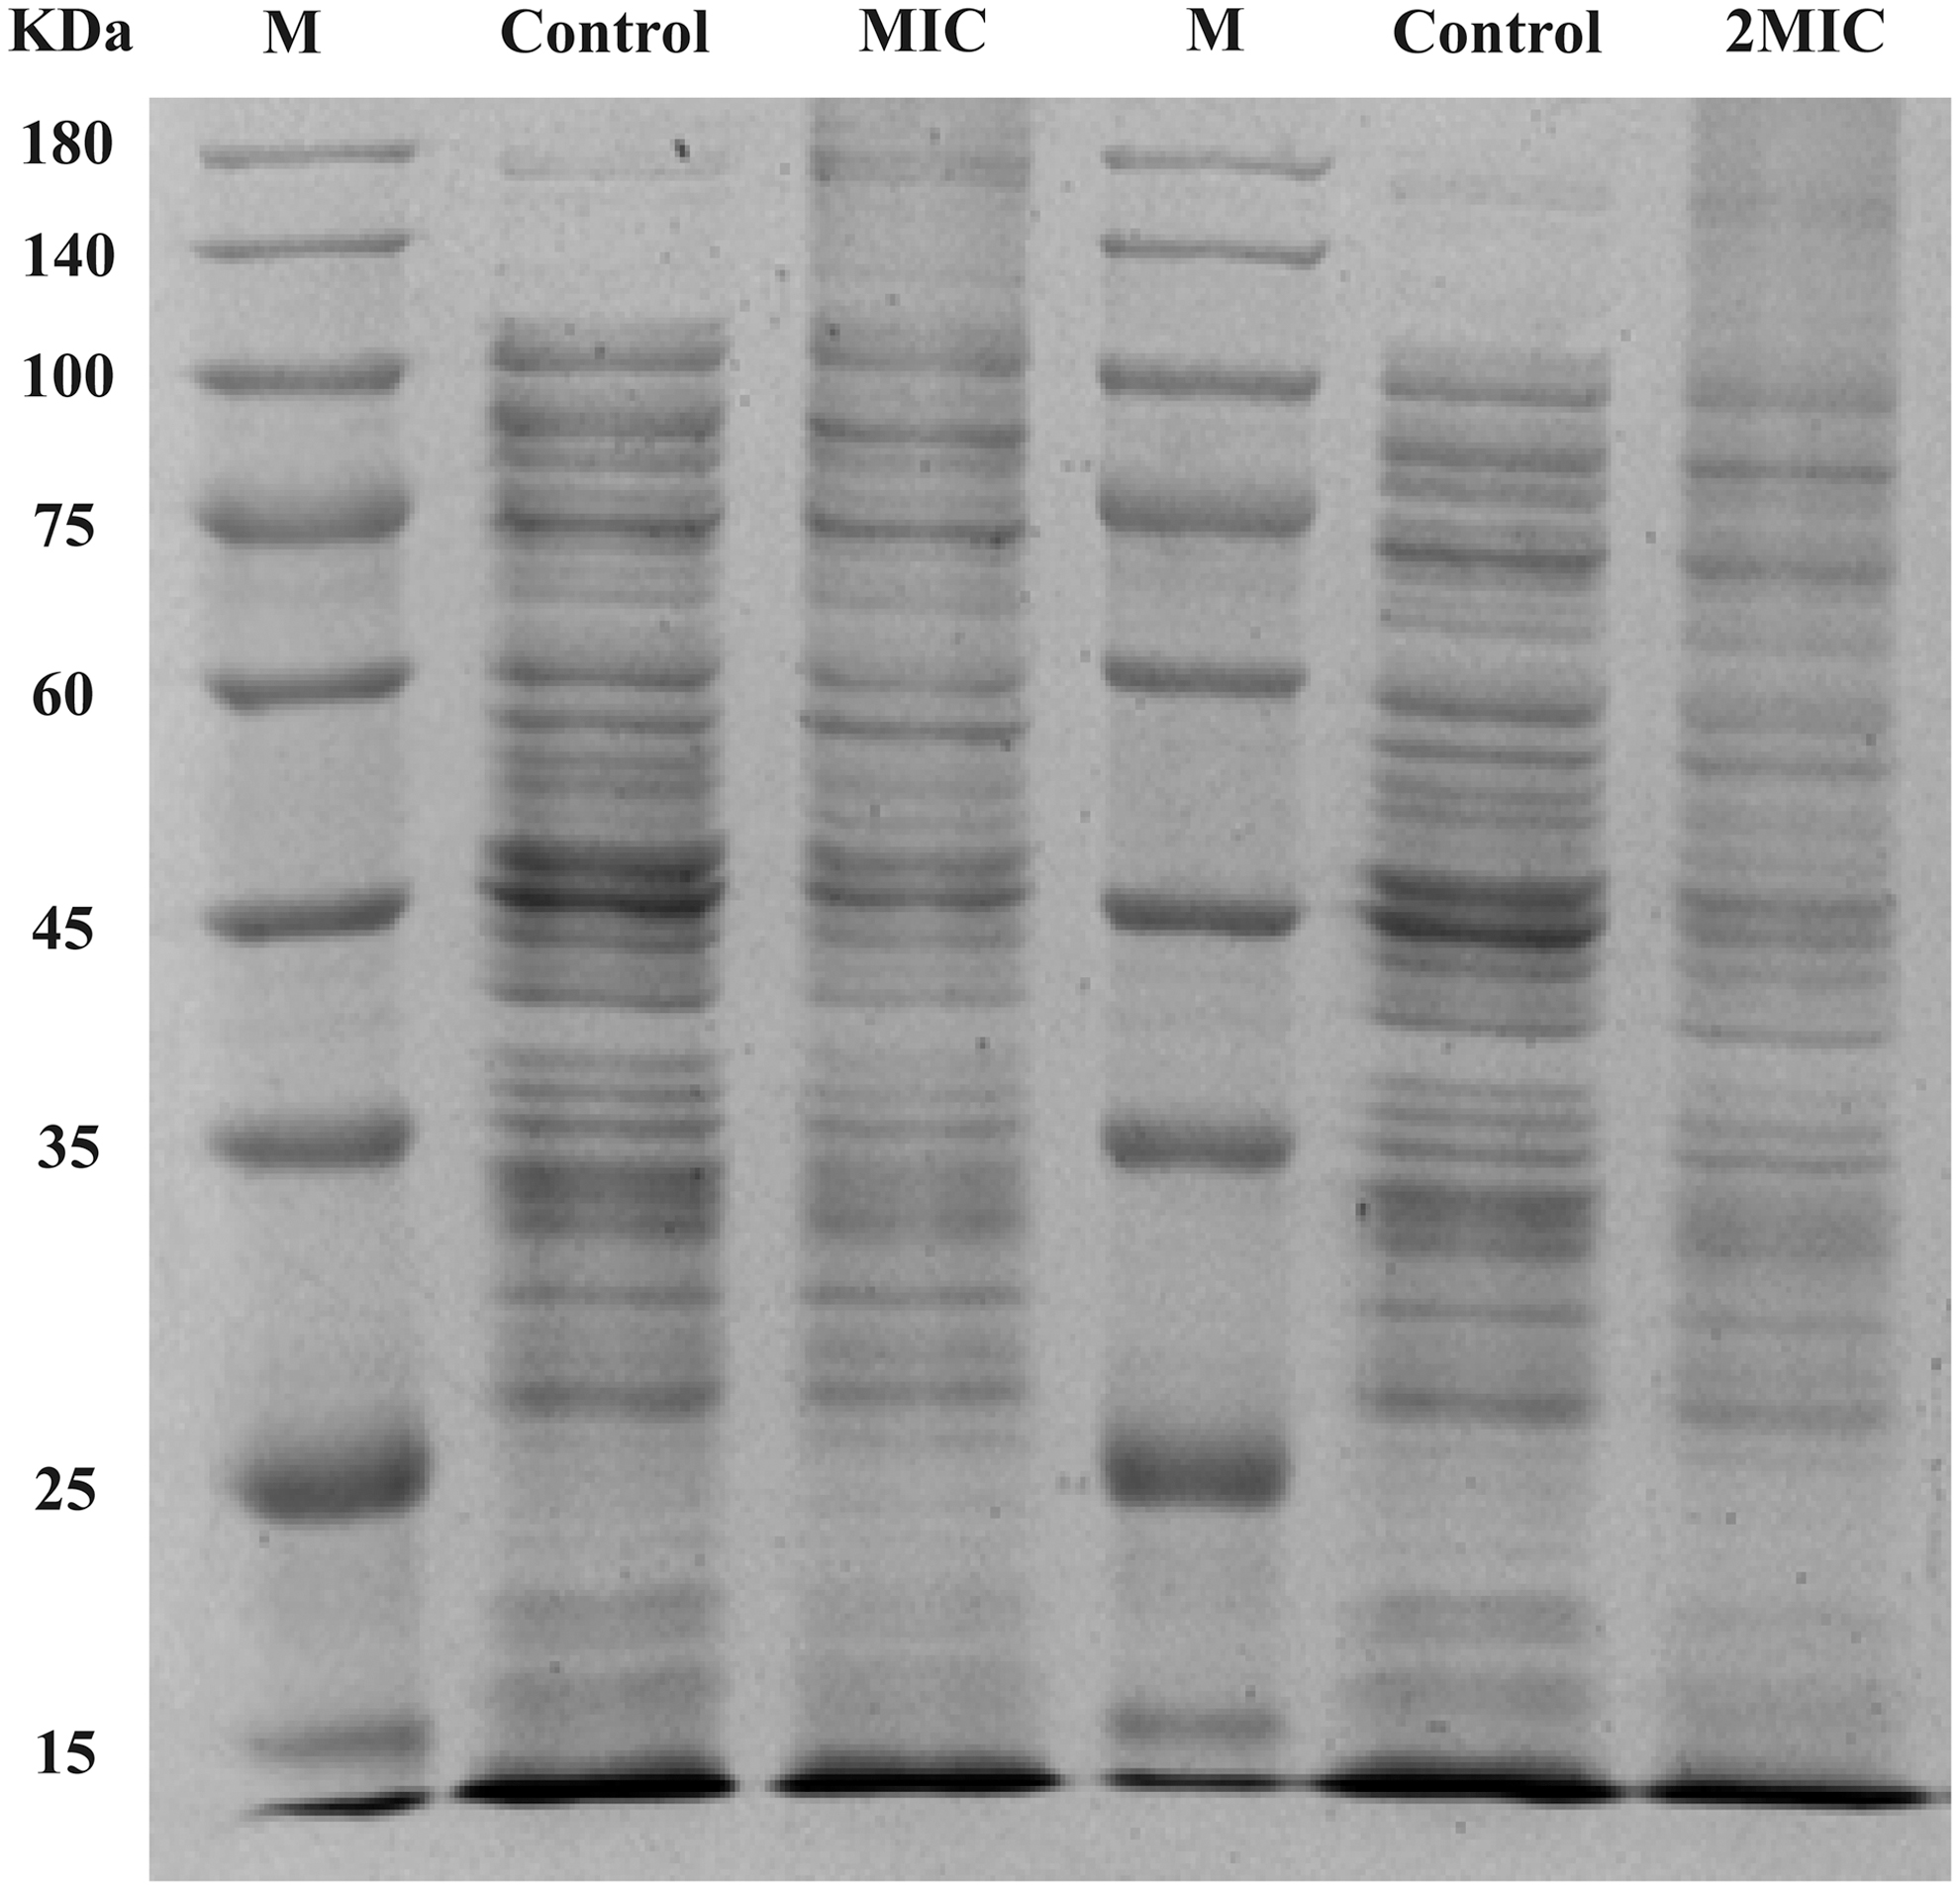
Sodium dodecyl sulfate-polyacrylamide gel electrophoresis analysis of proteins from untreated Escherichia coli ATCC 25922 and E. coli treated with CoQ0 at 0.1 or 0.2 mg/mL. Lane M: molecular weight marker; lane control: untreated cells; lanes MIC and 2MIC: cells treated with CoQ0 at 0.1 and 0.2 mg/mL, respectively. CoQ0, coenzyme Q0. MIC, minimum inhibitory concentration.
CLSM analysis of cell membrane integrity
As shown in Figure 5, the untreated cells showed green fluorescence with very little red fluorescence, indicating uptake of SYTO 9 and exclusion of PI (Fig. 5A). After treatment with CoQ0 at 0.1 mg/mL, both yellow and red fluorescence was observed, with some green fluorescence (Fig. 5B). When samples were exposed to CoQ0 at 0.2 mg/mL, they exhibited mainly yellow and red fluorescence (Fig. 5C).
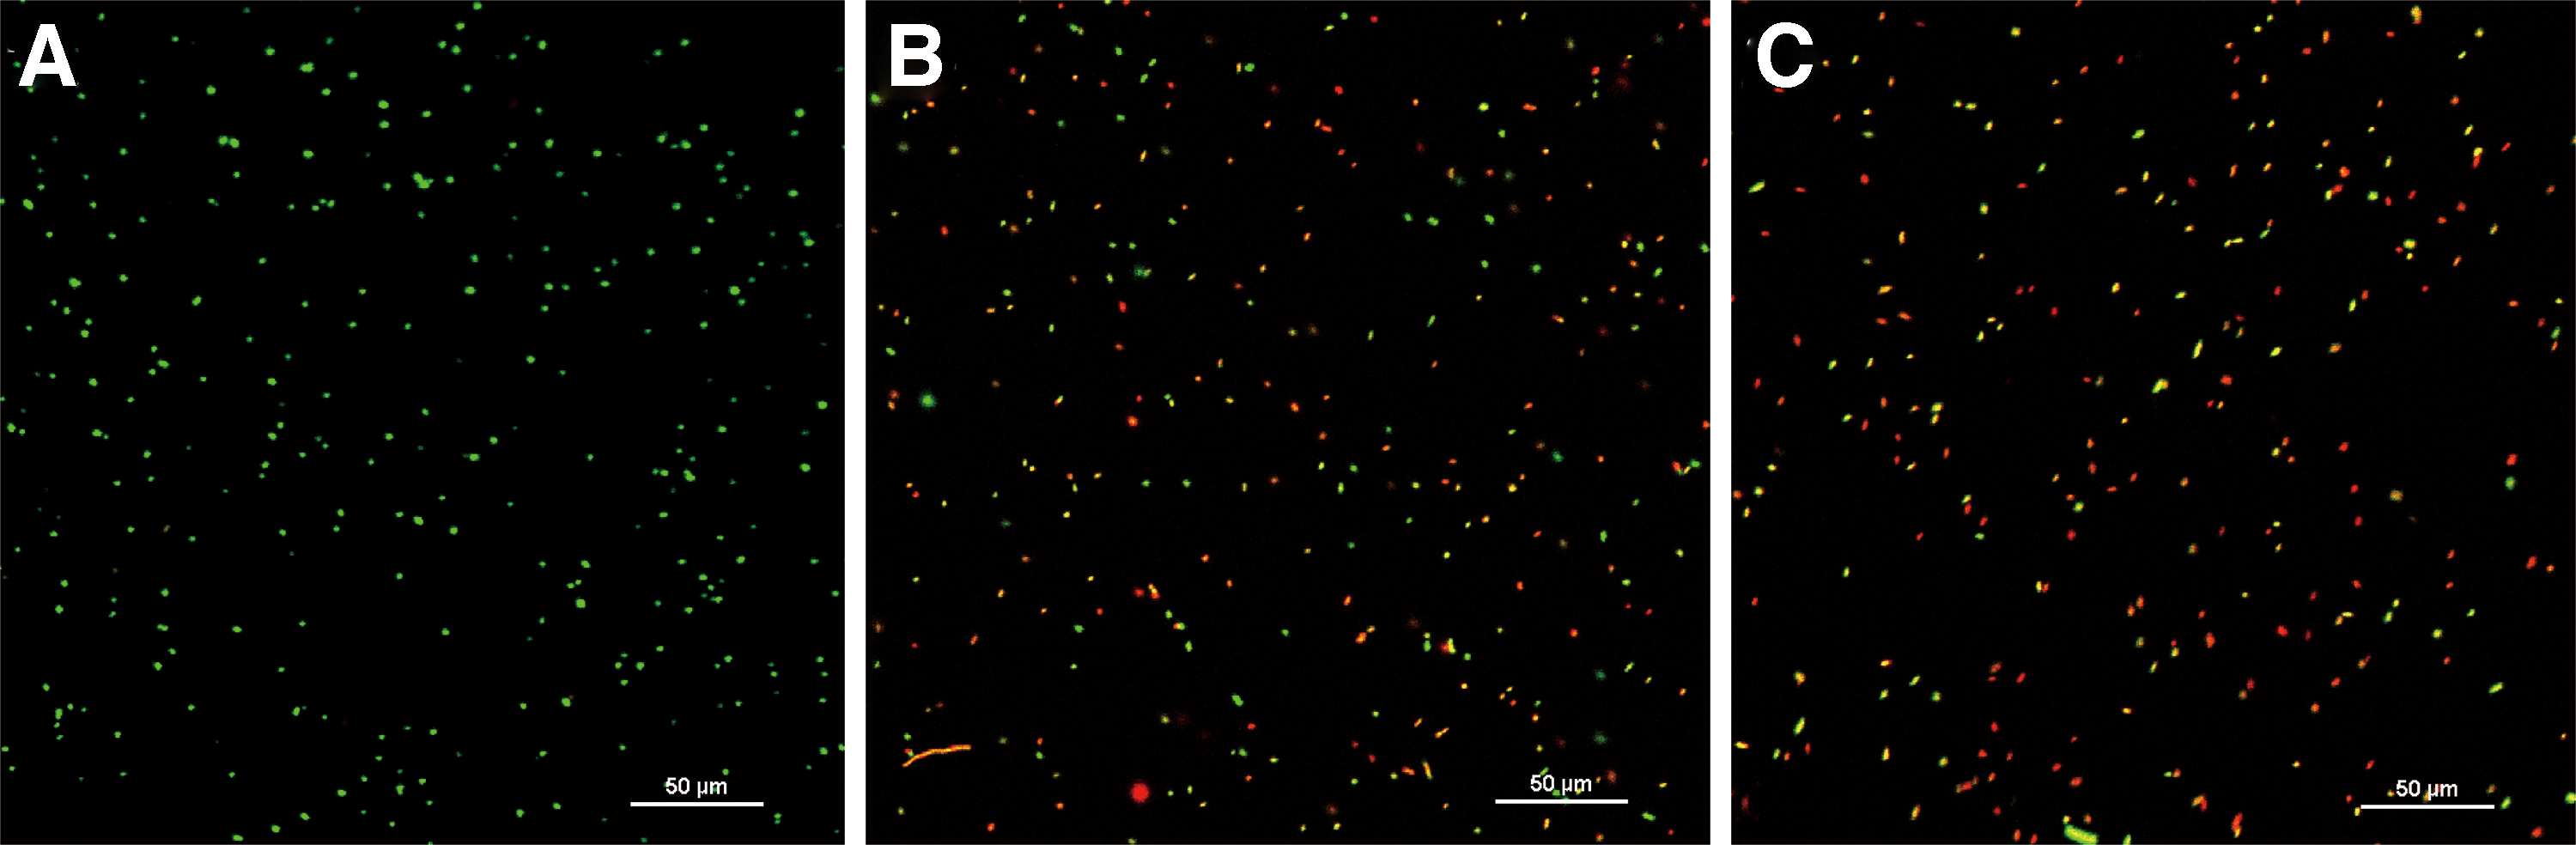
Confocal laser scanning microscope (400 × ) analysis of the membrane integrity of untreated Escherichia coli ATCC 25922
FESEM analysis of cell morphology
As shown in Figure 6, the untreated bacteria showed a rod-shaped, regular, and well-formed morphology (Fig. 6A), whereas CoQ0-treated E. coli cells appeared wrinkled and pitted with an irregular cell surface, with morphological abnormalities becoming more pronounced as the concentration of CoQ0 increased (Fig. 6B, C). In addition, cells treated with 0.2 mg/mL CoQ0 for 4 h showed significant surface collapse and deformation (Fig. 6C 2).
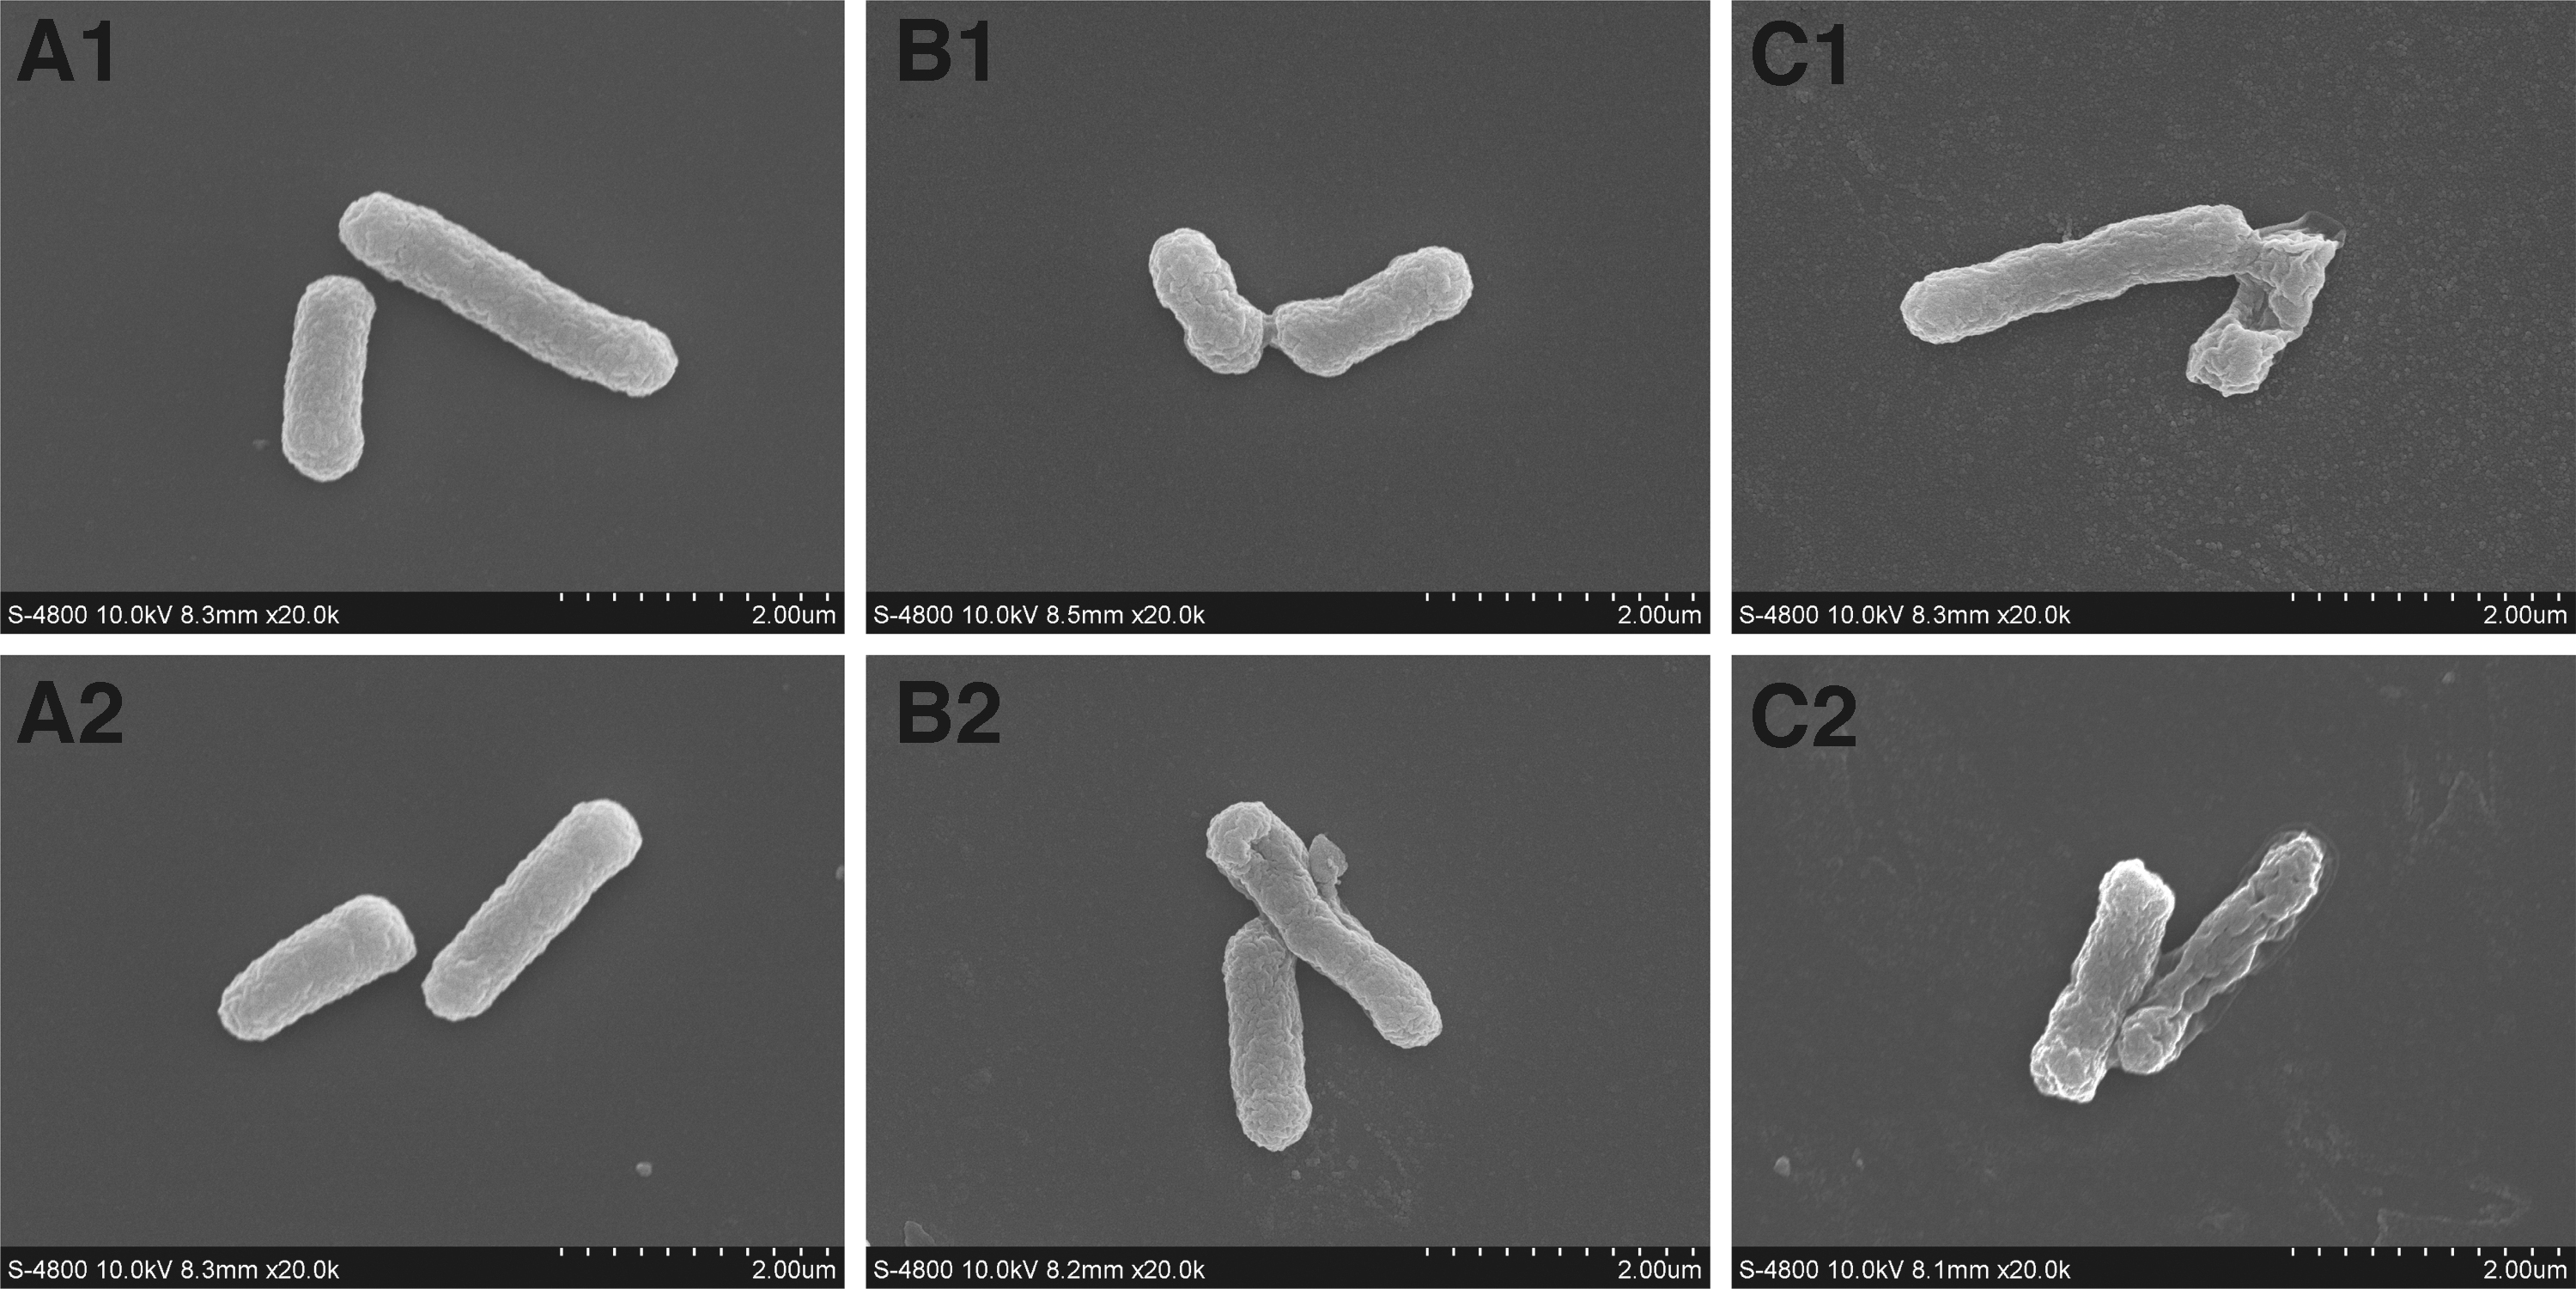
Field emission scanning electron microscopic (20,000 × ) observation of Escherichia coli ATCC 25922 that was untreated at 2 h
Discussion
CoQ0 exhibited effective antibacterial activity against the tested E. coli strains, and MICs were 0.1 mg/mL (Table 1). Yuan et al. (2019) reported MICs of thymol, carvacrol, eugenol, trans-cinnamaldehyde, citral, and vanillin against E. coli of 0.63–10 mg/mL. Compared with the MICs of the natural compounds mentioned earlier, CoQ0 exhibited greater antibacterial activity against E. coli.
Kang et al. (2018) reported that under the action of 2 mg/mL (MIC = 0.5 mg/mL) gallic acid, the growth rate of E. coli cells was significantly reduced and the lag period was prolonged. In our study, the 0.05 mg/mL CoQ0 treatment also reduced the growth rate of E. coli and prolonged the lag period (Fig. 1). This may be due to damage to cells or weakened metabolic activity by antimicrobial substances. Lin et al. (2019) reported that E. coli counts decreased by ∼2 log CFU/mL after treatment with MIC (3 mg/mL) Litsea cubeba essential oil for 3 h. After the effect of CoQ0 on MIC (0.1 mg/mL) for 3 h, the E. coli cells were completely killed (Fig. 2), which was consistent with the result that MIC was equal to MBC (Table 1).
Both depolarization and hyperpolarization are types of membrane potential change (Sánchez et al., 2010). Previous studies concluded that pH changes and intracellular K+ outward diffusion can cause cell membrane hyperpolarization, whereas extracellular Na+ inward diffusion is an important cause of cell membrane depolarization (Bot and Prodan, 2009; Plášek et al., 2013). Therefore, the change of membrane potential is related to the ion channels on the membrane. Our results revealed that CoQ0 hyperpolarized the membrane, which suggests that CoQ0 altered the ability of the E. coli cell membrane to transmit ions or damaged the membrane integrity.
ATP produced by respiration is present in all living organisms and provides energy for metabolic processes and enzymatic reactions as well as being involved in signal transduction (Mempin et al., 2013). Bajpai et al. (2013) concluded that the reduction in intracellular ATP may result from a decreased rate of ATP synthesis and increased rate of ATP hydrolysis inside the cells. In addition, the destruction of membrane integrity leads to intracellular ATP leakage through the membrane, which is also the reason for the decrease of intracellular ATP concentration (Mempin et al., 2013). In our study, the decrease of intracellular ATP concentration may also be due to the change of membrane permeability, leading to intracellular ATP leakage through the membrane, and this view was supported by CLSM-based analysis that the integrity of the cell membrane of E. coli was damaged by CoQ0 (Fig. 5). An increase in cytosolic ATP concentration is a key event in the membrane depolarization of ATP-dependent K+ channels (Das and Ljungdahl, 2003); in other words, membrane hyperpolarization should be accompanied by a decrease in intracellular ATP concentration. Our results are consistent with this statement.
Proteins are important cellular components and are essential for normal cellular activities (Wang et al., 2015). Bacteria secrete proteins from the cell cytoplasm that are necessary for a range of membrane-associated activities, including membrane biosynthesis, signal transduction, and material transport (Collinson, 2019). The results of SDS-PAGE showed that the intracellular protein content of E. coli was decreased after CoQ0 treatment, which was consistent with the results of Fei et al. (2018), reporting the effect of olive oil polyphenol extract on Cronobacter sakazakii protein levels. Intracellular protein outflow due to cell membrane damage is a common mechanism by which natural bacteriostatic agents reduce intracellular protein content (Kang and Song, 2019). In addition, in our study, CoQ0 treatment reduced intracellular ATP content of E. coli, which may also lead to insufficient energy required for protein synthesis, resulting in reduced intracellular protein content. Therefore, the decrease of intracellular protein in E. coli may be caused by the leakage of protein and the hindrance of protein synthesis.
The cell membrane is essential for maintaining normal cellular activities (Sun et al., 2018). The results of CLSM, membrane potential, intracellular ATP concentration, and protein assay showed that CoQ0 treatment caused damage to the cell membrane of E. coli. Li et al. (2019) verified that most E. coli cell membranes were damaged after chitosan-gallic acid treatment at 0.8 mg/mL by CLSM. Fluorescence microplate reader was used to measure the viable cell fluorescence of C. sakazakii ATCC 29544 treated with citral at various concentrations, and the green fluorescence of the bacteria cells decreased with an increase in citral concentration (Shi et al., 2016a). Compared with the results cited earlier, CoQ0 has the same effect on the integrity of cell membrane as other compounds.
The morphological changes in the membranes of E. coli cells treated with CoQ0 were further examined by FESEM (Fig. 6). The results suggested that CoQ0 had adverse effects on the E. coli cell membrane. Similar to the results of the present study, Bacillus cereus cells treated with monolauroyl-galactosylglycerol at 0.156 mg/mL showed significant morphological changes (Diao et al., 2018). The previous results of this study showed that CoQ0 treatment reduced the intracellular protein content and ATP concentration of E. coli, and it impaired the cell membrane integrity. Therefore, the collapse and degeneration of E. coli cells observed by FESEM is likely to be caused by the outflow of intracellular substances or the blockage of the synthesis of membrane-related proteins.
Conclusion
In summary, CoQ0 exerted a significant antibacterial effect on six E. coli strains, and five of the strains were pathogenic E. coli, STEC. The antibacterial mechanism of CoQ0 against E. coli ATCC 25922 may include the reduction of intracellular ATP concentrations, cell membrane hyperpolarization, decreased abundance of cellular protein, damage to cell membrane integrity, and change in cellular morphology. Therefore, CoQ0 has the potential to inhibit the growth of E. coli in the food industry. However, the antibacterial effect of CoQ0 against other strains, the effects on the healthy human cells, and economic feasibility require further study before application.
Footnotes
Disclosure Statement
No competing financial interests exist.
Funding Information
This work was supported by the Natural Science Foundation of China (31801659), the Shaanxi Key Research and Development Program (2019NY-118), General Financial Grant from the China Postdoctoral Science Foundation (No. 2017M623256), and the Fundamental Research Funds for the Central Universities (2452017228).