
Abstract
Escherichia coli O157:H7-contaminated beef has been implicated in numerous foodborne outbreaks. Contamination occurs despite the use of antimicrobial interventions such as lactic acid (LA). In addition, resistance to antibiotics such as ampicillin and streptomycin among isolates has been frequently reported. The influence of antibiotic resistance (ABR) on growth rates and cross-tolerance of lettuce isolate E. coli O157:H7 H1730 to LA was evaluated. Antibiotic-resistant strain variants were generated by conferring resistance to either ampicillin (ampC) or streptomycin (strepC) or both ampicillin and streptomycin (ampC strepC) through incremental exposure to the antibiotics. Ampicillin resistance was also conferred by plasmid transformation to generate the ampP and ampP strepC strains. The minimum inhibitory concentration of LA on all the strains evaluated was 0.375% v/v. The lag phase duration of all strains except E. coli O157:H7 ampP strepC increased with increasing concentration of LA. The ampP strepC and ampC strains were most tolerant to 5% LA with declines in the cell population of 2.86 and 2.56 log CFU/mL, respectively (p < 0.05). The ampP strepC strain was the most tolerant when evaluated by the live/dead viability assay. The addition of the efflux pump inhibitor, carbonyl cyanide m-chlorophenylhydrazone, with 2.5% LA resulted in a significant increase in sensitivity in the no resistance (NR) wild-type and ampC strains, resulting in 6.62 and 6.65 log CFU/mL reduction, respectively, while the highly tolerant ampP strepC strain had a 2.90 log CFU/mL decrease. Tolerance to LA was significantly influenced by both the ABR profile of the strain and LA concentration. The results from this study indicate that E. coli O157:H7 strains with certain ABR profiles might be more tolerant to LA.
Introduction
Shiga toxin–producing Escherichia coli (STEC) has been implicated in outbreaks and recalls associated with produce and beef (Crowe et al., 2015). The pathogen was responsible for 30 multistate beef outbreaks and 30 multistate lettuce outbreaks between 2006 and 2020 (Centers for Disease Control and Prevention National Outbreak Reporting System [CDC-NORS], 2020).
A total of 2.8 million people get antibiotic-resistant bacterial infections annually in the United States and 35,000 die from these infections (Centers for Disease Control and Prevention [CDC], 2020). Resistance in bacteria can be induced by long-term exposure to sublethal levels of antimicrobials (Oniciuc et al., 2019) resulting from their usage to treat infections and improve feed efficiency (McEwen and Fedorka-Cray, 2002).
Bacteria carrying antibiotic resistance (ABR) can be directly transmitted to humans through farm animals, consumption of raw or inadequately cooked food, and cross-contamination (Oniciuc et al., 2019; Bennani et al., 2020). While over 265,000 cases of foodborne illnesses occur each year due to STEC, the prevalence of ABR in STEC might be underrepresented.
Resistance to critically important antibiotics such as ampicillin and streptomycin has been reported in E. coli O157:H7 isolated from cattle and beef (Hiko et al., 2008; Bekele et al., 2014; Mashak, 2018). A study of 118 E. coli O157:H7 isolates indicated that cattle isolates had the highest resistance to antibiotics (Meng et al., 1998). Resistance to streptomycin–sulfonamide–tetracycline (AMR-SSuT) was the most common ABR pattern observed among the E. coli O157:H7 isolates from the study (Meng et al., 1998).
E. coli O157:H7 from raw meat samples—poultry and beef—had the highest resistance to ampicillin (100%) (Mashak, 2018) and streptomycin (7%) (Srinivasan et al., 2007). In 2015, 20% of retail ground beef and 41% beef cow ceca isolates of E. coli were multidrug resistant (National Antimicrobial Resistance Monitoring System [NARMS], 2015). Antibiotic-resistant microorganisms can have higher tolerance to antimicrobial agents such as sanitizers by efflux pump-associated antimicrobial exporters (Andersson, 2003).
Lactic acid (LA) is a commonly used sanitizer during beef production (Castillo et al., 2001; Winkler and Harris, 2009; Beier et al., 2013) and is applied at concentrations ranging from 2% to 5% on beef subprimal cuts and trimmings, 2–2.8% on beef heads and tongues, and 5% on livestock carcasses before fabrication (Winkler and Harris, 2009). The antibacterial action of LA occurs due to its ability to penetrate the cytoplasmic membrane of pathogens in its undissociated form, resulting in disruption of transmembrane proton motive force and reduction of intracellular pH (Alakomi et al., 2000).
The presence of E. coli O157:H7 in beef could occur because of the pathogen's ability to adapt to acid stress through acid resistance systems (Foster, 2004; Lu et al., 2013) and efflux pumps (Deininger et al., 2011). Evaluating the role of ABR-associated cross-tolerance to LA in E. coli O157:H7 could help highlight a potential loophole for survival of antibiotic-resistant E. coli O157:H7 on beef carcasses.
The objective of this study was to evaluate the tolerance of ampicillin- and streptomycin-resistant variants of E. coli O157:H7 H1730 to LA. Changes in tolerance and survival upon LA exposure were evaluated and compared between the antibiotic nonresistant parent strain of E. coli O157:H7 H1730 and the antibiotic-resistant variants. The results from this study are intended to help understand the risks of antibiotic-associated LA cross-tolerance in E. coli O157:H7.
Materials and Methods
Bacterial strain
The strain of E. coli O157:H7 used in this study was a human isolate from a lettuce outbreak—E. coli O157:H7 H1730—obtained from the Center for Food Safety, University of Georgia Griffin Campus culture collection. The bacterial strain was confirmed using the API 20E identification system (apiweb™; bioMerieux, Inc.) and whole-genome sequencing.
The isolate was revived from frozen storage by transferring to tryptic soy broth (TSB; Neogen, Lansing, MI) and incubating at 37°C for 24 h. The bacterial strain was evaluated for ABR by growing cells on tryptic soy agar (TSA; Neogen) containing 100 μg/mL streptomycin and ampicillin before development of the antibiotic-resistant strain variants.
Development of antibiotic-resistant variants
Chromosomal resistance
Chromosomal resistance to streptomycin and ampicillin was developed by inoculating 900 μL of TSB amended with 10 μg/mL antibiotic with 100 μL of the nonresistant wild-type strain to obtain a final concentration of 5 log colony-forming units (CFU)/mL. Upon observation of turbidity, the culture was used to inoculate a fresh batch of TSB containing a 10-μg/mL increment in antibiotic concentration compared with the previous one.
This was repeated until resistance to 100 μg/mL ampicillin and streptomycin was achieved. Antibiotic-adapted strains (Table 1) retained resistance to the antibiotics without the presence of selective pressure.
List of Escherichia coli O157:H7 H1730 Strain Variants Used in This Study
Transformation by electroporation
Transformation of cells to take up a green fluorescent protein ampicillin resistance plasmid (GFP amp plasmid) was performed following the method described by Dev Kumar et al. (2017), with minor modifications. Briefly, competent cells were prepared by inoculating 45 mL of TSB with 1ml of an overnight culture of E. coli O157:H7 H1730.
The culture was incubated at 37°C for 4 h to achieve an optical density of 0.8, following which the cells were placed in ice for 15 min. The culture was then centrifuged at 1400 × g for 10 min to pellet the cells, and the supernatant was discarded. The pelleted cells were washed three times with 15% ice-cold glycerol and stored at −80°C until use. The cells were transformed using the host range plasmid, pGFPuv (SnapGene, 2021).
Electroporation conditions applied were 2.5 kV, 25 μF, and 400 Ω using the Gene Pulser II system (Bio-Rad, Hercules CA). Colonies of transformed cells expressed fluorescence upon excitation with UV light (365 nm) and were resistant to 100 μg/mL ampicillin.
Determination of the minimum inhibitory concentration of LA
The minimum inhibitory concentration (MIC) of LA (
Serial dilutions were performed from initial LA concentrations of 5% and 3% to obtain LA concentrations of 2.5%, 1.5%, 1.25%, 0.75%, 0.62%, 0.37%, 0.31%, 0.18%, 0.15%, 0.09%, 0.07%, 0.04%, 0.03%, and 0.02% v/v. The 96-well plates (Costar® 96-Well Flat Bottom; Corning Life Sciences, Inc., ME) were incubated for 24 h at 37°C, and the growth kinetics were observed using the BioTek Cytation 3 image reader (BioTek Instruments, Inc.).
Conditions in the BioTek Cytation 3 image reader were set as follows: the total runtime was set for 24 h with read intervals of 30 min, the shaker was set to an orbital shake every 10 s at a frequency of 283 cpm (3 mm), the read speed was set to normal with a delay of 100 msec, and the optical density was read at an absorbance of 600 nm. Uninoculated blanks of TSB were used as controls for this experiment.
Evaluation of growth rates
The growth rates for the different bacterial strains (Table 1) in TSB and the subminimum concentration of LA were evaluated using the turbidimetric technique. The experiment was conducted in a 96-well microplate by inoculating 20 μL of 6.76 ± 0.71 log CFU/mL of bacteria with 180 μL of media.
Growth rates were observed for 24 h at 37°C using the BioTek Cytation 3 image reader (BioTek Instruments, Inc.). Conditions in the BioTek Cytation 3 image reader were set as previously described. Three biological and three technical replicates were performed.
Mathematical modeling for bacterial growth
The modified Gompertz model (Gibson et al., 1988) further modified by Begot et al. (1996) was fitted to the growth curve of these bacterial strains using MATLAB software (version R2021a; MathWorks, Inc., Natick, MA).
The model can be described by the following equation (Hayman et al., 2021), where N is the bacterial population at a given time, N
0 is the initial bacterial population, O.D.min is the lowest O.D. value above the detection threshold, A is the logarithmic increase of bacterial population, L is the lag time, μ is the maximum growth rate, and t is time:
The growth parameters assessed were change in bacterial population in log CFU/mL (A), lag phase duration in hours (L), maximum growth rate in log CFU/h (μ
max), and generation time in hours (T), which was calculated according to the following equation:
LA tolerance
Overnight cultures of E. coli O157:H7 H1730 grown on TSA (TSA; Neogen), TSA +100 μg/mL ampicillin, TSA +100 μg/mL streptomycin, or TSA +100 μg/mL streptomycin and ampicillin were used to prepare an 8 log CFU/mL ∼ OD600nm 0.2 bacterial inoculum in 1 × phosphate-buffered saline (PBS; VWR Chemicals LLC, Solon, OH). The bacterial strains were exposed to 2.5% and 5% v/v LA for 30 s as follows: 1 mL of the suspended culture was transferred to 9 mL of media containing either 2.5% or 5% LA for the exposure time.
The activity of LA on exposed bacteria was neutralized by transferring cells to Dey–Engley neutralizing broth (DE neutralizing broth; Hardy Diagnostics, Santa Maria) before serial dilutions in 1 × PBS. Exposed cells were enumerated on TSA or TSA with appropriate antibiotics and left to incubate for 24 h at 37°C before enumeration of colonies.
Viability assay
The live/dead assay was performed on LA-stressed cells. Live/dead assays use a combination of SYTO 9 (green fluorescent nucleic acid stain for intact bacterial membranes) and propidium iodide (red fluorescent nucleic acid stain for compromised cell membranes) to quantitatively distinguish live and dead bacteria. The assay was performed following instructions on the commercial Invitrogen™ LIVE/DEAD BacLight™ Bacterial Viability Kit L13152 (Thermo Fisher Scientific, NYSCE: TMO), with some modifications for this study.
Briefly, bacterial cells were prepared by suspending overnight cell cultures grown on TSA in 10 mL of 1 × PBS and adjusting the optical density, OD600nm, to 0.2–8 log CFU/mL. Cell cultures were exposed to 5% v/v LA by transferring 100 μL of the bacterial cell suspension to 900 μL of acid for 30 s. Cultures were centrifuged at 16,300 × g for 2 min using the Corning LSE™ high-speed microcentrifuge (Corning Life Sciences, NY) to obtain pellets, and the supernatant was discarded.
The bacterial cells were washed twice using sterile deionized water (SDW) and resuspended in 1 mL of SDW. A 100-μL aliquot of the bacterial cell suspension was mixed with 100 μL of a 2 × working solution of the LIVE/DEAD BacLight staining reagent (SYTO 9: propidium iodide) in a black, opaque 96-well microplate (Thermo Scientific flat bottom Microfluor® 2; Thermo Scientific, NYSCE: TMO).
The mixture was incubated at room temperature in the dark for 15 min, and fluorescence intensity was read using the BioTek Cytation microplate image reader (BioTek Instruments, Inc.). The excitation and emission wavelengths were set as follows: 485 nm/530 nm for the green stain (SYTO 9) and 485 nm/630 nm for the red stain (propidium iodide).
The live/dead (G/R) ratio was calculated by dividing the fluorescence intensity value of SYTO 9 by the intensity value of propidium iodide. The percentage of live cells after acid exposure was calculated by dividing the G/R ratios of acid-exposed cells by G/R ratios of non-acid exposed cells (controls) and multiplying by 100.
Efflux pumps in antimicrobial cross-tolerance
The efflux pump inhibitor, carbonyl cyanide 3-chlorophenylhydrazone (CCCP), was used to investigate the possible role of efflux pumps in bacterial tolerance to LA. Bacterial strains were exposed to 2.5% lactic acid both in presence and without the presence of CCCP.
A CCCP stock solution of 1 mg/mL was prepared in dimethyl sulfoxide (DMSO; Sigma Chemical Co., St. Louis, MO) and added to TSB amended with 2.5% LA to obtain a final CCCP concentration of 10 μg/mL. The bacterial strains, No Resistance (NR), ampC, and ampP strepC, were added to TSB +2.5% LA and TSB +2.5% LA+CCCP to obtain a final concentration of 7.47 ± 0.17 log CFU/mL.
Exposure of cells was sustained for the duration of 30 s, following which the cells were enumerated using methods previously described. Three biological and three technical replicates of each experiment were performed.
Statistical analysis
Three biological and three technical replicates of all experiments were performed. Significant differences between the parameters were compared using one-way analysis of variance, and means were compared using Tukey's honestly significant difference test at a 0.05 significance level. Statistical analysis was conducted with the JMP statistical software (SAS Institute, Inc.).
Plate counts from the LA exposure study were converted to log CFU/mL and counts with 0 were assigned a value of 10 CFU/mL based on the lowest limit of detection—10 CFU/mL or 1 log CFU/mL. Differences were considered significant at the p < 0.05 level of probability.
Results
MIC and growth parameters of E. coli O157:H7
The type of strain and concentration of LA significantly affected growth parameters (p < 0.05). A concentration of 0.375% LA v/v inhibited the growth of all the strains that were tested. Differences in ABR profiles did not affect the MIC (p > 0.05). Growth of the strains in the presence of sub-MICs of LA (Figs. 1 and 2; 0.0625%, 0.125%, and 0.25% v/v) resulted in significant differences in growth parameters such as lag phase duration (λ) and maximum specific growth rate (μ max) among the strains (p < 0.05).
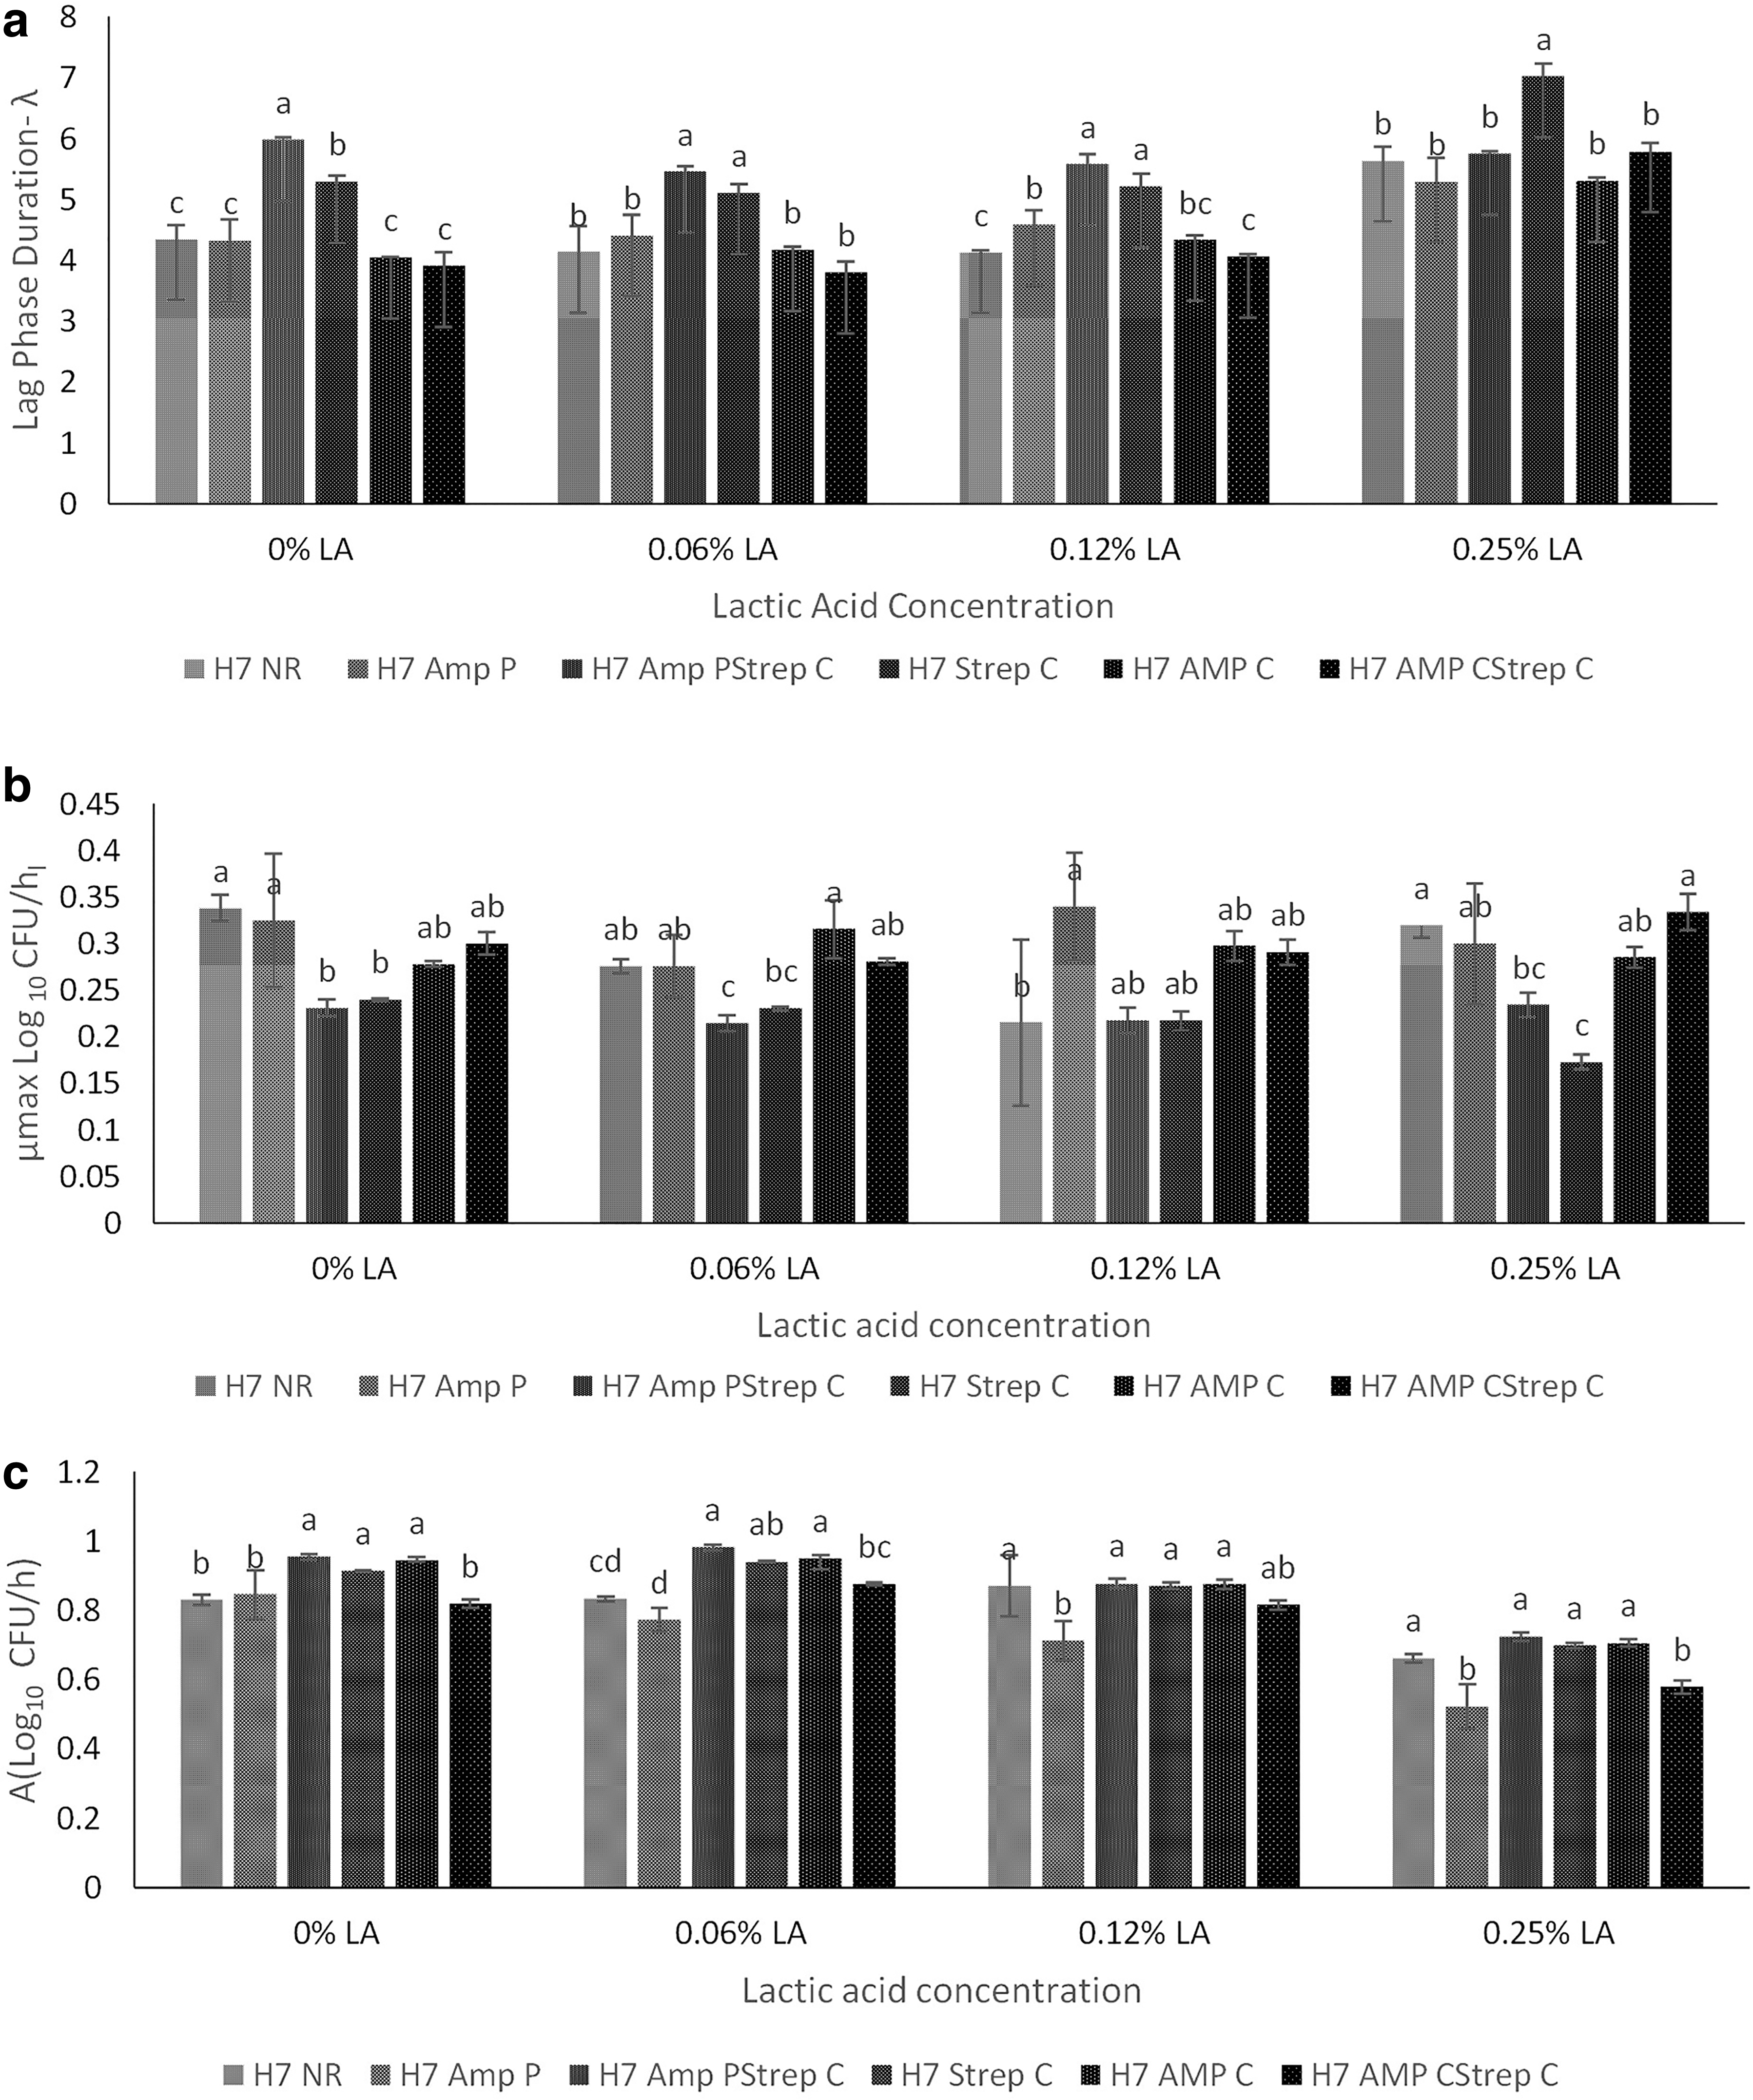
Comparison of growth parameters.
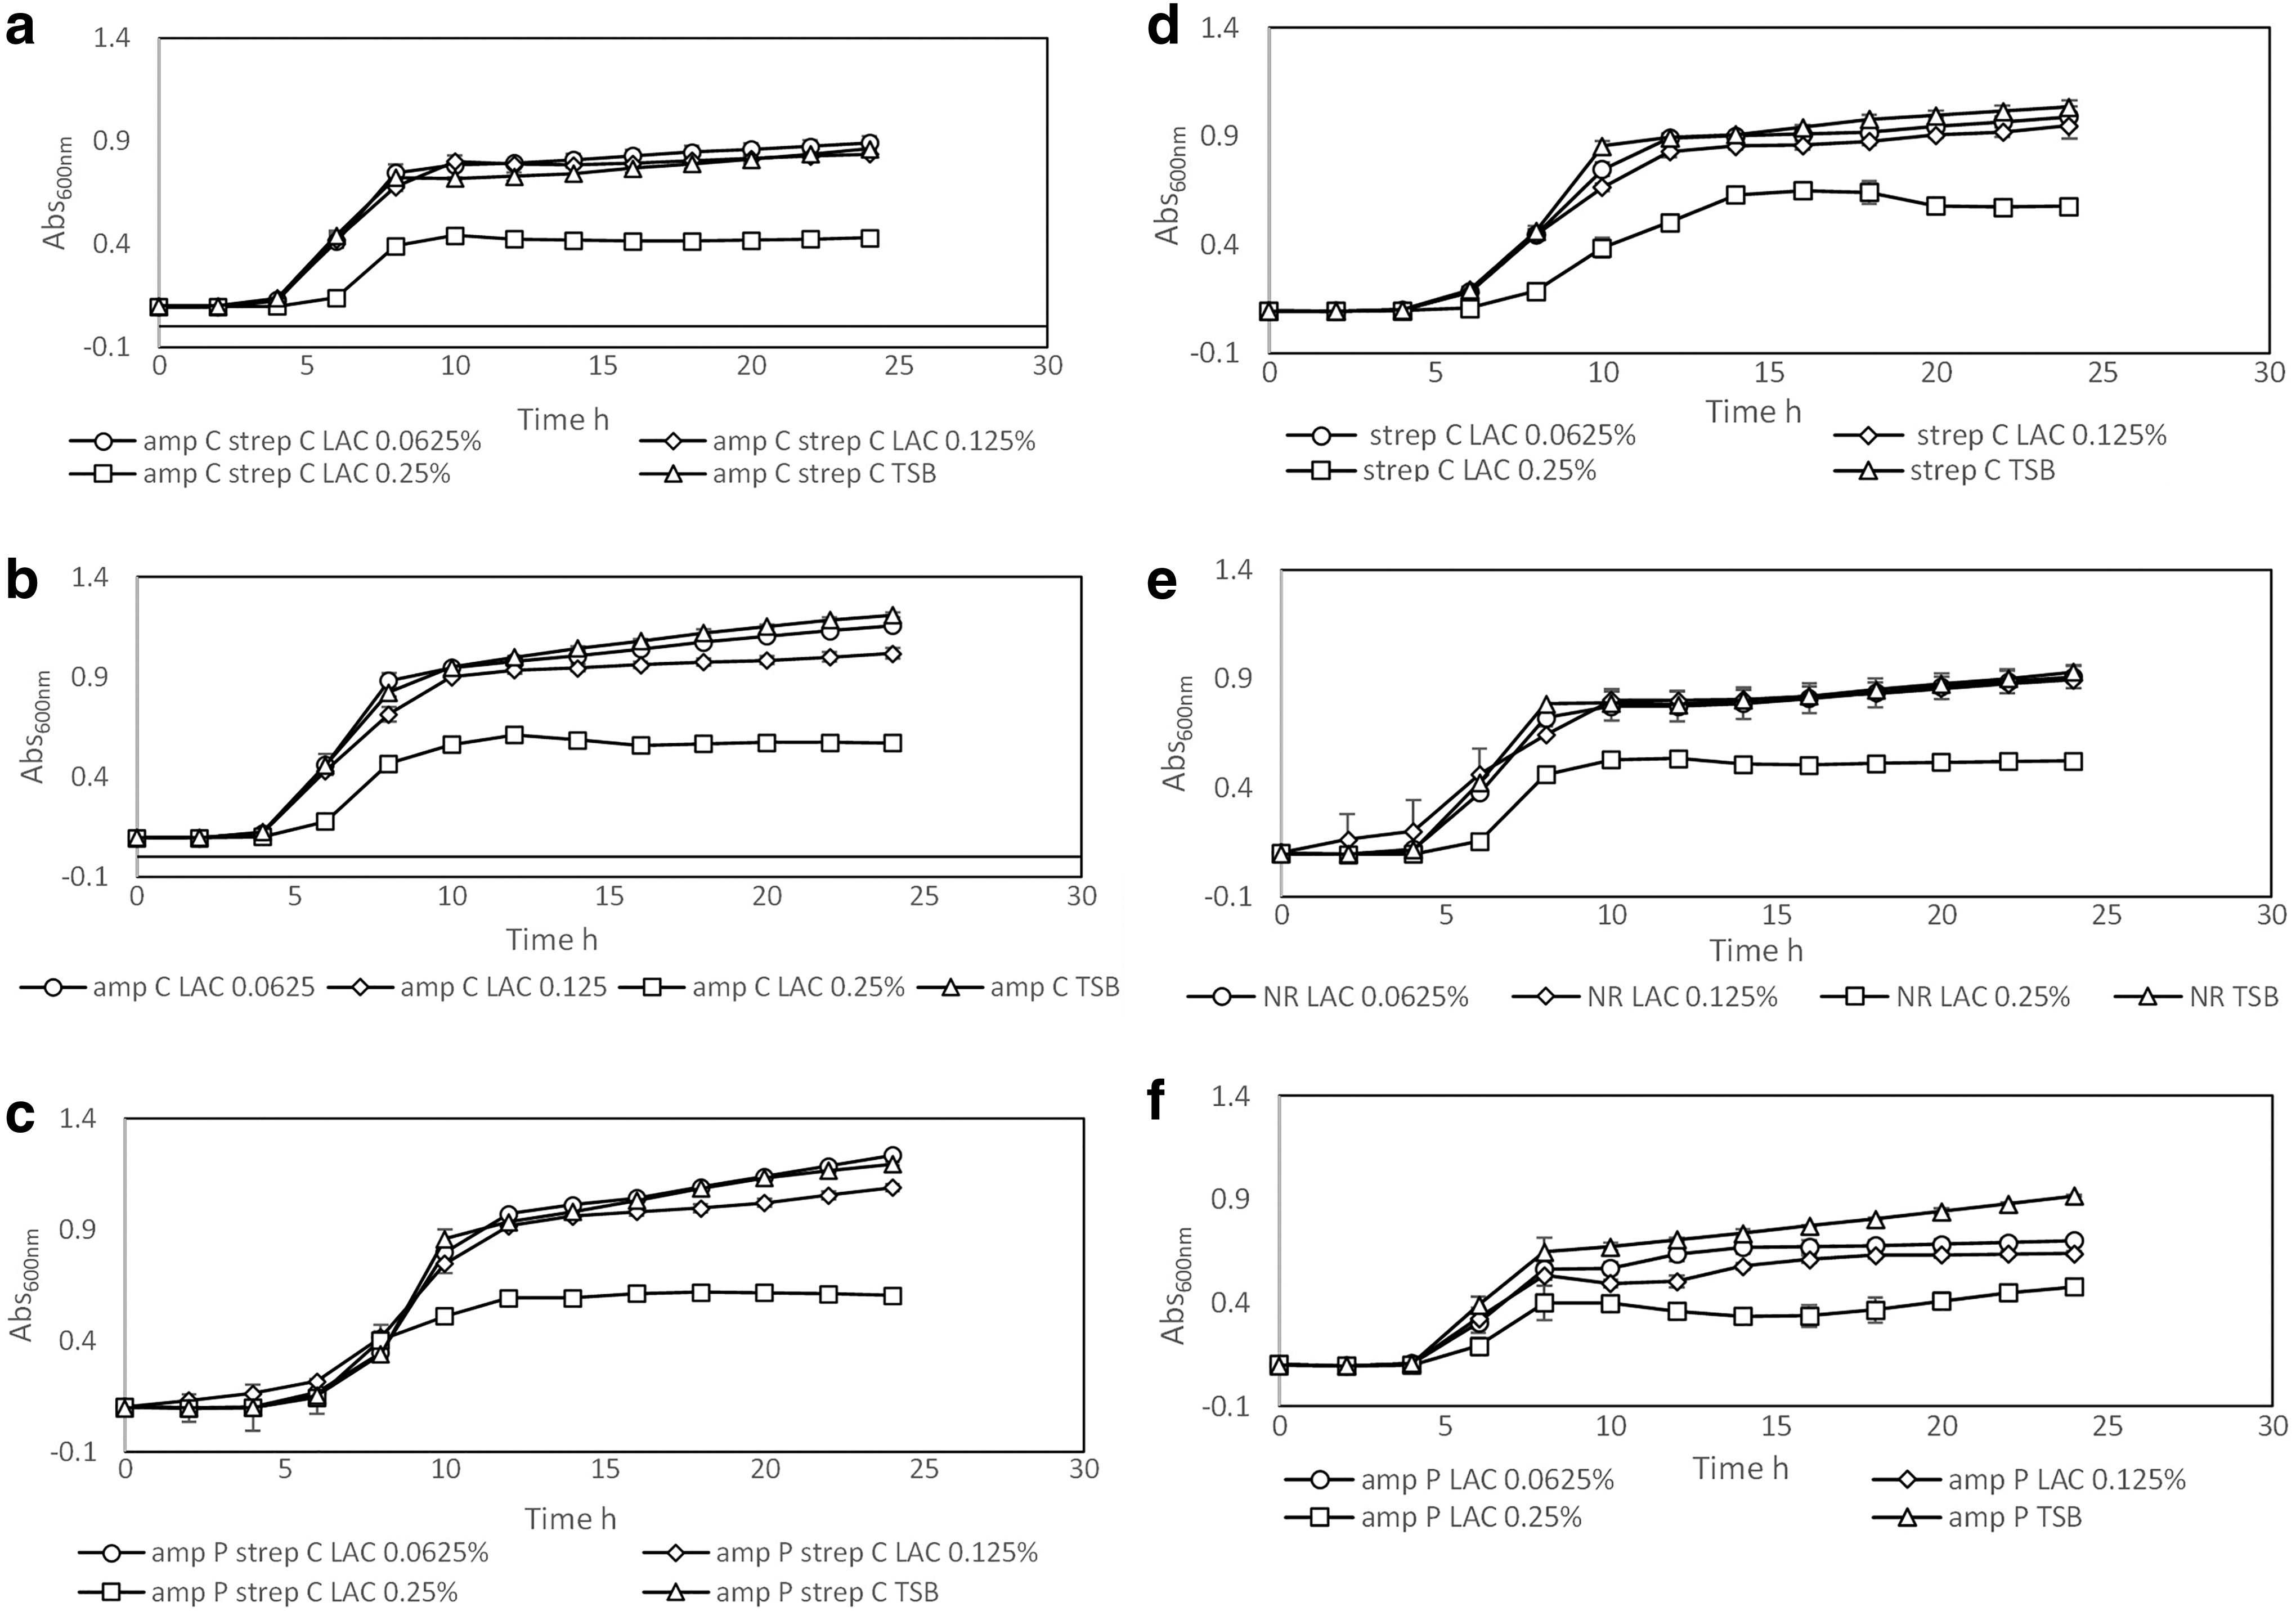
Growth of Escherichia coli O157:H7 H1730 strains.
A strong positive correlation between an increase in the lag phase duration and concentration of LA in the medium was observed in the NR (r = 0.77), ampP (r = 0.79), strepC (r = 0.84), ampC strepC (r = 0.89), and ampC (r = 0.95) strains. Although a negative correlation was calculated between LA concentration and lag phase duration for the ampP strepC strain (r = −0.18), the correlation was small, and lag phase duration was not significantly different for different LA concentrations.
Only strepC (r = 0.01) and ampP strepC (r = 0.22) strains demonstrated a positive correlation between maximum specific growth rate (μ max) and LA concentration. In the presence of 0.0625% and 0.125% LA, the ampP strepC strain had the longest lag phase duration, but in the presence of 0.25% LA, the longest lag phase duration was observed for strepC.
Evaluation of strain tolerance to LA
The pH of TSB amended with 2.5% v/v LA was 2.76 ± 0.001. The decline in population among E. coli O157:H7 strains exposed to 2.5% v/v LA (Fig. 3) differed significantly (p < 0.05). The NR and ampC strepC strains had the highest population decline of 2.74 ± 0.61 and 3.54 ± 0.82 log CFU/mL, respectively, postexposure to 2.5% v/v LA (p < 0.05).

Comparison of survival among Escherichia coli O157:H7 H1730 strains after exposure to 2.5% and 5% v/v LA for 30 s. Significant differences in survival have been denoted by different alphabets.
The ampC and ampP strepC strains had the least population decline of 0.50 ± 0.20 and 0.17 ± 0.16 log CFU/mL, respectively (p < 0.05), after exposure to 2.5% v/v LA. After exposure to 5% v/v LA, the strepC, NR, and ampP strains had the highest decreases in population of 6.22 ± 0.04, 5.92 ± 0.07, and 5.80 ± 0.09 log CFU/mL, respectively (p < 0.05). The pH of TSB amended with 5% v/v LA was 2.50 ± 0.02.
The highest tolerance to 5% v/v LA was observed in the ampC strain, followed by ampP strepC and ampC strepC, with population declines of 2.56 ± 0.21 log CFU/mL (p < 0.05), 2.86 ± 0.08, and 3.54 ± 0.82, respectively.
Viability of E. coli O157:H7 after exposure to LA
The percentage of live cells present in the samples after exposure to 5% v/v LA for 30 s was evaluated (Fig. 4). The ampP strepC and ampC strains had the highest percentage of live cells of 94.00% ± 14.88% and 76.99 ± 8.91, respectively (p < 0.05). The percentage of live cells observed in ampP (54.78% ± 12.53%), NR (44.01% ± 6.51%), and strepC (43.10% ± 2.82%) strains did not differ significantly from ampC strepC (37.34% ± 0.89%), which had the least percentage of live cells (p > 0.05).

Percentage of live cells among strains after exposure to 5% v/v LA for 30 s cells with significant differences in live cells after treatment, which are denoted by different alphabets.
Role of efflux pumps in antimicrobial cross-tolerance
In the presence of CCCP, all three strains demonstrated higher susceptibility to 2.5% LA (Fig. 5) (p ≤ 0.05). Exposure to 2.5% LA resulted in bacterial population decreases of 0.63 ± 0.15, 0.39 ± 0.17, and 3.44 ± 0.40 log CFU/mL in ampC, ampP strepC, and NR (p ≤ 0.05) strains, respectively. The synergistic tests performed with 2.5% LA+CCCP resulted in significant decreases among all three strains.

Comparison of acid tolerance of the H7 NR, H7 ampC, and H7 ampP strepC strains with and without the presence of CCCP. CCCP, carbonyl cyanide m-chlorophenylhydrazone.
Both ampC and NR populations decreased to values below the limit of detection, while ampP strepC decreased by 2.90 ± 0.48 log CFU/mL (p ≤ 0.05).
Discussion
The food supply chain has been identified as a potential source of antibiotic-resistant bacterial strains and genes (Begum et al., 2018; Oniciuc et al., 2019). STEC has been commonly associated with cattle and produce fertilized or irrigated with cattle manure or farm runoff, respectively (Johnson et al., 2003; Fremaux et al., 2008). The use of medically important antibiotics to treat diseases and promote growth in cattle has resulted in antibiotic-resistant strains of E. coli O157:H7 being isolated from cattle and ground beef.
The isolation of E. coli O157:H7 resistant to ampicillin and streptomycin in isolates with multidrug resistance to streptomycin, sulfonamide, and tetracycline (AMR-SSuT) (Galland et al., 2001; Begum et al., 2018) from beef even after the use of antimicrobial interventions (Castillo et al., 2001; Galland et al., 2001) alludes to the potential of AMR-associated LA cross-tolerance.
Tolerance can be defined as the ability to sustain increased duration of exposure to an antimicrobial (Brauner et al., 2016; Levin-Reisman et al., 2019). The results from this study indicate that no differences among the strains were observed in their ability to resist and grow in the presence of LA, while significant differences were observed among the strains in their tolerance to LA.
Growth parameters of the strains were compared at sub-MICs of LA. Among all the strains evaluated, strepC had the longest lag phase duration for all three sub-MICs of LA tested and the lowest maximum specific growth rate (μ max) when grown in the presence of 0.25% LA. The highest decrease in population after exposure to 5% LA v/v among all the strains tested was also for strepC.
The ampC, ampP strepC, and ampC strepC strains were the most tolerant to 5% LA exposure for a duration of 30 s. Extended lag phase duration has been observed in cells that develop tolerance to an antibiotic (Fridman et al., 2014), but this phenomenon was not observed for cross-tolerance to antimicrobial sanitizers such as LA in E. coli O157:H7.
MDK99 is defined as the minimum duration for killing 99% of cells and is an important parameter for detecting tolerance. Both culture-based and viability staining methods were used to study the susceptibility of strains to lactic acid. While a 99% decrease (2 log) was observed in all the strains exposed to 5% LA, viability staining indicated the presence of viable cells after all the treatments. The differences in plate counts and viability assays could have occurred due to transition to a stationary phase by the cells during exposure to LA, resulting in reduced growth on the plating media (Fridman et al., 2014).
Strains with higher tolerance to LA were resistant to ampicillin and streptomycin. LA efflux pump activity in bacteria can result in tolerance to sanitizers (Deininger et al., 2011; Anes et al., 2015). The use of CCCP to inhibit the energy of efflux pumps (Baron and Rolain, 2018; Menichini et al., 2020) resulted in significantly higher susceptibility to 2.5% LA in NR and ampC. The ampP strepC strain had higher tolerance to synergistic exposure to LA and CCCP than the other two strains.
Overexpression of efflux pumps might contribute to increased tolerance to antimicrobials (Camp et al., 2021) in certain strains. More work is required to elucidate the mechanism of LA tolerance in the ampP strepC strain.
Conclusions
The results from this study highlight the risks associated with antibiotic-associated sanitizer cross-tolerance in bacterial foodborne pathogens.
Footnotes
Disclosure Statement
No competing financial interests exist.
Funding Information
This work was financially supported by the GA Beef Commission, Georgia Department of Agriculture.