




Abstract
Since the number of studies of the microbial communities related to food and food-associated matrices almost completely reliant on next-generation sequencing techniques is rising, evaluations of these high-throughput methods are critical. Currently, the two most used sequencing methods to profile the microbiota of complex samples, including food and food-related matrices, are the 16S ribosomal RNA (rRNA) metabarcoding and the whole metagenome sequencing (WMS), both of which are powerful tools for the monitoring of foodborne pathogens and the investigation of the microbiome. Herein, the microbial profiles of 20 bulk tank milk filters from different dairy farms were investigated using both the full-length 16S (FL-16S) rRNA metabarcoding, a third-generation sequencing method whose application in food and food-related matrices is yet in its infancy, and the WMS, to evaluate the correlation and the reliability of these two methods to explore the microbiome of food-related matrices. Metabarcoding and metagenomic data were generated on a MinION platform (Oxford Nanopore Technologies) and on a Illumina NovaSeq 6000 platform, respectively. Our findings support the greater resolution of WMS in terms of both increased detection of bacterial taxa and enhanced detection of diversity; in contrast, FL-16S rRNA metabarcoding has proven to be a promising, less expensive, and more practical tool to profile most abundant taxa. The significant correlation of the two technologies both in terms of taxa diversity and richness, together with the similar profiles defined for both highly abundant taxa and core microbiomes, including Acinetobacter, Bacillus, and Escherichia genera, highlights the possible application of both methods for different purposes. This study allowed the first comparison of FL-16S rRNA sequencing and WMS to investigate the microbial composition of a food-related matrix, pointing out the advantageous use of FL-16S rRNA to identify dominant microorganisms and the superior power of WMS for the taxonomic detection of low abundant microorganisms and to perform functional analysis of the microbial communities.
Introduction
Recent developments in next-generation sequencing (NGS) technologies, together with the reduction in costs and the rise in efficiency, have led to an increase in the number of metabarcoding and metagenomic investigations in different matrices and niches. Two main strategies can be used for the analysis of microbial communities with NGS techniques: whole metagenome sequencing (WMS), also referred to as shotgun metagenomic sequencing, and high-throughput 16S ribosomal RNA (rRNA) metabarcoding. Several studies reported on the bovine milk microbiota arising from its association with the quality and safety of dairy products (Addis et al, 2016; Rubiola et al, 2020) and more often than not 16S rRNA metabarcoding was applied.
The 16S rRNA gene is ∼1600 bp and includes nine hypervariable loci (denoted V1–V9) (Bukin et al, 2019). The 16S rRNA metabarcoding relies on a combination of amplification followed by sequencing of the 16S rRNA gene variable regions, thereby allowing the taxonomic classification and determination of the relative abundance of the bacterial component within a sample. This targeted approach is considered a robust and well-characterized method, and has some advantages over shotgun metagenomic sequencing; indeed, it is less expensive than WMS and it does not require the same level of sequencing depth to obtain a proper characterization of the microbiota.
Besides, as it is based on a targeted amplification, this technique is not affected by the presence of host (bovine) DNA, which characterizes milk and dairy products, and data analysis does not require intensive computational power; a wide range of commonly used bioinformatics tools and pipelines for taxonomy and functional analysis are available to facilitate reproducible and modular analysis of 16S rRNA sequencing data in free software platforms, such as QIIME2 (Bolyen et al, 2019) and Mothur (Schloss et al, 2009). Nonetheless, some limitations of this approach are recognized, including 16S rRNA metabarcoding does not provide functional information about the genes encoded by those microbial communities being investigated (Biegert et al, 2021) and it has a low taxonomic resolution, usually limited to family or genus level.
In addition, different reference databases [e.g., GreenGenes (DeSantis et al, 2006), SILVA (Quast et al, 2013), the Ribosomal Database Project (Cole et al, 2014)] can influence the sample taxonomy outcomes of the 16S rRNA metabarcoding (Abellan-Schneyder et al, 2021), which is furthermore affected by a loss of diversity due to polymerase chain reaction (PCR) bias (Addis et al, 2016). Indeed, different 16S rRNA hypervariable regions exhibit differences in their ability to resolve taxa, and the choice of primer designs used is crucial, as the amplification of some regions has been shown to exhibit a bias resulting in over- or under-representation of specific taxa (Laudadio et al, 2018).
Among commonly targeted 16S rRNA loci, the V3–V4 and V4–V5 are the most widely used and their different outcomes in terms of bacterial taxa distribution and alpha diversity have been recognized in different matrices, including biological and environmental samples (Cuccato et al, 2021; Rintala et al, 2017; Soriano-Lerma et al, 2020), as well food matrices, dairy products, and fermented foods (Choi et al, 2020; Ferrocino et al, 2017; Liu et al, 2019; Macori and Cotter, 2018).
As the short length of the targeted 16S rRNA loci represents one of the limitations for taxa identification below the family level, in recent years third-generation sequencing technologies facilitating long-read sequencing has been developed, enabling full-length 16S (FL-16S) gene sequencing (Catozzi et al, 2020); although platforms supporting these techniques, including Pacific Biosciences (PacBio) sequencers and Oxford Nanopore Technologies (ONT) devices, generate read data with lower nucleotide accuracy when compared with the Illumina platforms, reading the FL-16S gene sequence can have better classification resolution (Jeong et al, 2021), as confirmed in recent studies applying this sequencing technique on mock communities and complex matrices such as wastewater samples (Numberger et al, 2019), human feces (Leggett et al, 2017; Matsuo et al, 2021) and water buffalo milk (Catozzi et al, 2020).
In contrast, shotgun metagenomic sequencing confers several advantages over 16S rRNA metabarcoding. First and foremost this strategy can provide functional information about the investigated microorganisms; furthermore, it provides an improved profile of the diversity of the sample and can reach taxa resolution at the species level (Biegert et al, 2021). In this case, whole metagenomic DNA is first extracted, fragmented, and then sequenced, independent of the amplification of targeted genes ( Addis et al, 2016). Thus, a large amount of data are generated to be interrogated for features, including the taxonomic profile of the microbial community, its metabolic pathways and functions.
Despite these advantages, some limitations are also recognized, including the computational power required, tools and expertise necessary to properly analyze the data generated; partial sequencing of those less represented microorganisms, while background host DNA can be present in significant amounts, especially in host-derived samples including milk and dairy products, requiring the use of different molecular and bioinformatic tools to mask these features, such as pre-extraction methods applying commercially available kits or chemicals to lyse mammals cells, and post-extraction methods enriching microbial DNA by selectively binding and removing CpG-methylated host DNA (Rubiola et al, 2020; Yap et al, 2020).
Finally, the shotgun metagenomic sequencing technique is usually more expensive when compared with 16S rRNA metabarcoding and requires a higher coverage (Catozzi et al, 2020). Comparison between WMS and short-read 16S rRNA metabarcoding has been recently explored in different matrices, especially soil and stool samples targeted to investigate the gut microbiome (Brumfield et al, 2020; Durazzi et al, 2021; Jovel et al, 2016; Laudadio et al, 2018; Shah et al, 2011; Tessler et al, 2017); indeed, the extent to which these two sequencing technologies correlate with each other is a crucial assumption, which should be investigated in depth. However, food and food-related matrices have been poorly investigated using both these sequencing techniques; furthermore, the comparison between WMS and FL-16S sequencing is still unexplored. In this context, several studies have suggested the use of milk filters as useful tools to investigate the microbiome of bulk tank milk and to identify the presence of foodborne pathogens (Murphy et al, 2005; Sonnier et al, 2018).
To fill the aforementioned knowledge gap, in this study milk filters sampled in the context of a previous work aiming to evaluate the milk production environment resistome were reanalyzed using both the FL-16S rRNA metabarcoding and WMS to compare the microbial community profiles and evaluate the reliability of these two methods to explore the microbial communities of food-related matrices.
Materials and Methods
Farms selection, samples collection, and DNA extraction
The samples were collected in May 2020 from the bulk tank of 10 dairy farms located in Piedmont, North-West Italy, with the support of ARAP (Associazione Regionale Allevatori del Piemonte) as described by Rubiola et al. (2022). The sampling procedure included the use of disposable in-line milk filters that were taken from the bulk tank of each farm under aseptic conditions, then inserted in sterile plastic sampling bags (Whirl-Pack; NASCO) and transported in controlled temperature to the Laboratory of Food Inspection—Department of Veterinary Science, University of Turin—where DNA extraction was performed immediately. The sampling was repeated in May 2021, for a total of 20 milk filters.
Upon arrival at the laboratory, 10 g of each milk filter was added to 90 mL of sterile buffered saline solution (Ringer's solution; Oxoid, Basingstoke, United Kingdom) in a sterile stomacher bag and homogenized for 2 min at 230 rpm in a stomacher (Seward Stomacher Blender 400, London, United Kingdom). Total DNA was then extracted from filter homogenates using the DNeasy Blood and Tissue Kit (QIAGEN, Hilden, Germany), with minor adjustments. Samples were centrifuged for 10 min at 100 × g to pellet and discard eukaryotic cells; milk serum was then centrifuged at 13,000 × g for 15 min at 4°C to pellet prokaryotic cells and pellets recovered resuspended in phosphate-buffered saline (PBS; Oxoid).
Isolation of genomic DNA was then performed following the manufacturer's protocol, including the recommended modification for Gram-positive bacteria (Schwenker et al, 2022); DNA was eluted in 50 μL 10 mM Tris-HCl buffer (pH 8.5) and frozen at −20°C until analyzed. Template DNA of each sample was quantified using a Qubit 2.0 Fluorometer (Life Technologies, Carlsbad, CA) with the Qubit double-stranded DNA (dsDNA) high-sensitivity assay kit. DNA integrity and purity were verified by conventional 2% agarose gel electrophoresis and also using a NanoDrop spectrophotometer (ThermoFisher Scientific). Samples meeting quality criteria were submitted for FL-16S rRNA metabarcoding and WMS.
DNA sequencing
Purified DNA was submitted to both FL-16S gene sequencing and WMS. Library preparation for FL-16S was carried out starting from 10 ng of purified DNA from each sample using the 16S Barcoding Kit 1–12 (SQK-RAB204; ONT), following the manufacturer's instruction, which includes the generation of FL-16S rRNA genes amplicons using primers 27F (5′-AGAGTTTGATCMTGGCTCAG-3′) and 1492R (5′-TACGGYTACCTTGTTACGACTT-3′) starting with 10 μL input DNA (10 ng), 1 μL 16S Barcode, at 10 μM, 25 μL LongAmp Taq 2X master mix (NEB). The amplification was conducted using the following cycling conditions: initial denaturation 1 min at 95°C (1 cycle); denaturation 20 s at 95°C (25 cycles); annealing 30 s at 55°C (25 cycles); extension 2 min at 65°C (25 cycles); final extension 5 min at 65°C (1 cycle). The samples were processed following the manufacturer's instruction with no modifications. Pooled libraries were then sequenced on a MinION platform (ONT) using Flongle (FLO-FLG001) flow cells (ONT) for 24 h.
WMS DNA library preparation was carried out according to the NEBNext Ultra II DNA Library Prep Kit for Illumina (New England Biolabs, Ipswich, MA); four PCR cycles were used to amplify the library. Libraries quality and fragment lengths were determined using the Agilent Bioanalyzer 2100 and the High-Sensitivity DNA kit (Agilent Technologies, Santa Clara, CA).
The samples were sequenced on the Illumina NovaSeq 6000 platform using an S2 flow cell (Illumina, San Diego, CA) with a 150-cycles paired-end (PE) chemistry, generating 50 million PE reads for each sample.
Bioinformatic and statistical analyses
FL-16S base-calling was performed using Guppy (version 5.0.15) and Flye (version 2.9) was used as de novo assembler.
The Fastp tool (Chen et al, 2018) was used to remove reads shorter than 1000 bp and those reads retained thereafter filtered on a minimum average read quality score of 9, according to the recommendations from Nygaard et al (2020). Processed sequencing data quality was assessed with MultiQC v1.11 (Ewels et al, 2016). Taxonomic classification was performed using Kraken2 v2.1.2 (Wood et al, 2019) and Bracken v2.5.0 (Lu et al, 2017) (threshold = 10) with the National Center for Biotechnology Information (NCBI) NT database.
Raw reads generated by WMS were quality assessed using FastQC v.0.11.9 (
Relative abundance tables for all samples were merged and imported into MicrobiomeAnalyst (Chong et al, 2020) for statistical and diversity analysis. Data from both WMS and FL-16S were analyzed using alpha diversity metrics to assess the divergence of the microbial communities within each filter sample. Shannon Diversity (Mouillot and Leprêtre, 1999) and Simpson Diversity indexes were calculated from the observed operational taxonomic unit (OTU) counts for FL-16S and WMS data after centered log-ratio (clr) normalization. Rarefaction curves were generated to assess the saturation of samples analyzed using the WMS and FL-16S sequencing.
To perform a comparative statistical analysis of FL-16S and WMS data, each sample value from each data set was paired with its corresponding value for the same sample in the other data set. The pairwise Spearman's correlation test was applied to investigate the amount of agreement between the two data sets, including alpha diversity measures, richness (observed OTUs), and indexes of Shannon's and Simpson's diversity. The composition of the core microbiome was assessed at genus and family levels for FL-16S and WMS data sets using 50% and 1% cutoff values for occurrence and relative abundance of the OTUs, respectively (Neu et al, 2021); the abundance of shared OTUs was visualized using heatmaps and Venn diagrams.
Results
Shotgun metagenomic sequencing yielded 1.06 billion reads, with an average of 53.1 million reads per sample (range 44.8–76.8 million); out of 1.06 billion reads, a total of 6.2 million were identified at the bacterial and archaeal phyla level. FL-16S sequencing resulted in 166.928 reads, with an average of 8.346 reads per sample (range 2.759–30.168).
The number of observed OTUs gained from WMS was found to be higher in comparison with FL-16S sequencing data sets at each taxonomic level. In particular, at the family level, the number of families detected by WMS was significantly greater compared with the number of families detected by FL-16S sequencing (p < 0.001, t-test), ranging from 7 to 37 OTUs per sample for FL-16S (mean 24.9) and from 227 to 301 OTUs per sample for WMS (mean 278,9); similarly, at the genus level, the number of annotated genera observed by WMS was significantly greater compared with the number of genera detected by FL-16S sequencing (p < 0.001, t-test), ranging from 12 to 64 OTUs per sample for 16S sequencing (mean 41,2) and from 614 to 850 OTUs per sample for WMS (mean 779.7).
The number of genera and families identified in each sample by the two sequencing techniques are reported as boxplots in Figure 1. Alpha diversity patterns were calculated at the family and genus level using Shannon's and Simpson's indexes (Fig. 1). At the family level, across samples analyzed by WMS, both Shannon index alpha diversity and Simpson index alpha diversity were significantly greater than alpha diversity values of samples analyzed by FL-16S sequencing (difference between means = 1.138 ± 0.1926, 95% confidence interval, [CI] 0.7483–1.528, p < 0.0001; difference between means = 0.1324 ± 0.04367, 95% CI 0.04396–0.2208, p < 0.005, t-test).
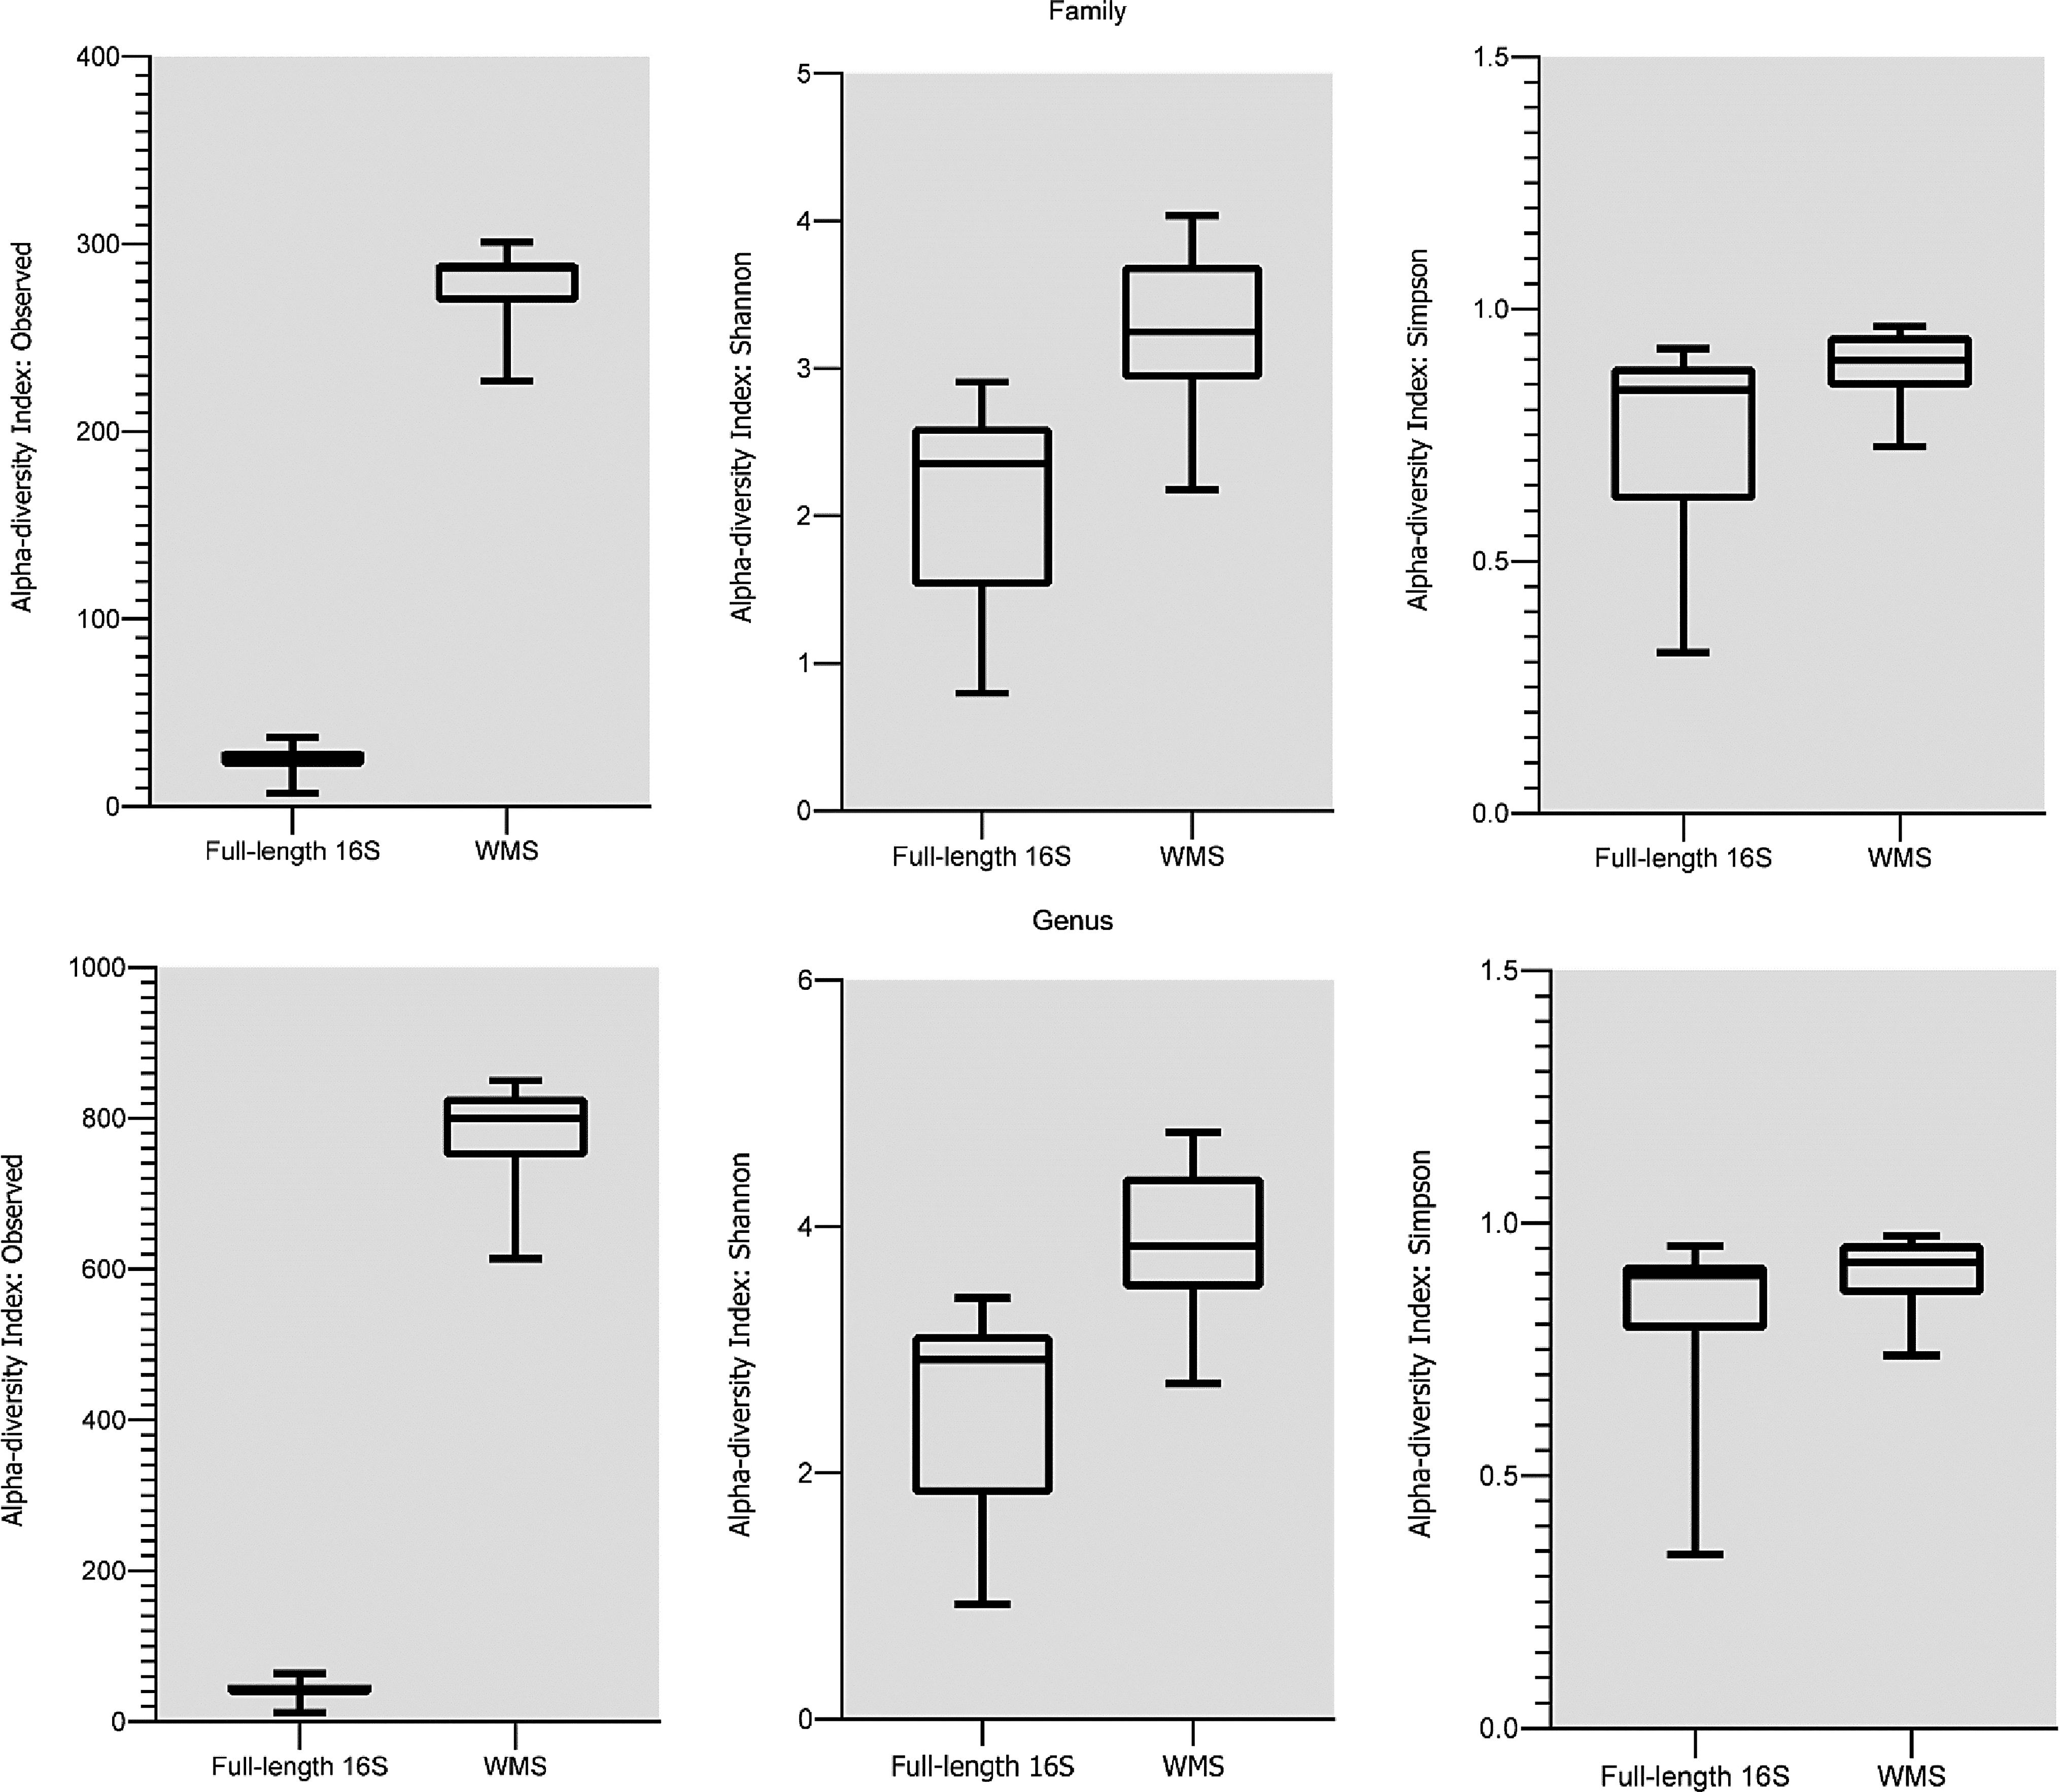
Boxplots showing the number of OTUs, the Shannon and Simpson alpha-diversity indexes observed at the family and genus level. All indexes showed a statistically significant difference between the mean measures observed in samples analyzed by FL-16S and WMS. FL-16S, full-length 16S; OTU, operational taxonomic unit; WMS, whole metagenome sequencing.
Similarly, at the genus level, across samples analyzed by WMS, both Shannon index alpha diversity and Simpson index alpha diversity were significantly greater than alpha diversity values of samples analyzed by FL-16S sequencing (difference between means = 1.238 ± 0.2132, 95% CI 0.8069–1.670, p < 0.0001; difference between means = 0.07861 ± 0.03808, 95% CI 0.001535–0.1557, p < 0.05, t-test). Thus, both the observed Shannon index alpha diversity values and the Simpson index alpha diversity values were greater for samples analyzed by WMS compared with samples analyzed by FL-16S sequencing at each taxonomic level. Rarefaction curves showed that almost all samples reached the asymptote or started to plateau despite the different techniques applied (Supplementary Fig. S1).
The top 10 most abundant genera profiled across the 20 samples by FL-16S sequencing and WMS corresponded to Acinetobacter, Lactococcus, Escherichia, Streptococcus, Staphylococcus, Bacillus, Corynebacterium, Pseudomonas, Lactobacillus, and Clostridium (Fig. 2). Most of the highly abundant genera detected per farm were detected by both FL-16S and WMS; however, different relative abundances were observed, mainly due to the overall lower number of OTUs annotated by full-length sequencing, consistently with the results of richness and diversity indexes.

The top-10 most abundant genera identified across the 20 samples analyzed after centered-log-ratio normalization; genera with a lower relative abundance are binned into “others” category. Samples are organized by farm and year of sampling.
All the diversity and richness measures, including observed OTUs, Shannon and Simpson diversity indexes, were tightly correlated between FL-16S sequencing and WMS, at both the family (Observed OTUs Spearman R = 0.6, p = 0.005; Shannon Spearman R = 0.75, p = 0.0002; Simpson Spearman R = 0.6, p = 0.006) and genus level (Observed OTUs Spearman R = 0.68, p = 0.0008; Shannon Spearman R = 0.66, p = 0.001; Simpson Spearman R = 0.52, p = 0.01) (Fig. 3).

Correlation between WMS and FL-16S in terms of diversity at family and genus level. Each data point represents a single sample. Consensus between both sequencing methods in terms of alpha diversity was calculated by Spearman's correlation. The slope of the correlation is represented by the gray continuous line, whereas the 95% confidence interval is represented by the area delimited by the gray dotted lines. The data derived from FL-16S sequencing correlate well with the diversity assessment values derived from WMS for diversity.
The presence of a core microbiome common to the sampled milk filters was confirmed in both samples analyzed by FL-16S sequencing and WMS. Out of 361 families detected across all samples, 13 families were found in the core microbiome associated with milk filters analyzed by FL-16S sequencing and 13 families were found in the coremicrobiome associated with milk filters analyzed by WMS; 4 of them were shared between the 2 core microbiomes, namely Moraxellaceae, Enterobacteriaceae, Bacillaceae, and Streptococcaceae.
Consistently, of the 1078 genera identified across all samples, 13 were found in the core microbiome associated with milk filters analyzed by FL-16S sequencing, namely Acinetobacter, Escherichia, Staphylococcus, Lactococcus, Bacillus, Streptococcus, Aerococcus, Clostridioides, Lactobacillus, Clostridium, Oscillibacter, and Paeniclostridium, 8 were found in the core microbiome associated with milk filters analyzed by WMS, namely Acinetobacter, Corynebacterium, Bifidobacterium, Actinoalloteichus, Pseudomonas, Bradyrhizobium, Escherichia, and Bacillus, and three were shared between the two core microbiomes, that is Acinetobacter, Escherichia, and Bacillus (Fig. 4).

Core heatmaps and Venn diagrams showing bacterial families and genera detected in >50% of samples with >1% of relative abundance. Four OTUs at both family and genus levels were detected in all samples by FL-16S sequencing and WMS, thereby representing the shared core microbiome.
Discussion
The two most used sequencing methods to profile the microbiota of complex samples, including food and food-related matrices, are the 16S metabarcoding and shotgun metagenomic sequencing. Both these NGS techniques offer different advantages over culture-based methods; the 16S metabarcoding has been used more frequently mainly due to its low cost, low computational power requirements, and standardized analysis methods, WMS is becoming more attractive for in-depth studies of microbial populations due to the large amount of information provided by this untargeted sequencing technique, which facilitates study of the functional profile of complex microbiomes. Recently, comparisons between high-throughput 16S rRNA sequencing and WMS have been performed in selected matrices, including gut, soil, and water samples (Brumfield et al, 2020; Ranjan et al, 2016; Tessler et al, 2017).
However, food and food-related matrices are poorly investigated for several reasons, including the large amount of host DNA that characterizes these samples might greatly interfere with different sequencing techniques; those comparative studies performed have been based on selected hypervariable loci within the 16S rRNA gene, while the FL-16S sequencing has proved to allow a less biased study of different microbial ecosystems (Catozzi et al, 2020). This study reports on the comparison of FL-16S and WMS to investigate the microbial population of bulk tank milk filters, both of which are powerful tools for the monitoring of foodborne pathogens and the investigation of the microbiome of bulk tank milk.
Although 16S metabarcoding is a promising, less expensive, and more practical tool to investigate the microbiome when compared with WMS, in this study it allowed the identification of only most abundant microorganisms in the biological samples investigated. Consistently, some previous studies highlighted a significant amount of agreement between 16S metabarcoding and WMS methods at a higher order of taxa, with a high degree of correlation found between 16S and WMS (Biegert et al, 2021; Vogtmann et al, 2016). Our findings support the greater resolution of WMS in terms of both increased detection of bacterial taxa and enhanced detection of diversity; the superior richness in the profiles of microbes obtained and their diversity must also be weighted with the already known advantages related to the possibility of investigating the function of predicted genes.
Our results are in accordance with studies analyzing human fecal (Ranjan et al, 2016) and soil (Brumfield et al, 2020) microbiomes, which, despite investigating targeted hypervariable regions of the 16S rRNA gene, revealed a greater diversity of microorganisms through the use of WMS. In this context, it must be stated that the actual composition of the microbiome of analyzed milk filter samples was unknown; thereby, our approach, while enabling us to draw some conclusions on sensitivity, does not enable the evaluation of the specificity of each sequencing technique. This issue goes beyond the aims of this study and can be addressed using simulated NGS data.
The present investigation of the milk filters' core microbiome through the application of both techniques has allowed the definition of a group of bacterial genera common to all the selected samples; in particular, while different sequencing methods defined different core microbiomes, Acinetobacter, Bacillus, and Escherichia genera were shared between the FL-16S and the WMS cores. Although the microbiota profiles of distinct bulk tank milk filters were different, the presence of a well-defined core microbiome, characterized by both the sequencing technique applied, highlights the possibility to integrate multiple techniques to confirm the consistency of the achieved outcomes.
The overall high occurrence and relative abundance of members of the Moraxellaceae, Enterococcaceae, Bacillaceae, and Streptococcaceae families in milk filters are consistent with the profiled core microbiome of recent studies focusing on raw bovine milk collected in tankers (Kable et al, 2016; McHugh et al, 2020), thereby highlighting the deep correlation of microbial communities of bulk tank milk and microbial communities of in-line milk filters; most of the taxa belonging to the core microbiomes profiled by FL-16S and WMS are known to be associated with dairy-processing environments.
This study set out the use of different high-throughput molecular methods to provide an in-depth description of the microbiota of a food-processing environment using milk filters as promising tools; however, certain limitations must be considered. This research was performed using a small number of samples, although this was sufficient to identify significant differences between the compared methods. Furthermore, a comparison including the most commonly used hypervariable regions of the 16S rRNA gene (e.g., the variable V3 and V4 regions), together with the FL-16S and the WMS approach could provide further data to choose the more suitable method for different scientific purposes.
To our knowledge, this is the first study aiming to compare the use of FL-16S and WMS to investigate the microbial composition of a food-related matrix. Although, as anticipated, the resolution power of WMS has proved to be greater than that provided by 16S sequencing, the significant correlation of the two technologies both in terms of taxa diversity and richness, together with the similar profiles defined for both highly abundant taxa and core microbiomes, highlights the possible application of both methods for different purposes. Thus, our findings suggest that the use of FL-16S to perform large-scale microbiome studies can provide rapid and valuable data at a fraction of the cost of WMS, which, in contrast, is an incomparable tool to perform in-depth studies of the microbiome, including low abundance taxa and functional profiles.
Footnotes
Ethical Statement
This study does not require Institutional Review Board (IRB) approval.
Data Availability Statement
The datasets presented in this study can be found in the following online repository:
Authors' Contributions
Writing—original draft, formal analysis, investigation, and conceptualization by S.R. Writing—review and editing, resources, validation, and conceptualization by G.M. Writing—review and editing, and funding acquisition by T.C. Writing—review and editing, and resources by S.F. Writing—review and editing, and formal analysis by M.M. Writing—review and editing, visualization, supervision, and conceptualization by F.C.
Disclosure Statement
The authors declare that the research was conducted in the absence of any commercial or financial relationships that could be construed as a potential conflict of interest.
Funding Information
This study was supported by Ministero dell'Istruzione, dell'Università e della Ricerca (MIUR) under the programme “Dipartimenti di Eccellenza ex L.232/2016” to the “Department of Veterinary Science, University of Turin.” This study was supported by European Regional Development Funds (FESR 2014-2020—D24I19000980002)—TECH4MILK.
Supplementary Material
Supplementary Figure S1
References
Supplementary Material
Please find the following supplemental material available below.
For Open Access articles published under a Creative Commons License, all supplemental material carries the same license as the article it is associated with.
For non-Open Access articles published, all supplemental material carries a non-exclusive license, and permission requests for re-use of supplemental material or any part of supplemental material shall be sent directly to the copyright owner as specified in the copyright notice associated with the article.

