
Abstract
Multidrug resistant (MDR) Escherichia coli threaten the preservation of antimicrobials to treat infections in humans and livestock. Thus, it is important to understand where antimicrobial-resistant E. coli persist and factors that contribute to its their development. Crossbred cattle (n = 249; body weight = 244 kg ±25 kg standard deviation) were blocked by arrival date and assigned metaphylactic antimicrobial treatments of sterile saline control, tulathromycin (TUL), ceftiofur, or florfenicol at random. Trimethoprim–sulfamethoxazole (COTR) and third-generation cephalosporin (CTXR)-resistant E. coli were isolated from fecal samples on days 0, 28, 56, 112, 182, and study END (day 252 for block 1 and day 242 for block 2). Then, susceptibility testing was conducted on all confirmed isolates. MDR was detected in both COTR and CTXR E. coli isolates. In COTR isolates, the number of antimicrobials each isolate was resistant to and the minimum inhibitory concentration (MIC) for amoxicillin–clavulanic acid, ceftriaxone, and gentamicin was greatest on day 28 compared with all other days (p ≤ 0.04). Similarly, chloramphenicol MIC was greater on day 28 than on day 0 (p < 0.01). Overall, sulfisoxazole MIC was less for TUL than all other treatments (p ≤ 0.02), and trimethoprim–sulfamethoxazole MIC was greater for TUL than all other treatments (p ≤ 0.03). Finally, there was no effect of treatment, day, or treatment × day for tetracycline or meropenem MIC (p ≥ 0.07). In CTXR isolates, there was an effect of day for all antimicrobials tested except ampicillin and meropenem (p ≤ 0.06). In conclusion, administering a metaphylactic antimicrobial at feedlot arrival did influence the susceptibility of COTR and CTXR E. coli. However, MDR E. coli are widely distributed, and the MIC for most antimicrobials was not different from the initial value upon completion of the feeding period.
Introduction
Production of novel antimicrobials is declining among a growing concern for antimicrobial resistance (AMR; CDC, 2019a; Powers, 2004). Globally, by 2050, O'Neill (2016) projects financial losses up to 100 trillion USD and 10 million deaths related to AMR each year. In human medicine, the leading driver of AMR is clinical overuse and misuse. However, utilization of antimicrobials in livestock production is cited also as a potential contributing factor (Innes et al., 2020; Michael et al., 2014).
Metaphylaxis is defined as administration of an antimicrobial to all animals within a group to control spread of disease and decrease incidence of illness if some animals are symptomatic (AVMA, 2021). Most United States and Canadian veterinarians recommend metaphylaxis for high-risk cattle, and as a result ∼21% of U.S. feedlot cattle are given an antimicrobial at arrival (Terrell et al., 2011; USDA, 2011). Some antimicrobials used for metaphylactic treatment of cattle are categorized similarly to those considered as critically important to human medicine by the World Health Organization (USDA, 2011; WHO, 2019). Thus, it is possible antimicrobial use at feedlot arrival could influence AMR of human importance.
Pathogenic Escherichia coli cause 205,000 infections, 2500 hospitalizations, and 20 deaths annually in the United States (Scallan et al., 2011). Furthermore, multidrug resistant (MDR) infections related to extended-spectrum beta-lactamase producing Enterobacteriaceae have increased to 53.3%, of which, E. coli accounted for 86% (Jernigan et al., 2020). During the harvest process, E. coli can contaminate carcasses. As such, E. coli represents a possible reservoir for the spread of MDR pathogens to the human food supply (Bailey et al., 2017). Therefore, our objective was to investigate the association between metaphylactic treatment given to high-risk cattle at feedlot arrival and the longitudinal development of MDR E. coli.
Materials and Methods
This study was executed at the Texas Tech University Burnett Center feedlot from October 2020 to August 2021 and was approved by the Texas Tech University Animal Care and Use Committee (Approval No. 20039-04). All pathogen research and protocols were reviewed and approved by the USMARC Institutional Biosafety Committee as USMARC IBC Projects Nos. 1.0 and 14.0.
Animals and management
As described previously (Coppin et al., 2022), 245 high-risk crossbred beef cattle (average initial body weight [BW] = 244 kg ±25 kg standard deviation) from various locations were blocked into two groups by arrival date. Both groups were sourced from auction blocks (n = 124, group 1; n = 125, group 2). Experimental treatments were grouped together and maintained separately in an empty pen. Metaphylactic antimicrobial treatments administered on day 0 consisted of a sterile saline negative control (CON; 5 mL/animal), florfenicol (FLR; Nuflor; Merck Animal Health; 6 mL, 45 kg/bw), ceftiofur (CEF; Excede; Zoetis, Parsippany, NJ; 1.5 mL, ·45 kg/bw), or tulathromycin (TUL; Draxxin; Zoetis; 1.1 mL, ·45 kg/bw). Treatments of animals for illnesses were described and reported previously (Coppin et al., 2022).
Fecal sampling procedures and sample processing
Fecal grab samples were collected at six timepoints as described by Long (2022) and enumerated for trimethoprim–sulfamethoxazole-resistant E. coli (COTR; 76 mg/L sulfamethoxazole and 4 mg/L trimethoprim) and third-generation cephalosporin-resistant E. coli (CTXR; 2 mg/L cefotaxime; Agga et al., 2016). The National Antimicrobial Resistance Monitoring System was referenced to determine concentrations of antimicrobial added to the selective agar (CDC, 2019b). Colony morphology was used to count each sample for enumeration and isolates were confirmed by polymerase chain reaction (Molina et al., 2015).
Antimicrobial susceptibility testing for fecal isolates
Susceptibility testing was performed for all enumerable E. coli isolates similar to the methods of Agga et al. (2016). Sensititre broth microdilution CMV4AGNF test plates (Thermo Scientific, Waltham, MA) were used to determine the minimum inhibitory concentration (MIC) for each of the 14 antimicrobials according to the manufacturer's protocol with Sensititre ARIS HiQ System (Thermo Scientific). Resistance breakpoints were determined from the NARMS CDC (2019b) report and are as follows: amoxicillin–clavulanic acid (≥32 μg/mL), ampicillin (≥32 μg/mL), azithromycin (≥32 μg/mL), cefoxitin (≥32 μg/mL), ceftriaxone (≥4 μg/mL), chloramphenicol (≥32 μg/mL), ciprofloxacin (≥1 μg/mL), gentamicin (≥16 μg/mL), nalidixic acid (≥32 μg/mL), streptomycin (≥32 μg/mL), sulfisoxazole (≥512 μg/mL), tetracycline (≥16 μg/mL), and trimethoprim–sulfamethoxazole (≥4 μg/mL). Any isolate exhibiting resistance to three or more antimicrobials was determined as MDR.
Statistical analysis
Data expressed as MICs (μg/mL) were converted using a natural log transformation (natural log μg/mL of antimicrobial). PROC MIXED (version 9.4; SAS Inst. Inc., Cary, NC) was used to analyze MIC data. Individual animal was the experimental unit with fixed effects of metaphylactic treatment, time, and metaphylactic treatment × time. Arrival block was the random effect and the Kenward Roger adjustment was used to correct the degrees of freedom for unequal experimental units among treatment groups. Several covariance structures were tested and autoregressive 1 containing animal within pen as the subject resulted in the smallest Akaike and Schwarz Bayesian criteria; thus, it was considered best for the analysis. Simple effect least squares means were presented graphically and 0.05 or less was considered a significant p value.
Results
MDR in enumerable COTR and CTXR E. coli populations
MDR COTR E. coli isolates were detected in samples across all treatments (CON, 23.51%; TUL, 18.40%; CEF, 24.20%; and FLR, 32.78%). There was an effect of day on the number of antimicrobials COTR E. coli were resistant to (p < 0.01; Fig. 1A). The average number for AMRs observed in COTR E. coli isolates was greatest on day 28 (p < 0.01) but was not different for day 0 compared with study END (p = 0.29).
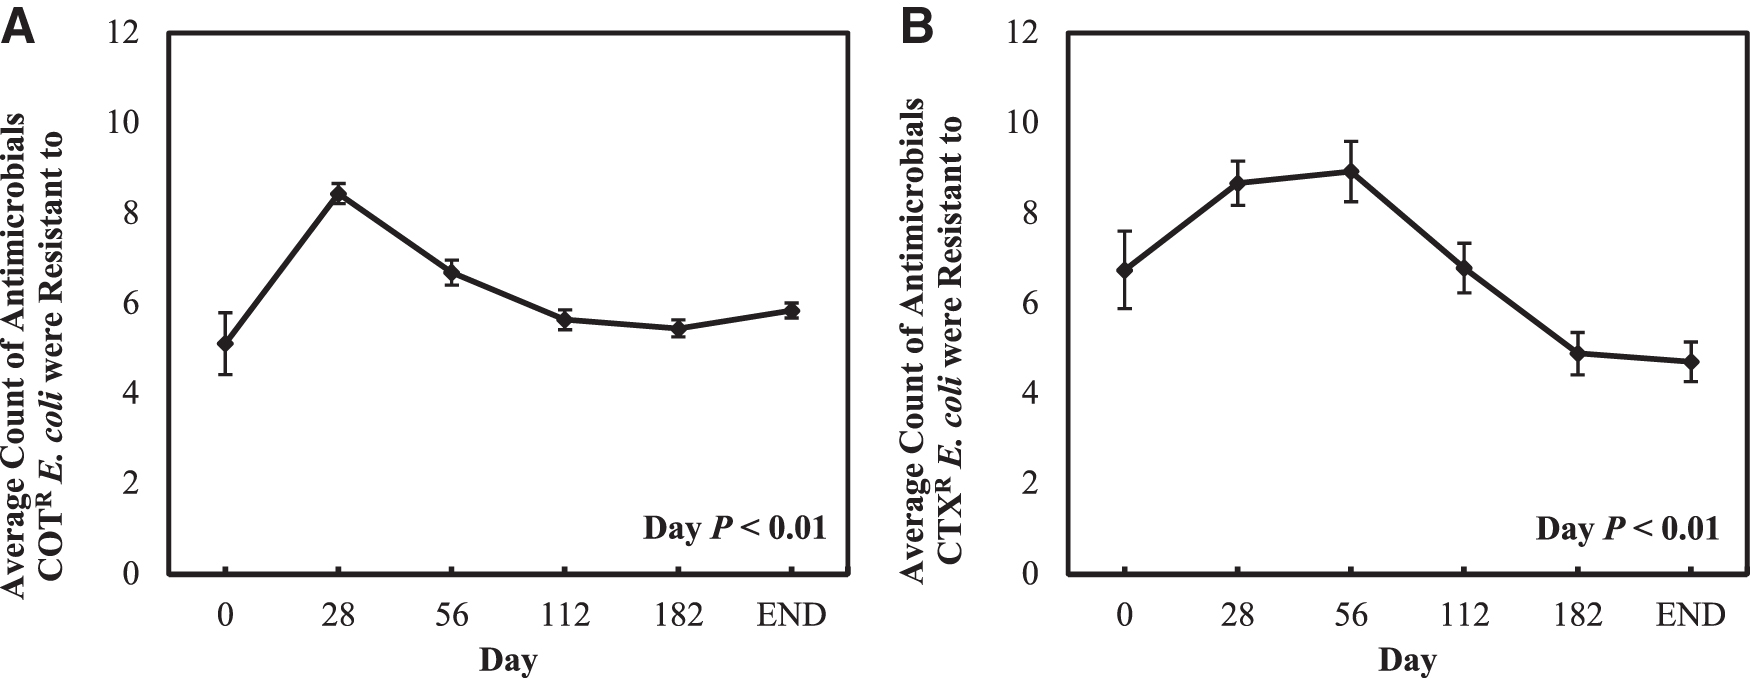
MDR CTXR E. coli isolates were detected in samples across all treatments (CON, 19.0%; TUL, 19.0%; CEF, 26.9%; and FLR, 28.7%). There was an effect of day on the number for AMRs observed in CTXR E. coli (p < 0.01; Fig. 1B). This value was greatest on days 28 and 56 compared with all other days (p ≤ 0.02) and was greater on day 0 compared with day 182 and study END (p ≤ 0.02).
Enumerable COTR E. coli MICs
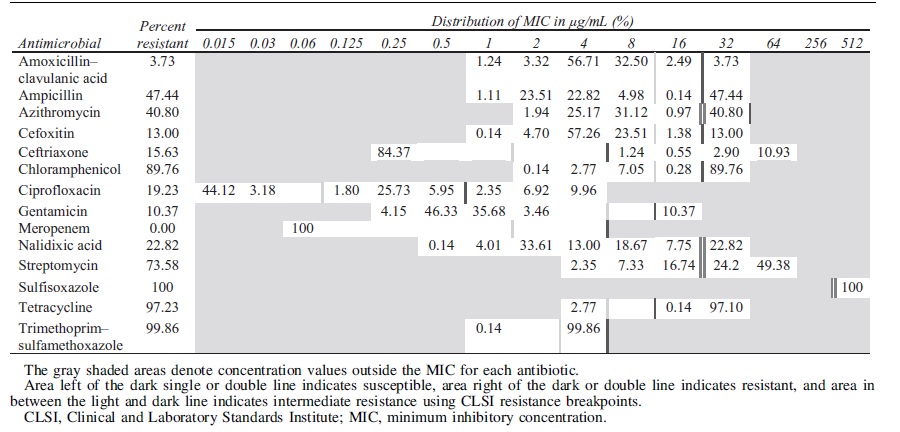
Enumerable COTR E. coli (n = 723) were isolated from fecal samples throughout the study (Table 1). In these isolates, resistance was detected for amoxicillin–clavulanic acid at 3.73%, ampicillin at 47.44%, azithromycin at 40.80%, cefoxitin at 13.00%, ceftriaxone at 15.63%, chloramphenicol at 89.76%, ciprofloxacin at 19.23%, gentamicin at 10.37%, nalidixic acid at 22.82%, streptomycin at 73.58%, sulfisoxazole at 100%, tetracycline at 97.23%, and trimethoprim–sulfamethoxazole at 99.86%. All COTR E. coli isolates were susceptible to meropenem.
Distribution of the Minimum Inhibitory Concentration of 723 Enumerable COTR Escherichia coli Isolates Collected from Fecal Samples in Negative Control Cattle and Cattle Treated with Tulathromycin, Florfenicol, or Ceftiofur on Days 0, 28, 56, 112, 182, or the Day Before Harvest Against 14 Antimicrobials
In the study, there was a significant effect of day on the observed antibiotic MIC values of the COTR E. coli isolates for 11 of the antimicrobials tested. Although there were significant effects of treatment on the observed MIC values for many antimicrobials, differences in MIC on day 0 were observed, so only day effects are presented (Fig. 2) and any significant treatment × day interactions are noted. There was an effect of day on the MIC of amoxicillin–clavulanic acid (p < 0.01; Fig. 2A). The MIC for amoxicillin–clavulanic acid was greatest on day 28 (p ≤ 0.04). Similarly, there was an effect of day for the MIC of ampicillin (p < 0.01; Fig. 2A). The MIC of ampicillin decreased from day 28 to day 56 (p < 0.01) and increased from day 182 to study END (p < 0.01).

Natural log of the average MIC (μg/mL) for
There was also a treatment × day interaction for the MIC of ampicillin (p < 0.01; not shown). On day 0, there were no differences for the MIC of ampicillin among treatments (p ≥ 0.40). However, on day 28, the MIC for ampicillin was greater in CON than TUL and FLR (p ≤ 0.02) and was greater in CEF compared with TUL on day 28 (p = 0.03). On day 56, the MIC for ampicillin was greater in FLR compared with TUL (p = 0.01). On day 182, the MIC for ampicillin was greater for CON and TUL compared with CEF (p ≤ 0.02). The average MICs of azithromycin and cefoxitin differed by day (p < 0.01; Fig. 2A). The MIC for each was greatest on day 28 compared with all other days (p < 0.01).
The average MICs of ceftriaxone, ciprofloxacin, and gentamicin differed by day (p < 0.01; Fig. 2B). The MIC for each was greatest on day 28 (p ≤ 0.01). There were no differences detected in the average MIC for meropenem (p = 0.38), day (p = 0.07), or treatment × day interaction (p = 0.17; Fig. 2B).
The average MIC of streptomycin differed by day (p < 0.01; Fig. 2C). There were no differences in the MIC of streptomycin between day 0 and all other days (p ≥ 0.24) but was greater on day 28 compared with all subsequent days (p < 0.01). The average MIC of nalidixic acid differed by day (p < 0.01; Fig. 2C). The MIC of nalidixic acid was greatest on day 28 compared with all other days (p ≤ 0.01). A treatment × day interaction was also detected for the MIC of nalidixic acid (p < 0.01). On day 28, the MIC of nalidixic acid was greater for both CON and CEF compared with TUL (p ≤ 0.05) and was greater in CON than FLR (p = 0.05). On day 56, the MIC of nalidixic acid was lesser for TUL compared with CON, CEF, and FLR (p ≤ 0.04).
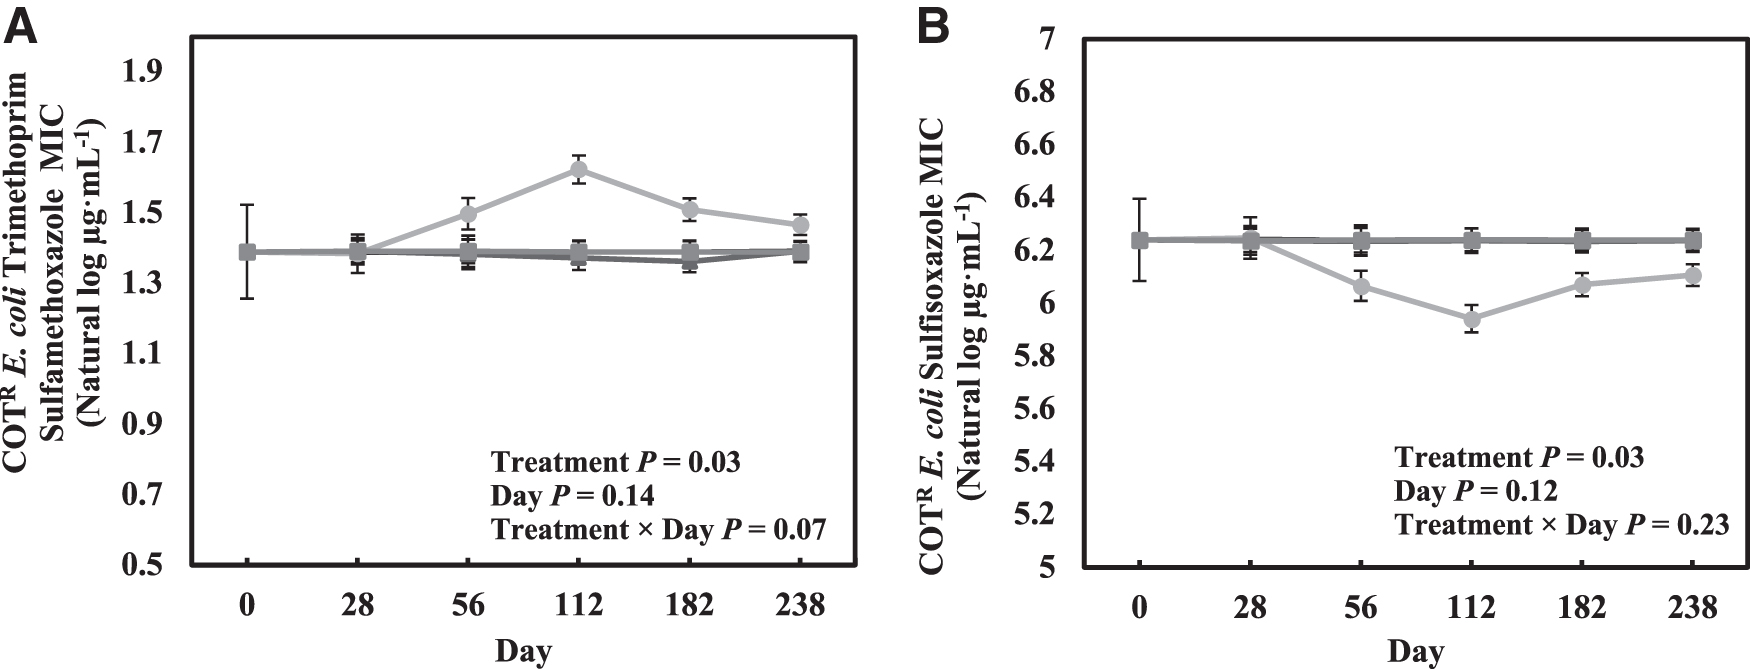
Similarly, the MIC of nalidixic acid was lesser for TUL compared with CON, CEF, and FLR on day 112 (p < 0.01). On day 182, the MIC of nalidixic acid was lesser in TUL than CON and FLR (p < 0.01). Finally, the MIC of nalidixic acid was greater in CEF than CON at study END (p = 0.02). The average MIC of trimethoprim–sulfamethoxazole was not affected by day (p = 0.14; Fig. 2C) or treatment × day (p = 0.07). However, the average MIC was affected by treatment (treatment; p ≤ 0.03; Fig. 3A), and the average MIC values for trimethoprim–sulfamethoxazole was greater for TUL compared with CON, CEF, and FLR (p = 0.03).
Natural log of the MIC (μg/mL) for
The average MIC of chloramphenicol differed by day (p < 0.01; Fig. 2D). The MIC of chloramphenicol increased from days 0 to 28 (p < 0.01) and decreased from day 182 to study END (p = 0.01). The MIC of chloramphenicol was greater at study END compared with day 0 (p = 0.01). The average MIC of sulfisoxazole for COTR E. coli isolates was not affected by day (p = 0.12; Fig. 2D). However, the average MIC was affected by treatment (p ≤ 0.03; Fig. 3B), and the average MIC values for sulfisoxazole was lesser for TUL compared with all other treatments (p ≤ 0.02). Although nearly all isolates were resistant to tetracycline, the average MIC value for tetracycline was not affected by day (p = 0.99; Fig. 2C), treatment (p = 0.28), or treatment × day (p = 0.31).
CTXR E. coli MICs
In total, 553 enumerable cefotaxime-resistant (CTXR) E. coli were isolated from day 0 to study END (Table 2). In these isolates, resistance was also detected for amoxicillin–clavulanic acid at 30.02%, ampicillin at 99.82%, azithromycin at 19.35%, cefoxitin at 42.31%, ceftriaxone at 100%, chloramphenicol at 60.04%, ciprofloxacin at 20.43%, gentamicin at 15.01%, nalidixic acid at 24.77%, streptomycin at 49.36%, sulfisoxazole at 62.21%, tetracycline at 78.12%, and trimethoprim–sulfamethoxazole at 19.71%. The only antimicrobial CTXR E. coli that exhibited susceptibility was meropenem with 100% of the isolates susceptible.
Distribution of the Minimum Inhibitory Concentration of 417 Enumerable CTXR Escherichia coli Isolates Collected from Fecal Samples in Negative Control Cattle and Cattle Treated with Tulathromycin, Florfenicol, or Ceftiofur on Days 0, 28, 56, 112, 182, or the Day Before Harvest Against 14 Antimicrobials

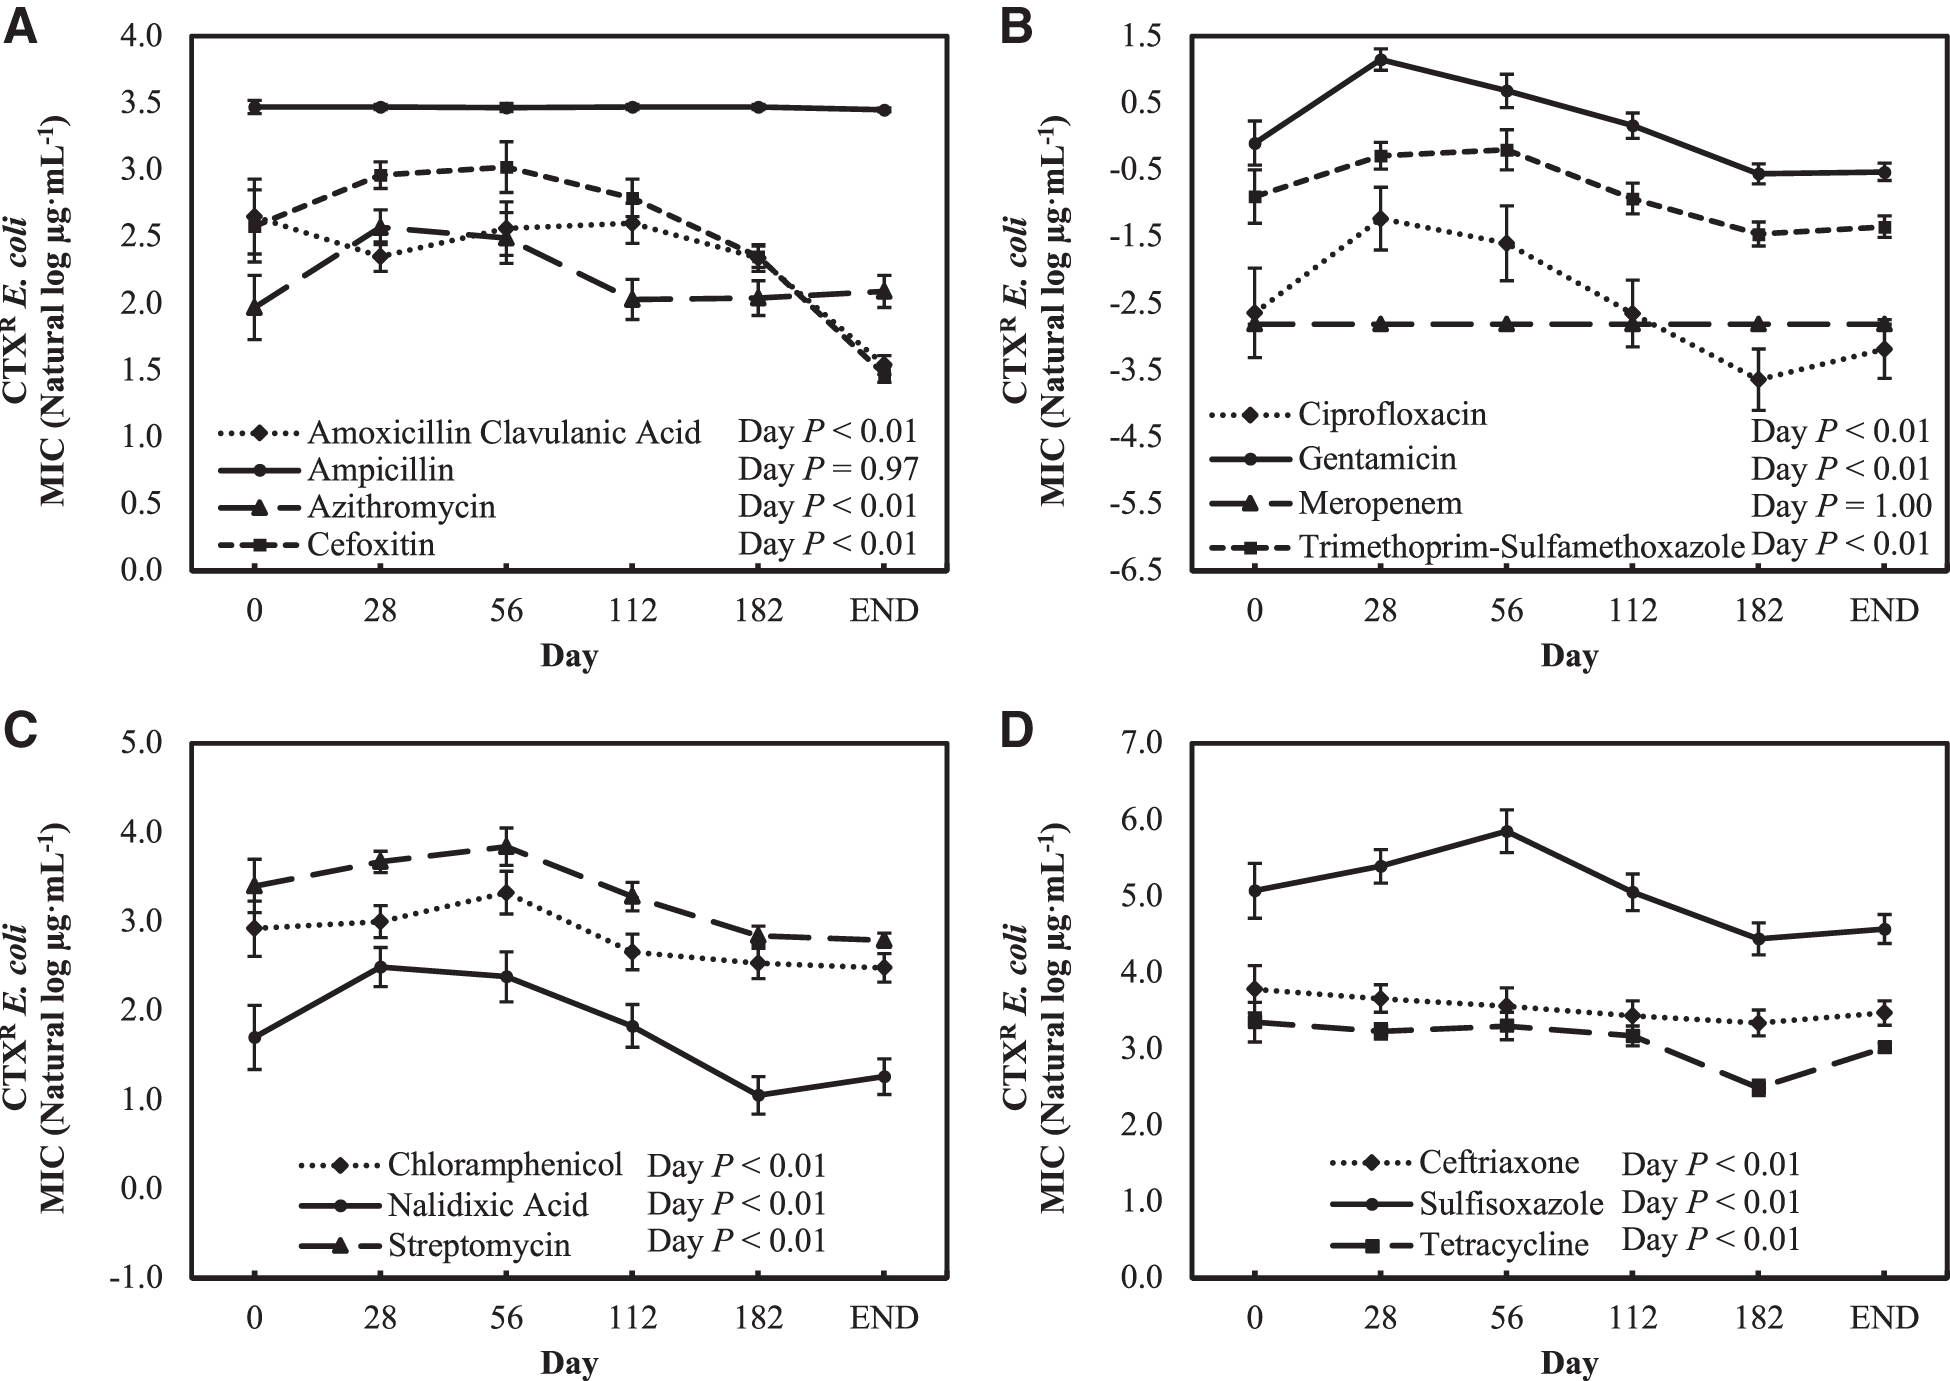
In the study, there was a significant effect of day on the observed antibiotic MIC values of the CTXR E. coli isolates for 12 of the antimicrobials tested. Although there were significant effects of treatment on the observed MIC values for many antimicrobials, differences in MIC on day 0 were observed, so only day effects are presented (Fig. 4) and any significant treatment × day interactions are noted. The average MIC for amoxicillin–clavulanic acid, cefoxitin, and azithromycin differed by day (p < 0.01), but not for ampicillin (p = 0.96; Fig. 4A). The average MIC of amoxicillin–clavulanic acid was greater on days 28 and 56 compared with study END (p < 0.01) but was not different from days 0 or 112 (p ≥ 0.31). Furthermore, the MIC of amoxicillin–clavulanic acid was greater on day 0 than study END (p < 0.01). Similarly, the MIC of azithromycin was greater on days 28 and 56 compared with all other days (p ≤ 0.05). Finally, the MIC for cefoxitin was greatest on day 56 compared with all other days (p ≤ 0.03).
Natural log of the average MIC (μg/mL) for
The average MIC for ciprofloxacin, gentamicin, and trimethoprim–sulfamethoxazole differed by day (p < 0.01), but not for meropenem (p = 1.00; Fig. 4B). The MIC of ciprofloxacin was greater on day 28 than on days 0, 112, 182, and study END (p ≤ 0.01). For gentamicin, the MIC was greater on days 28 and 56 than on all other days (p ≤ 0.05). Furthermore, the MIC of gentamicin was greater on day 112 than those on day 182 and study END (p < 0.01). Finally, the MIC of trimethoprim–sulfamethoxazole was greater on days 28 and 56 than those on days 112, 182, and study END (p ≤ 0.02). The MIC was also greater on day 112 than on day 182 and study END (p ≤ 0.04).
In addition, there was also an effect of treatment on the MICs of ciprofloxacin, gentamicin, and trimethoprim–sulfamethoxazole (p < 0.01). The MIC of ciprofloxacin was less for TUL than those of CON, CEF, and FLR (p ≤ 0.03). The MIC of gentamicin was greater for CON and CEF than those for TUL and FLR (p ≤ 0.04). Furthermore, the MIC of trimethoprim–sulfamethoxazole was greater for CON than those for TUL and FLR (p < 0.01).
The average MIC for chloramphenicol, nalidixic acid, and streptomycin differed by day (p < 0.01; Fig. 4C). The MIC of chloramphenicol was greater on days 28 and 56 than those on days 112, 182, and study END (p ≤ 0.04). For nalidixic acid, the MIC was greater on days 28 and 56 compared with all other days (p ≤ 0.05). In addition, the MIC of nalidixic acid was greater on day 112 than on day 182 and study END (p < 0.01) and was also greater on day 182 compared with study END (p = 0.05). Similarly, the MIC of streptomycin was greater on days 28 and 56 (p ≤ 0.03). The MIC of streptomycin was also greater on day 0 than study END (p = 0.04) and greater on day 112 than those on day 182 and study END (p > 0.01).
In addition, there was also an effect of treatment on the MICs of nalidixic acid and streptomycin (p ≤ 0.02). The MIC of nalidixic acid was greater for FLR than CON and TUL (p ≤ 0.02). Furthermore, the MIC of nalidixic acid was lesser for TUL than those for CON and CEF (p ≤ 0.01). The MIC of streptomycin was greater for CEF compared with CON and TUL (p ≤ 0.03).
The average MIC for ceftriaxone, sulfisoxazole, and tetracycline differed by day (p < 0.01; Fig. 4D). The MIC of ceftriaxone was greater on day 28 than those on days 112, 182, and study END (p ≤ 0.04). In addition, the MIC of ceftriaxone was greater on day 0 than on day 182 (p = 0.02). The MIC of ceftriaxone was also less on day 182 than at study END (p = 0.03). Furthermore, there was an effect of treatment on ceftriaxone (p < 0.01). The MIC of ceftriaxone was greater for CON than those for TUL and CEF (p < 0.01). The MIC of ceftriaxone was also greater for CEF than those for TUL and FLR (p ≤ 0.01).
For sulfisoxazole, the MIC was greater on day 28 than at day 182 and study END (p < 0.01). On day 56, the MIC of sulfisoxazole was greater than days 112, 182, and study END (p ≤ 0.04). The MIC of sulfisoxazole was also greater on day 112 than that on day 182 (p = 0.02). The MIC of tetracycline was less on day 182 than all other days (p < 0.01). The MIC of tetracycline was also greater on day 28 than at study END (p = 0.05).
Discussion
In this study, the COTR and CTXR-resistant E. coli were enumerated in fecal samples across all treatments and time points collected from feedlot cattle. Resistance using the NARMS susceptibility values was detected for 13 of the 14 antimicrobials tested in CTXR and COTR E. coli isolates; however, all isolates exhibited 100% susceptibility to meropenem. Using a similar antimicrobial susceptibility panel, Tadesse et al. (2012) reported resistance to 15 antimicrobials in E. coli isolates from cattle including the 11 antimicrobials in common with this study. Furthermore, Guerra (2003) reported the most common resistances from E. coli isolated in German cattle were streptomycin, sulfamethoxazole, and tetracycline. However, in total, they detected resistance equivalents isolated from German livestock for five antimicrobials in common with this study.
Ohene Larbi et al. (2021) also reported resistance to eight of the antimicrobials used in the current panel in E. coli isolates from cattle in Ghana. In contrast to our findings, Ohene Larbi et al. (2021) also reported 100% resistance to meropenem and 100% susceptibility to ceftriaxone in these Ghana cattle. AMR can vary by location (Schito, 2002) and could account for differences in the studies.
Not surprisingly, the MICs of COTR E. coli for most of the antimicrobials in the susceptibility panel increased from days 0 to 28 in this study. Numerous other studies have reported an increase in AMR following administration of an antimicrobial in cattle (Checkley et al., 2010; Lowrance et al., 2007; Pereira et al., 2020). However, it was unexpected that the average number of antimicrobials COTR E. coli isolates were resistant and the MIC of ampicillin, azithromycin, ciprofloxacin, and nalidixic acid increased toward the end of the feeding period. Warmer seasons tend to increase E. coli populations and Long (2022) reported concentrations of COTR E. coli in this study increased from sample dates during warmer months (day 112 to study END; Vikram et al., 2017). Therefore, it is possible this effect is simply a reflection of a greater total population of COTR E. coli or the influence of environmental conditions (Petersen et al., 2009).
As mentioned previously, it is expected that the MIC of CTXR E. coli isolates might increase after antimicrobial use; however, it was surprising the MICs of ampicillin were not affected by antimicrobial use and the MIC of ceftriaxone tended to be less on day 56 than on day 0. In a 4-year study on cattle slaughtered in Poland from 2009 to 2012, Wasyl et al. (2013) reported similar findings that there was no difference in the MIC of ampicillin for commensal E. coli isolates collected from cattle throughout the study. Furthermore, ampicillin has been used frequently to treat E. coli infection and resistance has increased as a result, but meropenem remains an effective treatment strategy against extended-spectrum β-lactamase–producing E. coli (Hidron et al., 2008; Jones and Pfaller, 2003; Willems and Van Schaik, 2009).
Resistance to meropenem was not observed in this study. The decrease in the MIC of ceftriaxone contradicts results from other studies, which reported reduced susceptibility to ceftriaxone in E. coli isolated from cattle administered a third-generation cephalosporin (Tragesser et al., 2006). However, populations of E. coli resistant to third-generation cephalosporins isolated from cattle administered CEF have been reported to initially increase and then decline ∼2 weeks following treatment; therefore, it is possible the increase in the MIC of ceftriaxone occurred before the second measurement in this study (Lowrance et al., 2007; Taylor et al., 2019).
In this study, subtle differences in the MICs for the different antibiotics were observed between AMR E. coli isolates from the different metaphylactic treatments. In particular, the average MICs of sulfisoxazole and nalidixic acid in COTR E. coli were less for the isolates from the metaphylactic use of the macrolide TUL compared with other drug treatments. This shift in susceptibility suggests there may be an antagonistic relationship between TUL use and the exhibited resistances to sulfisoxazole and nalidixic acid in the COTR E. coli population. The above-mentioned antimicrobials each have different mechanisms of action and genetic components (Bushby and Hitchings, 1968; Smith et al., 2001; Tenson et al., 2003), so the impact of TUL use on these AMR results needs further research.
As noted in Coppin et al. (2022), the metaphylactic use of TUL resulted in animals requiring the least amount of treatment for bovine respiratory disease. In contrast, TUL use did result in decreased susceptibility to trimethoprim–sulfamethoxazole in the COTR E. coli populations. In other bacteria, co-resistance has been displayed between trimethoprim–sulfamethoxazole and the macrolide, erythromycin (Schafer et al., 2013).
In conclusion, the findings of this study confirm that MDR E. coli strains are widely disseminated. Furthermore, the MIC of COTR E. coli was affected by the use of a metaphylactic antimicrobial at feedlot arrival. However, with the exception of azithromycin, ampicillin, and chloramphenicol, the MIC of the antimicrobials tested differed little at harvest compared with arrival.
Footnotes
Acknowledgments
The authors thank Dee Kucera and Shannon Ostdiek for their technical works. USDA is an equal opportunity provider and employer.
Authors' Contributions
Funding acquisition: K.E.H., J.E.W., and S.C.F. Project administration: N.S.L. Project execution: J.E.W., E.D.B., S.C.F., D.R.W., P.R.B., J.A.C., N.C.B.S., J.F.L., and K.E.H. Supervision: K.E.H., J.E.W., and P.R.B. Writing–original draft: N.S.L., K.E.H., and J.E.W. Writing–review: J.E.W., E.D.B., S.C.F., D.R.W., P.R.B., J.A.C., N.C.B.S., J.F.L., and K.E.H.
Disclosure Statement
The authors declare no conflicts of interest.
Funding Information
This work was supported by Mitigating Antimicrobial Resistance, Grant No. 2020-68015-30857, project Accession No. 1022218 from the USDA National Institute of Food and Agriculture. Any opinions, findings, conclusions, or recommendations expressed in this presentation are those of the authors and do not necessarily reflect the view of the U.S. Department of Agriculture. Additional funding was provided by the Beef Checkoff. Mention of trade names or commercial products in this article is solely for the purpose of providing specific information and does not imply recommendation or endorsement by the USDA.