
Abstract
Escherichia coli is a well-characterized micro-organism in scientific literature. Similarly, quaternary ammonium compounds (QACs) are historical sanitizers in food processing. However, the use of QACs has been questioned due to bacterial resistance in some studies. Therefore, this study aimed to compare effects of single and mixed cultures of E. coli strains of different serogroups with either high (six strains) or low (five strains) resistance to QACs. Twenty-five combinations of strains with either high (H)- or low (L)-QAC resistance were analyzed (H + H vs. L + L). After exposure to QAC, combinations with statistical differences (p < 0.05) compared with individuals were selected and an inactivation model determined using GInaFit®. Only one combination of two strains (C23 and C20) with low-QAC resistance (mixture T18) had greater resistance (p < 0.05) than the individual isolates. The combination T18 and individual strain C23 presented a Weibull model, whereas the other isolated strain (C20) presented a biphasic inactivation model with a shoulder. Whole genome sequencing determined that unlike C20, C23 carried yehW, which may have led to Weibull inactivation. Possibly, very rapid interaction of C20 with the QAC favored increased survival of C23 and overall persistence of the T18 mixture. Consequently, our results indicate that individual E. coli with low-QAC resistance can synergistically interfere with QAC inactivation.
Introduction
E
Concomitant with the epidemiological investigation of these pathogens, studies are being conducted to inactivate pathogenic agents, with the use of antibiotics, sanitizers, or organic acids (Castro et al., 2020; Timmons et al., 2018; Topalcengiz and Danyluk, 2017). To ensure inactivation of pathogens, it is necessary to determine the inactivation capacity of the sanitizer, as well as to continually measure the effectiveness and concentrations required for inactivating the target pathogen. Thus, one of the sanitizing classes most used historically and currently are quaternary ammonium compounds (QACs; Jiao et al., 2017).
QACs are the major class of active compounds current applied in cleaning products (Zheng et al., 2020). In addition, QAC disinfectant use increased during the pandemic in several industries, including food processing (Hora et al., 2020). QACs are frequently applied to inactivate microbial biofilms (Olszewska et al., 2016). Biofilms are classified as a complex ecosystem formed by one or more bacterial species, immersed in a variable extracellular matrix (Galié et al., 2018). Biofilms can naturally be a means of protecting bacteria from the QAC sanitizer, especially in the deeper layers (Bridier et al., 2011). In addition, due to their long period of use, some studies have reported the resistance of bacteria against sanitizers based on QAC (Bragg et al., 2014; Buffet-Bataillon et al., 2016).
Inefficiency in the total inactivation of bacteria produced by constant exposure to a low dose of the sanitizer is one of the hypotheses for adaptive resistance (Martínez-Suárez et al., 2016). Although some studies have determined the resistance of individual bacterial strains to QAC, the effects of multiple strains with differing sensitivity to QAC need to be evaluated. Therefore, this study aimed to measure the efficacy of QAC for control of combinations of E. coli strains showing either individually high or low resistance to QAC.
Materials and Methods
This study was approved by the Southern Alberta Biosafety Committee, Reference SABC-2021-07.
Bacterial strains
The isolates selected in this study were obtained from a group of 746 strains of E. coli previously isolated from bovine feces (Stanford et al., 2016). The strains were stored at −80°C in Luria Bertani broth (LB) containing 20% glycerol as stock cultures. Subsequently, the strains were reactivated. In brief, an aliquot of the stock culture was streaked on a plate containing MacConkey agar (MAC), and incubated for 18–24 h at 35°C. After that, a single colony was selected from the plate and inoculated in a tube containing 9 mL tryptic soy broth (TSB) and incubated at 35°C for 16 h with constant agitation (0.5 g; VWR Mini Shaker, New Brunswick Scientific, Canada). The overnight culture was used in further steps.
Screening of strains in QAC sanitizer by minimum inhibitory concentration
All 800 strains of E. coli were individually tested to determine the minimum inhibitory concentration (MIC) of the E-san 205® sanitizer (Kitchen Kleen, Hayward, CA, USA), which contained the following formulation: (n-alkyl 60% C14, 30% C16, 5% C12, 5% C18 dimethyl benzyl ammonium chlorides 4.5%), (n-alkyl 68% C12, 32% C14 dimethyl ethylbenzyl ammonium chlorides 4.5%), and inert ingredients (91.0%). QAC concentrations were obtained through dilutions using Milli-Q ultrapure water (type A10, Millipore®, Bedford, MA, USA). For that, we prepare the initial concentration according to the manufacturer's label to reach a concentration of 200 ppm.
We then prepared a series of serial dilutions, applying manual shaking, pouring the bottles 20 × before preparing the next dilution. All dilutions were prepared using ultrapure water to reach working concentrations. Bacterial growth was evaluated in four initial QAC concentrations: 25, 12.5, 6.25, and 3.125 ppm and compared with that of controls lacking QAC. Bacterial concentration in TSB was adjusted to ∼106 cells per mL using a spectrophotometer (Thermo Fisher Scientific, Canada) at an optical density of 600 nm (Conrad et al., 2014). After standardization, a 100 μL aliquot of the bacterial medium and 100 μL of the sanitizer at the concentrations described earlier were inoculated into 96-well plates, using ultrapure water as a negative control.
The plates were incubated at 35°C for 24 h and were subsequently analyzed on a plate spectrophotometer at a wavelength of 600 nm. The data were tabulated and MIC at QAC concentrations of 12.5 ppm or higher were characterized as strongly resistant, with MIC of 6.25 and 3.125 ppm classified as weakly resistant. These cutoff points were determined by observing the individual MIC results for our E. coli strain collection (Castro et al., 2023), and based on the study performed by Sheridan et al. (2012), where all STEC (O157 and O103 strains) and STEC with multidrug resistance (O1, O26, O40, O153, and O101) obtained individual MIC results of 10 μg/mL (or 10 ppm) for alkylbenzyldimethylammonium chloride, the same molecule used in this study.
Combination of strong and weak E. coli strains and QAC exposure
A total of 11 E. coli strains (6 strongly and 5 weakly resistant for QAC) were used in subsequent trials (Table 1). Two-strain mixtures evaluated included 15 combinations between the strong strains and 10 combinations between the weak strains (Fig. 1). Thus, for the first stage, 25 combinations were analyzed one dilution less than the MIC of QAC that was used to establish classifications of weak or strong resistant strains (Table 1). Therefore, for combinations of strains with weak resistance, we used a concentration of 3.125 ppm, and for strong resistance combinations a concentration of 6.3 ppm was used.

Reduction in bacterial counts of strong and weak STEC strains and their two-strain mixtures by quaternary ammonium compounds. Average and standard deviation of the strong and weak STEC strains.
Strains Used in this Study and Individual Minimum Inhibitory Concentration Data
MIC, minimum inhibitory concentration; Ne, not evaluated; WGS, whole genome sequencing.
Each individual culture in TSB broth was adjusted to a concentration of 103 cells/mL using a standard curve and a spectrophotometer with a wavelength at 600 nm, and subsequently combined in a single tube. The individual strain and combination were tested in triplicate for exposure to QAC and an aliquot of each tube was inoculated into a petri dish containing MAC and the colonies were counted after 24 h at 35°C. The results obtained for each strain alone and for strain combinations were compared using the Tukey post hoc test at 5% significance.
Combinations that showed statistically different values when compared with the values of individual strains were selected and applied to the second part of the study. Three models of inactivation (two models for the isolated strains and one for the combination) were performed using GInaFit® version 1.6 software (Katholieke Universiteit Leuven, BEL). For this, 12 concentrations were selected, ranging from 6.3 to 2.8 ppm and were tested similar to the establishment of MICs. In brief, a 100 μL aliquot of the isolate was exposed to 100 μL of each concentration of QAC on 96-well plates and was subsequently incubated at 37°C for 24 h. After incubation, the plates were read on a plate spectrophotometer at 600 nm. Subsequently, all 96 wells for the 12 concentrations were measured, and the data obtained were fit to the models present in the GInaFit software.
Whole genome sequence analysis
The two strains that had significantly improved resistance to the sanitizer as a combination were selected for whole genome sequencing (WGS). In addition, one weak resistant to QAC (C14), and one strong resistant (C24) were also included in WGS analysis (Table 1). A single colony was isolated and DNA extractions performed with a Qubit kit (Invitrogen, UK). The DNA was then sequenced in an Illumina NovaSeq 6000 platform (150 bp, paired-end) with an estimated sequencing depth >300 × . FastQC (Version 0.11.9) was used to check the quality of raw reads. Genome assembly was performed using the SPAdes method using Shovill (Version 1.1.0). Assembly quality was checked using Quast (Version 5.2.0). Annotation was performed using Prokka (Version 1.14.6). Virulence and serogroup were analyzed using ABRicate (Version 1.0.1; databases: Virulence-Finder and E. coli O and H group, respectively).
For comparison with other genomes, we used the Pathogen Detection database (
In addition, we extracted the cluster where our strains were included, and a new core-genome was performed using this cluster and our samples, with a new phylogenetic tree performed. Finally, we selected all quaternary ammonium-resistance genes (453 genes) present in National Center for Biotechnology Information (NCBI;
Statistical analyses and modelling adjustment
Inhibitory values for individual isolates were compared with combinations using a one-way analysis of variance, and the average was analyzed using the Tukey post hoc test at the 5% significance level. To determine the inactivation curve, the data were entered in models present in GInaFit (Geeraerd et al., 2005). The model with the highest adjusted determination coefficient value (R 2 adj value) was defined as the most appropriate and evaluated the inactivation pattern of the isolates.
The models best fitting the data were biphasic + shoulder (Geeraerd et al., 2005) and Weibull (1951; Geeraerd et al., 2005). For both models, the 4-D reduction values were calculated and represent the required dose of sanitizer to inactivate 4 Log/CFU of bacteria. In addition, the value of the root of mean sum of square error (RMSE) was accessed and when closer to zero was deemed a more reliable model. For the Weibull model the Kmax values were calculated and represent the rate of inactivation. For the biphasic + shoulder model, Delta values were obtained to estimate the concentration required for first log reduction.
Results and Discussion
Combinations of strong and weak E. coli strains and QAC exposure
Among the 25 combinations analyzed, only one had a different MIC (p < 0.05) than its constituents (Fig. 1). This means that most of the combinations analyzed in this study did not influence either negatively or positively the inactivation by the sanitizer (Fig. 1).
In further analysis of the combination that altered MICs by exposure to 12 concentrations of the QAC sanitizer and analysis using GInaFit, it was possible to verify that strain C20 presented a behavior of biphasic + shoulder (small initial resistance but with tail effect in the lower concentrations), whereas C23 strain and the combination of C20 + C23 (T18) strains showed a Weibull inactivation pattern (Fig. 2).

Models fitted two individual strains of Shiga toxin–producing Escherichia coli and their mixture exposed to a quaternary ammonium compound sanitizer. Experimental data of isolated strains (C20 and C23) and combination (C20 + C23). The red line represents the fitted model for combination, the black line the fitted model for C23, and gray line represent a fitted model to C20.
Inactivation parameters are described in Table 2. For the model of C20 strain (biphasic + shoulder) the adjusted R 2 value was 0.98, the RMSE value was 0.053, and Kmax 1 was 34.46, and Kmax 2 0.09. For C23 strain, the R 2 adj values were 0.82, the delta value was 4.92, and the RMSE value was 0.2961. Finally, the values for the combination T18 were R 2 adj of 0.88, delta 4.57 and RMSE of 0.2705.
Model Parameters and Coefficient of Determination
The model was selected according to the better adjustment of data. R 2 adj: adjusted determination coefficient, indicates the goodness of fit. Kmax1: rate of population inactivation after the shoulder effect. Kmax2: rate of population inactivation before the tailing effect. Delta: time required for the first log reduction. 4D reduction: concentration compounds required to 4-log reduction of the bacterial load.
RMSE, root mean sum of square error.
Quaternary ammonium-based sanitizers are widely used in the food industry (Castro et al., 2020; Korany et al., 2018). Their mechanism of action is not yet fully elucidated in the literature (Jiao et al., 2017); however, some studies suggest that their main antimicrobial actions are due to damage to the cytoplasmic membrane (Wessels and Ingmer, 2013). Possible multifactorial effects of QAC have also been discussed (Jain et al., 2014). Therefore, although the total antimicrobial mechanism of QAC is not precisely known, it is understood that these compounds have a wide range of efficacy in the control of micro-organisms since they can inactivate different types of cells, for example, Gram-positive and Gram-negative bacteria, fungi, and parasites (Wessels and Ingmer, 2013).
In the past decades, a significant challenge for the food industry has been the prevention and inactivation of microbial biofilms in processing facilities (Olszewska et al., 2016). Owing to their wide spectrum of inactivation, QACs have been used to prevent the formation of the biofilm matrix and to destroy the biofilms already attached on equipment surfaces. However, due to the large-scale use and after many decades of application, a possible selective pressure may have been applied, and cases of QAC resistance have been reported in several studies (Enany et al., 2019; Sidhu et al., 2002; Sundheim et al., 1998).
Another consideration is that this sanitizer can be used on surfaces that will not necessarily be adequately rinsed, and the interaction between low concentrations of QAC and surviving bacteria cells may result in the selection of bacteria with acquired resistance (Yu et al., 2018). Concentrations of sanitizer used in this study would be most representative of residuals after rinsing as the E-san 205 sanitizer is commonly employed in slaughter facilities at a concentration of 200 ppm (Visvalingam et al., 2019). However, for the individual planktonic E. coli evaluated in this study, none were able to survive exposure to 25 ppm of the sanitizer.
Results of this study indicate that the majority of combinations between strong and weak strains had no significant impact on the cell counts obtained with the sanitizer, except for a combination between weak strains that had a positive effect on survival. Thus, the results obtained for the inactivation curve showed that although a strain was sensitive to the sanitizer (biphasic + shoulder model) when in combination with another strain that presented Weibull's model, an additive effect was observed. We hypothesize that the most sensitive strain may have interacted more quickly with the sanitizer, partially protecting the strain with Weibull's model from interaction with the sanitizer and consequently increasing bacterial counts.
Regarding the inactivation parameters verified using GInaFit, the results obtained indicate that the models have a good explanation of the variation. The adjusted determination coefficient R 2 adj value indicates how well the model can predict new observations. The value of R 2 adj varied between 0.82 and 0.98. The R 2 adj of the three models were satisfactory (>0.80). Also, the Kmax value determines the speed of inactivation after initial resistance (shoulder effect) or before the tail effect behavior (the tail inactivation; van der Waal, 2017). Therefore, the Kmax value was only determined for strain C20, where a shoulder effect was initially present (Kmax1 : 34.46) and then a tail effect behavior (Kmax2 : 0.09). For strains classified as following a Weibull model, the delta value was measured, which represents the concentration required for first log reduction.
The delta values for the C23 strain and the C23 + C20 (T18) combination were similar, with the delta of the combination (T18) slightly lower (less concentration required to decrease a log). Also, the RMSE value were measured, which indicates the goodness-of-fit of measured and predicted data. The closer to 0, the better the RMSE value and consequently the goodness-of-fit of our data with the model. In the models obtained, the RMSE value was satisfactory and in agreement with the values obtained for R 2 adj. Finally, the required concentration value for a 4-log reduction was achieved for the combination strains model, and it was estimated that 6.05 ppm/mL would be necessary to achieve complete bacterial inactivation (Table 2).
WGS for weak E. coli combination
The results obtained are in line with what we have experienced in recent studies by our group. Of the four strains that were submitted to sequencing, three did not show the stx gene, although they did show some genes related to the STEC strains (Table 1). Furthermore, all strains used in this study were previously confirmed by polymerase chain reaction (PCR) during isolation. We recently published a study in which we discussed troubles related to the disagreement between PCR and WGS (Castro et al., 2021). In this study, we have hypothesized that subcultures had a direct influence on the loss of stx-phages (Castro et al., 2021).
In addition, other studies have already pointed to the influence of subcultivation or free stx-phage presence in the strains during PCR detections (Joris et al., 2011; Senthakumaran et al., 2018). Furthermore, of the four sequenced strains, three (75%) showed agreement between PCR and WGS for serogroup determination (C14, C24, and C23). However, as in our study performed by Castro et al. (2021), one strain (C20) showed a disagreement between serogroup by PCR and by WGS. For the purpose of comparison in this study, we performed the discussion focused on the combination between two strains with weak resistance instead of attributing the highest resistance to the specific-serogroup.
Through WGS and phylogenetic analysis, we observed that the C23 (weak resistance) and C24 (strong resistance) strains were included in a cluster with nine other E. coli isolates, whereas the C20 and C14 (weak resistance) strains were in a branch with no associations with the other E. coli isolates with QAC resistance (Fig. 3). Thus, we selected the cluster where strains C23 and C24 were included and rebuilt another phylogenetic tree with only the 13 isolates, since 9 from the pathogen detection database plus our 4 strains: C14, C20, and C23 (weak resistance), and C24 (strong resistance), which confirmed the relationship between isolate C23 and C24 and isolates containing QAC resistance, whereas C14 and C20 remained outside the cluster of isolates with resistance to quaternary ammonium (Fig. 4).
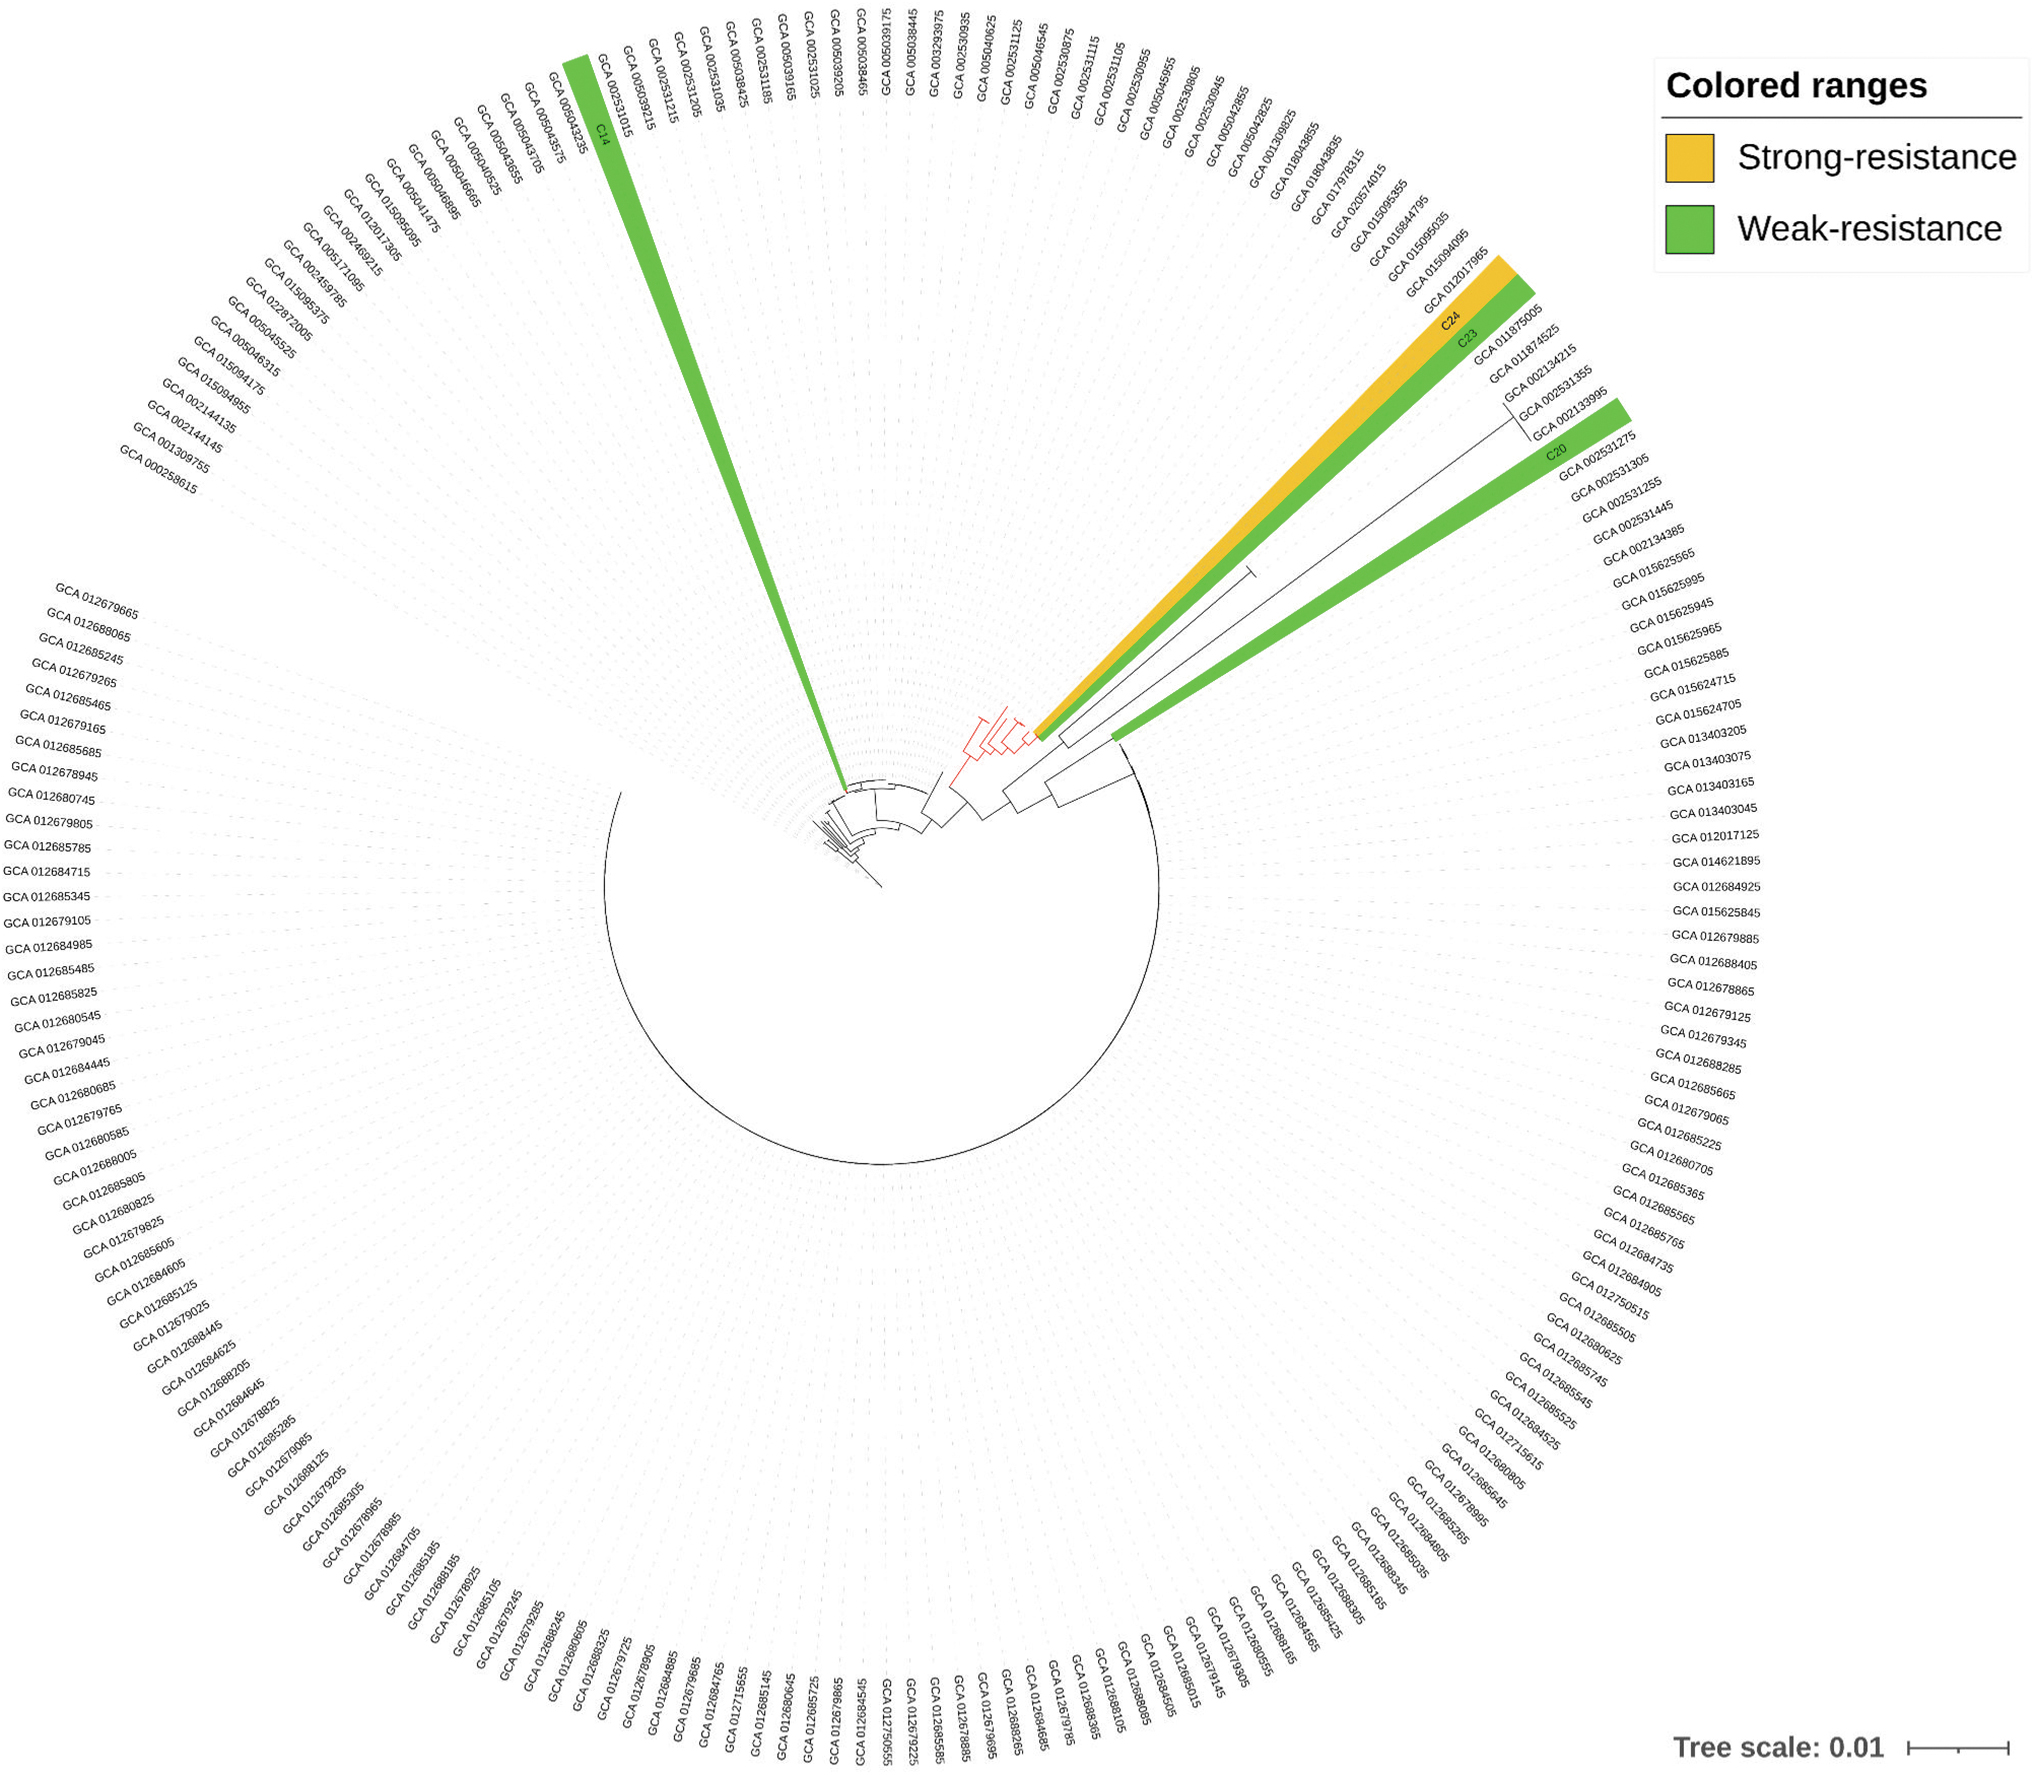
Phylogenetic tree using 200 Escherichia coli quaternary ammonium compound resistant from pathogen detection of National Center for Biotechnology Information and four strains from this study. The strains analyzed in this study were highlighted in green (weak resistance) and yellow ranges (strong resistance). In red we emphasized the clade where C23 and C24 were included. All branch present bootstrap value >80 that support the clades.
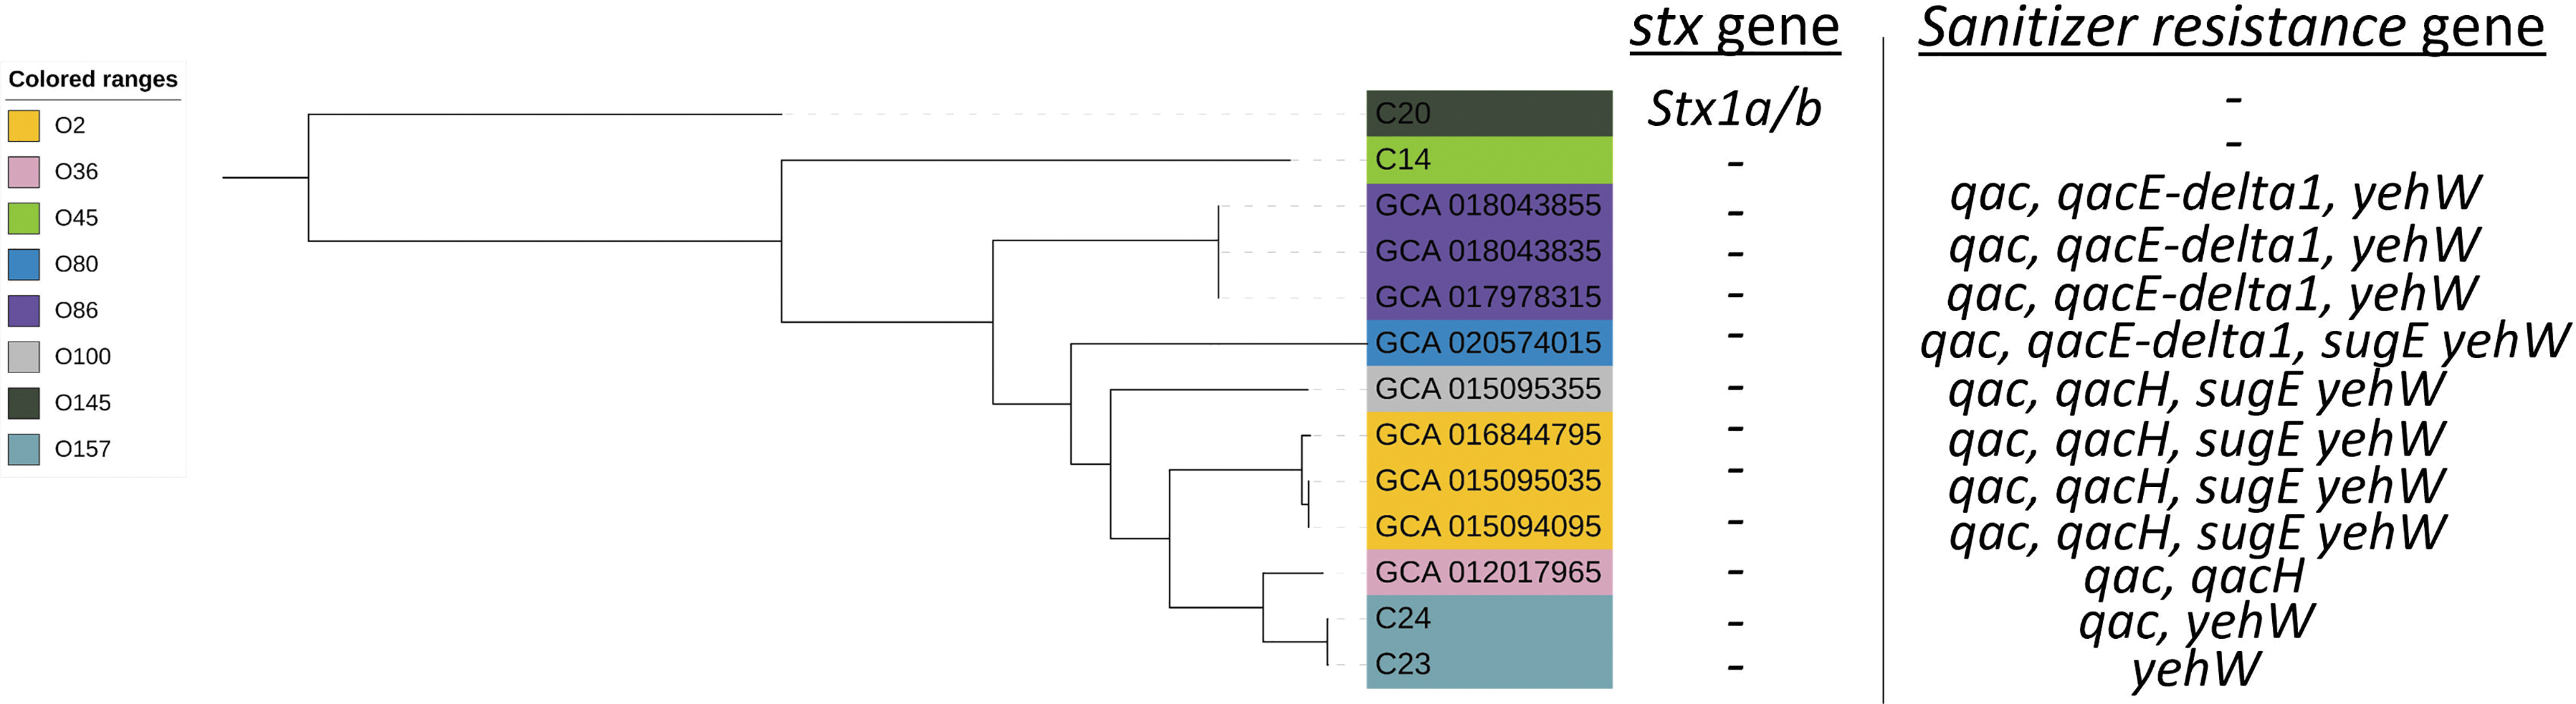
A phylogenetic tree was performed using the clade where C23 and C24 were present and nine isolates from pathogen detection National Center for Biotechnology Information database. The Shiga toxin and sanitizer resistance genes were determined. All branch present bootstrap value >80 that support the clades.
In this sense, we performed the annotation of the 13 genomes using a database created with all known quaternary ammonium resistance genes present at the NCBI. Thus, the nine isolates obtained by pathogen detection and described as QAC resistant were confirmed using Blastn and all strains showed one or more QAC resistance genes included in their genome (Fig. 4). When we analyzed the genomes of this study, we verified that only C24 (strong resistance) had the QAC resistance gene and the presence of yehW gene, whereas the C14 and C20 strains did not present any QAC resistance genes, which corroborates their previous weakly resistant MIC result. However, although the C23 strain presented low MIC values, through Blast it was possible to identify the presence of the yehW gene in the C23 genome, which would explain its inclusion in the cluster with the C24 strain and other nine QAC-resistant genomes from NCBI.
The yehW gene (glycine betaine uptake system permease protein; UNIPROT) was classified by Checroun and Gutierrez (2004) as an encoder of a putative osmoprotectant in E. coli and was suggested as an additional element of a sigma-controlled stress response. The osmoregulatory role of Yeh family genes has already been proposed by Checroun and Gutierrez (2004) and Kim et al. (2013). Furthermore, participation in ammonium quaternary absorption and catabolism was hypothesized by Lang et al. (2015) and could explain the biphasic + shoulder model in the C20 strain (this genome does not have yehW or QAC resistance genes and, therefore, did not have any resistance to the sanitizer).
Therefore, in theory, regulation of the quaternary ammonium input could lead to slight resistance at low concentrations (2.6–3.5 ppm; Fig. 2), but when increasing the sanitizer concentration to an amount where the regulation system is not sufficient to manage the entry of this compound, an abrupt inactivation could occur (Fig. 2). An interesting point is that a gene from the same yeh family (yehV) is a site of integration of prophages carrying Shiga toxins. In a study performed by Henderson et al. (2021), the authors found that STEC O157 strains had yehV as the main inclusion site for stx1 (96.5% of the isolates evaluated).
Furthermore, only the C20 strain presented the Shiga toxin gene (Fig. 4), and the presence of yehA, yehB, yehC, yehD, yehF, yehL, yehR, yehX, yehY, and yehZ genes was observed in the C20 strain close to the stx gene. However, neither yehV nor yehW was present, which leads us to the hypothesis that the inclusion of stx led to the excision of these genes in the C20 strain (Fig. 2). Thus, the absence of the yehW gene could explain the low resistance of the C20 strain even at small concentrations of quaternary ammonium (2.6 ppm; Fig. 2), whereas the C23 strain showed an initial resistance that could be derived from regulation by the yehW gene until the saturation and inactivation of the strain by the quaternary ammonium (Fig. 2).
Therefore, although this study is preliminary, our results shed light on increased survival in a combination of weak strains. Thus, we hypothesize that genes responsible for regulating cell membrane permeability may play a key role in different models of bacterial inactivation.
Conclusion
For E. coli strains with strong resistance to quaternary ammonium (strains with high MIC values), no significative differences were found between the MIC of single strains and their combinations. Although the majority of the combinations did not differ in survival compared with individual isolates, a combination of O26 and O157 strains showed an additive effect for resistance to the sanitizer. For these two strains with a low MIC value (weak resistance), the combination of C20 and C23 strains showed less sensitivity to the sanitizer than they did as individuals. We conclude that due to C20 having a low survival capacity at the lowest QAC concentrations tested (2.6 ppm), this sensitive strain may have functioned as a “kamikaze” against the active quaternary ammonium and favored the higher persistence of the C23 strain.
In respect of practical findings, this study sheds light on the potential for two strains that exhibit low MIC values to have enhanced survivability when combined. This fact highlights that not only strains with resistance to QAC represent a risk, but even strains with low resistance can survive QAC treatments through cross-protection. However, new studies should be performed to elucidate the mechanisms of action that lead to this cross-protection.
Footnotes
Acknowledgment
Many thanks to Yidong Graham for technical assistance.
Disclosure Statement
No conflicts of interest influenced this study.
Funding Information
The authors would like to thank the Fundação de Amparo à Pesquisa do Estado do Rio de Janeiro (Research Support Foundation of the State of Rio de Janeiro): process no. E-26/201.859/2019. The support of the Beef Cattle Research Council (FOS 01.17) and Results-driven Agricultural Research grant 2021R014R is also gratefully acknowledged.