
Abstract
Companies may have insufficient freight to fill an entire truck/trailer, and instead only pay for space that their products occupy (i.e., “less-than-truckload” shipping; LTL). As LTL delivery vehicles make multiple stops, there is an increased opportunity for product temperature abuse, which may increase microbial food safety risk. To assess LTL effects on Salmonella Typhimurium growth, commercially produced boneless skinless chicken breast fillets were inoculated and incubated under dynamic 2-h temperature cycles (i.e., 2 h at 4°C and then 2 h at 25°C), mimicking a commercially relevant LTL scenario. Bacterial kinetics were measured over 24 h and then observations compared with predictions of three published Salmonella secondary models by bias and accuracy factor measurement. One model produced more “fail-safe” estimates of Salmonella growth than the other models, although all models were defined as “acceptable.” These developed tertiary models can help shippers assess supply chain performance and produce proactive food safety risk management systems.
Introduction
Achieving microbial food safety and quality within supply chains is a significant challenge for the food industry, particularly for temperature-sensitive (i.e., perishable) food. When cold chain integrity is properly maintained, quality, shelf-life, and safety of perishable products are protected (Global Cold Chain Alliance, 2020). However, when disruptions in the cold chain result in temperature abuse (TA), pathogens and spoilage microorganisms replicate (Goedhals-Gerber et al., 2017). Preventing such events is an increasing challenge in multinode supply chains for products harvested, transformed (processed), packaged, and shipped, including the impact of labor shortage (Albertzeth et al., 2020; Hobbs, 2020; Mahajan and Tomar, 2020; Wu and Hsiao, 2021).
The duration of TA varies depending upon factors that constitute the shipping process. For example, certain areas of refrigerated trucks increase in temperature more rapidly than others leading to heterogenous TA of the products inside (Chaitangjit and Ongkunaruk, 2019). These fluctuations in refrigerated trucks have been shown to decrease shelf-life (Herron et al, 2022) and increase food safety risk (Li, et al., 2017) in poultry meat. Specific temperature spikes and their duration will vary greatly depending on the situation. However, studies are needed to build models that work in a wide range of conditions. This includes both worst-case scenarios and more minor TA events.
When companies do not have sufficient freight to fill an entire truck/trailer and only want to pay for space that their products occupy, they often use less-than-truckload (LTL) shipping (FedEx, 2022). This contrasts with full-truckload shipping where companies have sufficient freight to fill the entire truck/trailer (Freightquote, 2022). In the “last mile” (i.e., the last segment of transit) of LTL shipments, delivery vehicles make multiple stops for different shippers utilizing the same truck/trailer, increasing the risk of TA (Lim et al., 2018; Freightquote, 2022). Consequently, it is important for food companies to assess potential microbial risks posed by LTL shipments, using proactive risk management strategies.
Predictive models have been successfully used to design, implement, and measure supply chain performance (McMeekin et al., 2008; Tamplin, 2018). Such models measure effects of environmental factors (e.g., temperature) on microbial growth (Alavi et al., 1999; Juneja et al., 2009; Stavropoulou and Bezirtzoglou, 2019), an approach that is encouraged in USFDA’s “New Era of Smarter Food Safety” (U.S. Food and Drug Administration, 2021). Within the class of perishable food, poultry is highly sensitive to supply chain performance, and managing spoilage and safety has been the focus of numerous modeling studies, including the growth of Salmonella strains on raw (Juneja et al, 2007; Dominguez and Schaffner, 2008; Pothakos et al., 2014) and cooked chicken (Oscar, 1999; Oscar, 2008; Li et al., 2017). However, most of these studies examined Salmonella growth at isothermal temperatures, not dynamic temperature conditions commonly encountered in commercial supply chains. In addition, among studies that have investigated the kinetics of Salmonella growth under dynamic temperature conditions, few include temperatures relevant to common cold chain environments.
To address this problem, we evaluated the performance of three tertiary predictive models utilizing three published secondary models for growth of Salmonella on chicken under simulated LTL conditions.
Materials and Methods
Experimental design
Salmonella Typhimurium growth was measured on commercial boneless skinless chicken breast fillets for three storage temperature scenarios: 4°C, 25°C, and a simulated dynamic LTL profile. Salmonella Typhimurium was chosen as the model organism as it has been previously demonstrated the growth of Salmonella Typhimurium is not statistically different from the growth of other Salmonella serovars in the presence of native microflora of chicken meat (Dominguez and Schaffner, 2008; Morey and Singh, 2012). Each scenario consisted of three independent trials. Salmonella Typhimurium growth and aerobic plate count (APC) were measured at 0, 6, 12, 18, and 24 h for both inoculated and uninoculated fillets. Predictions of published models and experimental results were quantitatively compared.
Chicken samples
Nine batches of commercial boneless skinless chicken breast fillets [n = 297; 3 fillets per sampling time × 5 sampling times × 3 replications × 3 temperature profiles × 2 bacterial measures (Salmonella Typhimurium and APC) + 3 fillets for temperature recording × 9 replications] were procured from a local processor near Auburn, AL, and transferred to the laboratory on ice. Each batch consisted of 33 breast fillets. Tray-packed boneless skinless chicken breast fillets were chosen because they are the cut of poultry meat that has the highest demand and price in retail stores (USDA, 2024).
Inoculum preparation
A culture of nalidixic acid-resistant Salmonella Typhimurium (previously isolated from the Auburn University Poultry Research Farm and selected for resistance to 35 μg/mL nalidixic acid) (Bauermeister et al., 2008; Kataria et al., 2020) was grown for 18 h (ca.108 colony-forming unit [CFU]/mL) in brain–heart infusion broth (Neogen Corporation, Lansing, MI) and then serially diluted to 104 CFU/mL in buffered peptone water (BPW; Neogen Corporation, MI) to produce the working inoculum.
Sample preparation
Sterilized tongs were used to transfer 15 chicken breast fillets to sterile aluminum trays (Heavy Duty Reusable Eco-Friendly Aluminum Foil Full Size Medium Pan, 20.75” L × 12.75” W × 2.2” D, King Zak Industries, Goshen, NY). An additional 15 fillets were placed into individual sterile bags (18 × 30 cm, 1650 mL, VWR, Radnor, PA) for APC enumeration (Neogen Corp., Lansing, MI). Fillets in trays were surface-inoculated with 1 mL of Salmonella Typhimurium suspension, producing 104 CFU per fillet. At the time of surface inoculation, the fillets were at refrigeration temperature (∼4°C) to mimic the conditions of “fresh” poultry meat (USDA, 2013). Trays were then covered and stored at 4°C for 30 min to facilitate bacterial attachment. Next, inoculated fillets were transferred from trays to individual sterile bags using sterilized tongs. Bags were placed in two plastic totes. An additional three different fillets were used to measure fillet internal temperature. Plastic totes were then placed in a programmable incubator (MIR-554 Cooled Incubator, Japan) set to 4 or 25°C for 24 h, or to a cyclic temperature profile of 2 h at 4°C and 2 h at 25°C, repeated for a total of 24 h.
Bacterial enumeration
Immediately (i.e., time = 0) and at other sampling times, three randomly inoculated and three uninoculated fillets were removed from the incubator to enumerate Salmonella Typhimurium and APC.
Fifty milliliters of BPW (Neogen Corporation, MI) was added to each bag (∼9 g of chicken breast per mL of BPW) and then the bags were hand-massaged for 1 min. Fillet rinsates were serially diluted in BPW. For inoculated fillets, 0.1 mL of rinsate was plated, in duplicate, on xylose lysine tergitol 4 agar (XLT4; Neogen Corporation, MI), supplemented with 25 μg/mL nalidixic acid (Sigma-Aldrich, St. Louis, MO). For uninoculated fillets, 0.1 mL of rinsate was plated, in duplicate, on APC agar (Neogen Corporation, MI). All plates were incubated at 37°C for 24 to 48 h before colony enumeration. Bacterial counts were reported as log CFU/mL rinsate.
Statistical analyses
A three-way (trial × temperature scenario × time) analysis of variance (ANOVA) with Tukey’s HSD post hoc test was used to compare growth data for both Salmonella Typhimurium and APC. This is a commonly used method (Acosta et al., 2017; Peng et al., 2022) that allows researchers to assess whether there is a significant change in bacterial populations over time and under specific conditions. For each trial and temperature scenario (i.e., 4°C, 25°C, and TA), the average bacterial population at 0, 6, 12, 18, and 24 h. All statistical analyses were conducted using STATA 18.5 (StataCorp, College Station, TX).
Temperature monitoring
A type K thermocouple attached to a data logger (TM500: 12-Channel Data Logging Thermometer, Extech Instruments, Nashua, NH) was inserted into the approximate center of each of the three chicken fillets that were used only for temperature measurement. Temperature was recorded every 60 s for 24 h. Following each experimental trial, logger data were downloaded into an Excel spreadsheet (version 16, Microsoft Corporation, Redmond, WA).
Models
Primary models. Kinetic parameters of lag time and growth rate (GR) were determined for experimental Salmonella Typhimurium and APC (collected under isothermal 25°C conditions) data using the online software DMFit (www.combase.cc) and the primary model of Baranyi and Roberts (1994).
Secondary models. For raw chicken skin inoculated with Salmonella Typhimurium, lag phase as a function of temperature was modeled by Oscar (2009) (Eq. 1),
Using the square root model of Ratkowsky et al. (1983) (Eq. 2), a secondary GR model was developed from the primary GRs reported by Oscar (2009) for Salmonella Typhimurium on chicken skin over a temperature range of 25°C to 45°C.
Two additional GR models for Salmonella, both using the Ratkowsky et al.’s (1982) algorithm (Eq. 3), were evaluated in a tertiary model,
Model performance was measured using bias (B f ) and accuracy factors (A f ), following the methods of Oscar (2005) and Ross (1996). Ross (1996) recommended limits for B f ranging from 0.7 to 1.15 when considering GR. There is more forgiveness for “fail-safe” models than “fail-dangerous” models. Because we use bacterial concentration in our study and not GR, the range is flipped (i.e., the acceptable range is 0.85–1.30). Oscar (2005) expanded this and recommended that if a model has a B f less than or equal to 1.0, then the A f should be less than 1.3. On the contrary, if the B f is greater than 1.0, the A f should be less than 1.5.
Tertiary model. The Excel-based tertiary model interface integrated Oscar’s (2009) secondary lag time model, plus the secondary GR models of Oscar (2009), Noviyanti et al. (2018), or Zaher and Fujikawa (2011). These secondary models were used to estimate Salmonella growth as a function of time; model prediction range was extended for simulated LTL temperature profiles.
Results and Discussion
APC of raw chicken fillets at 4 and 25°C
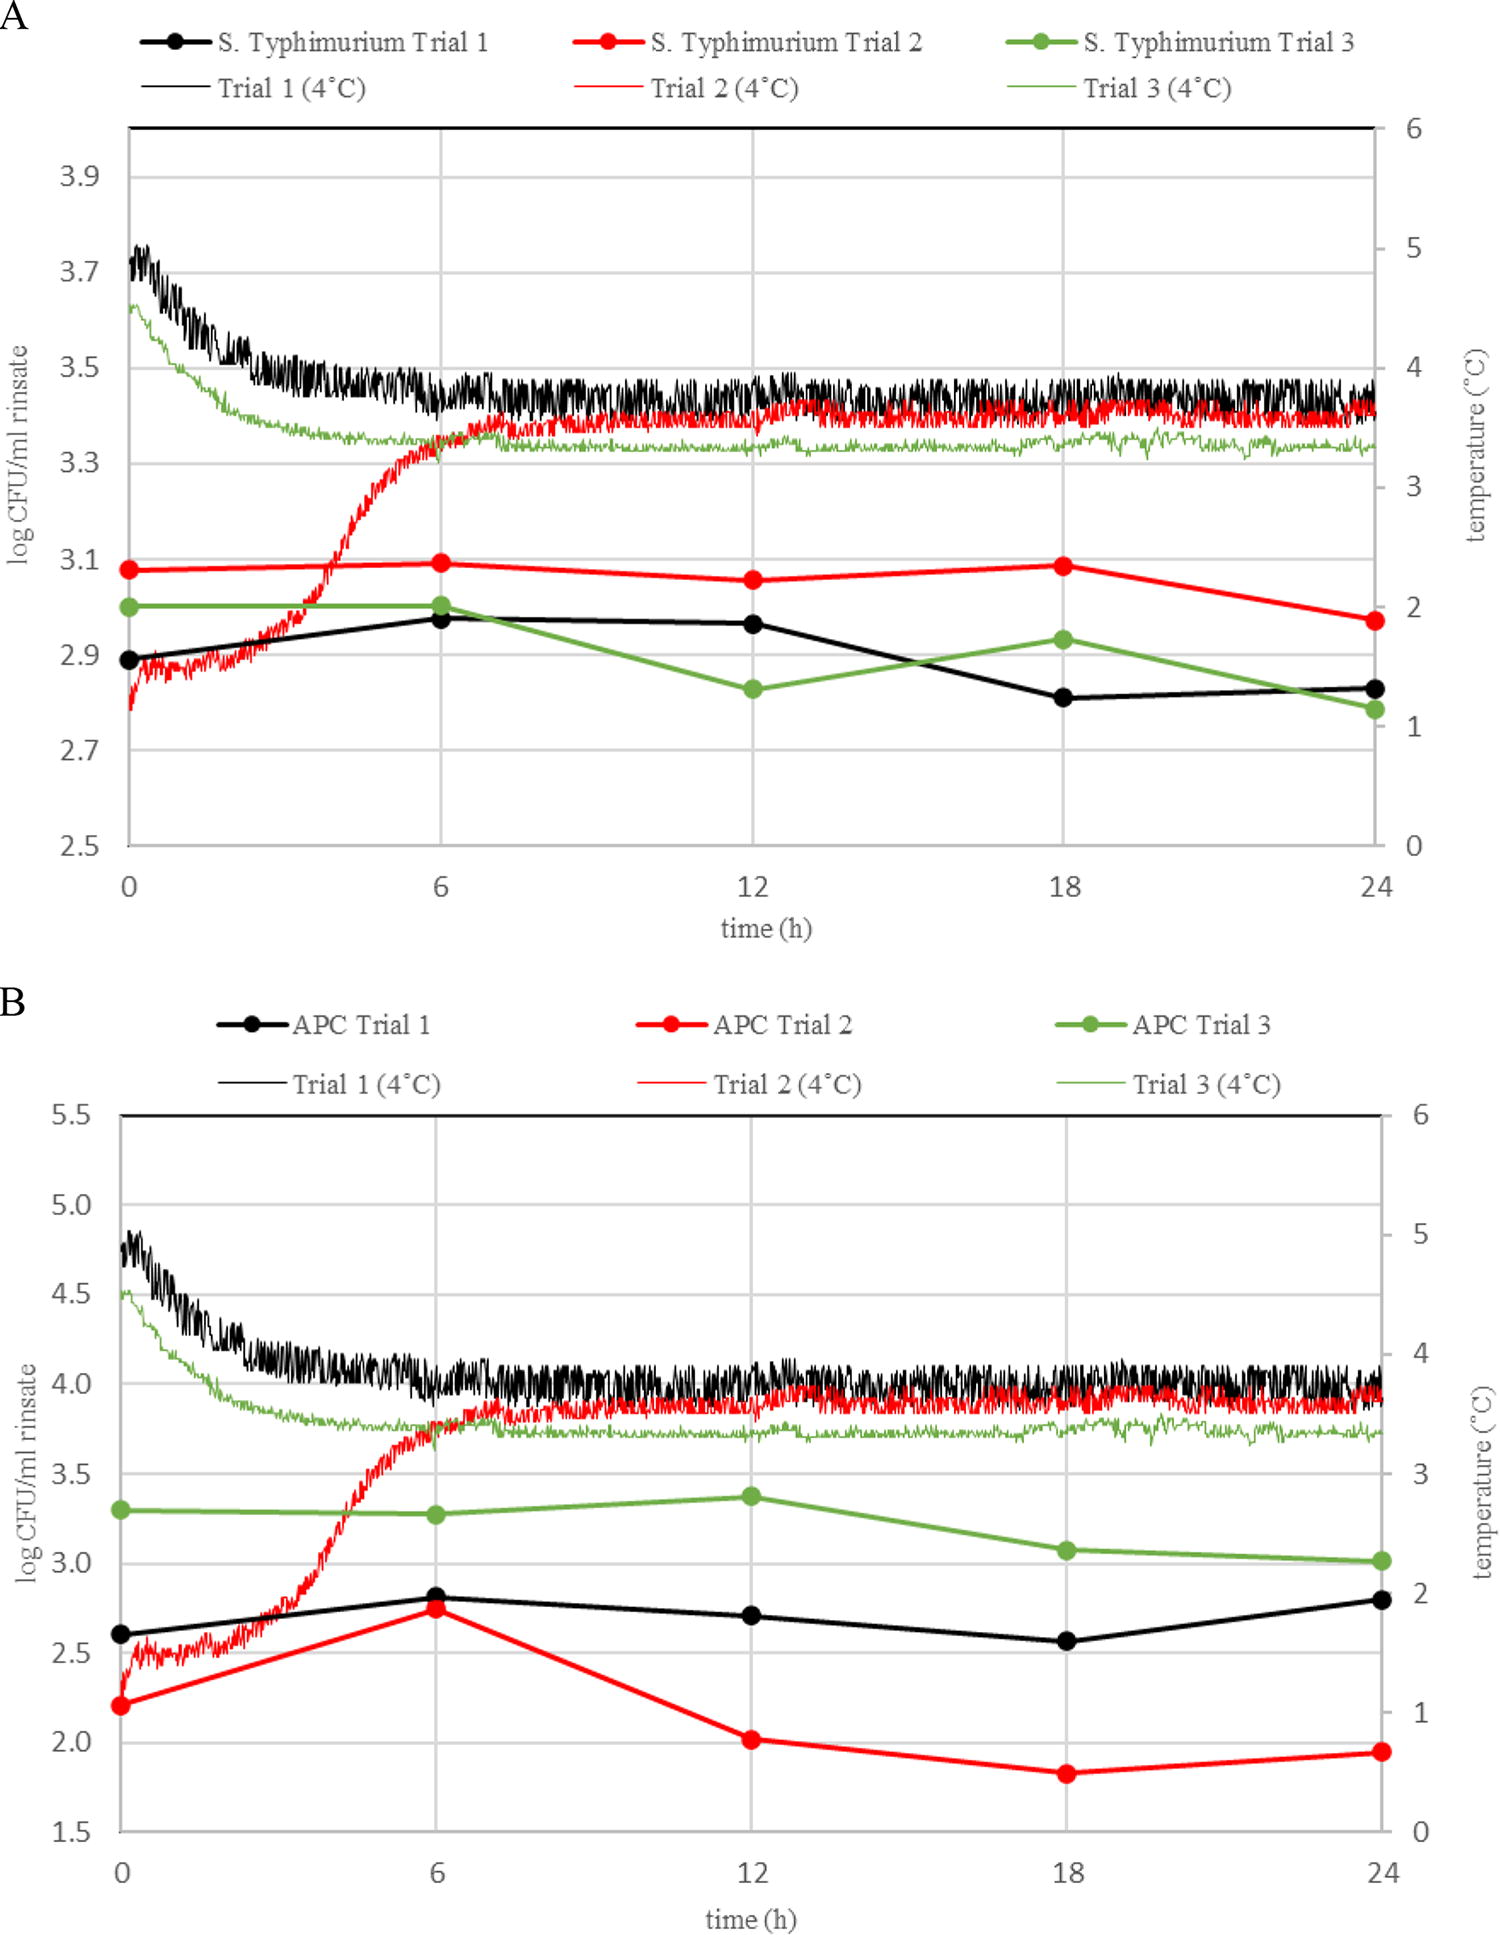
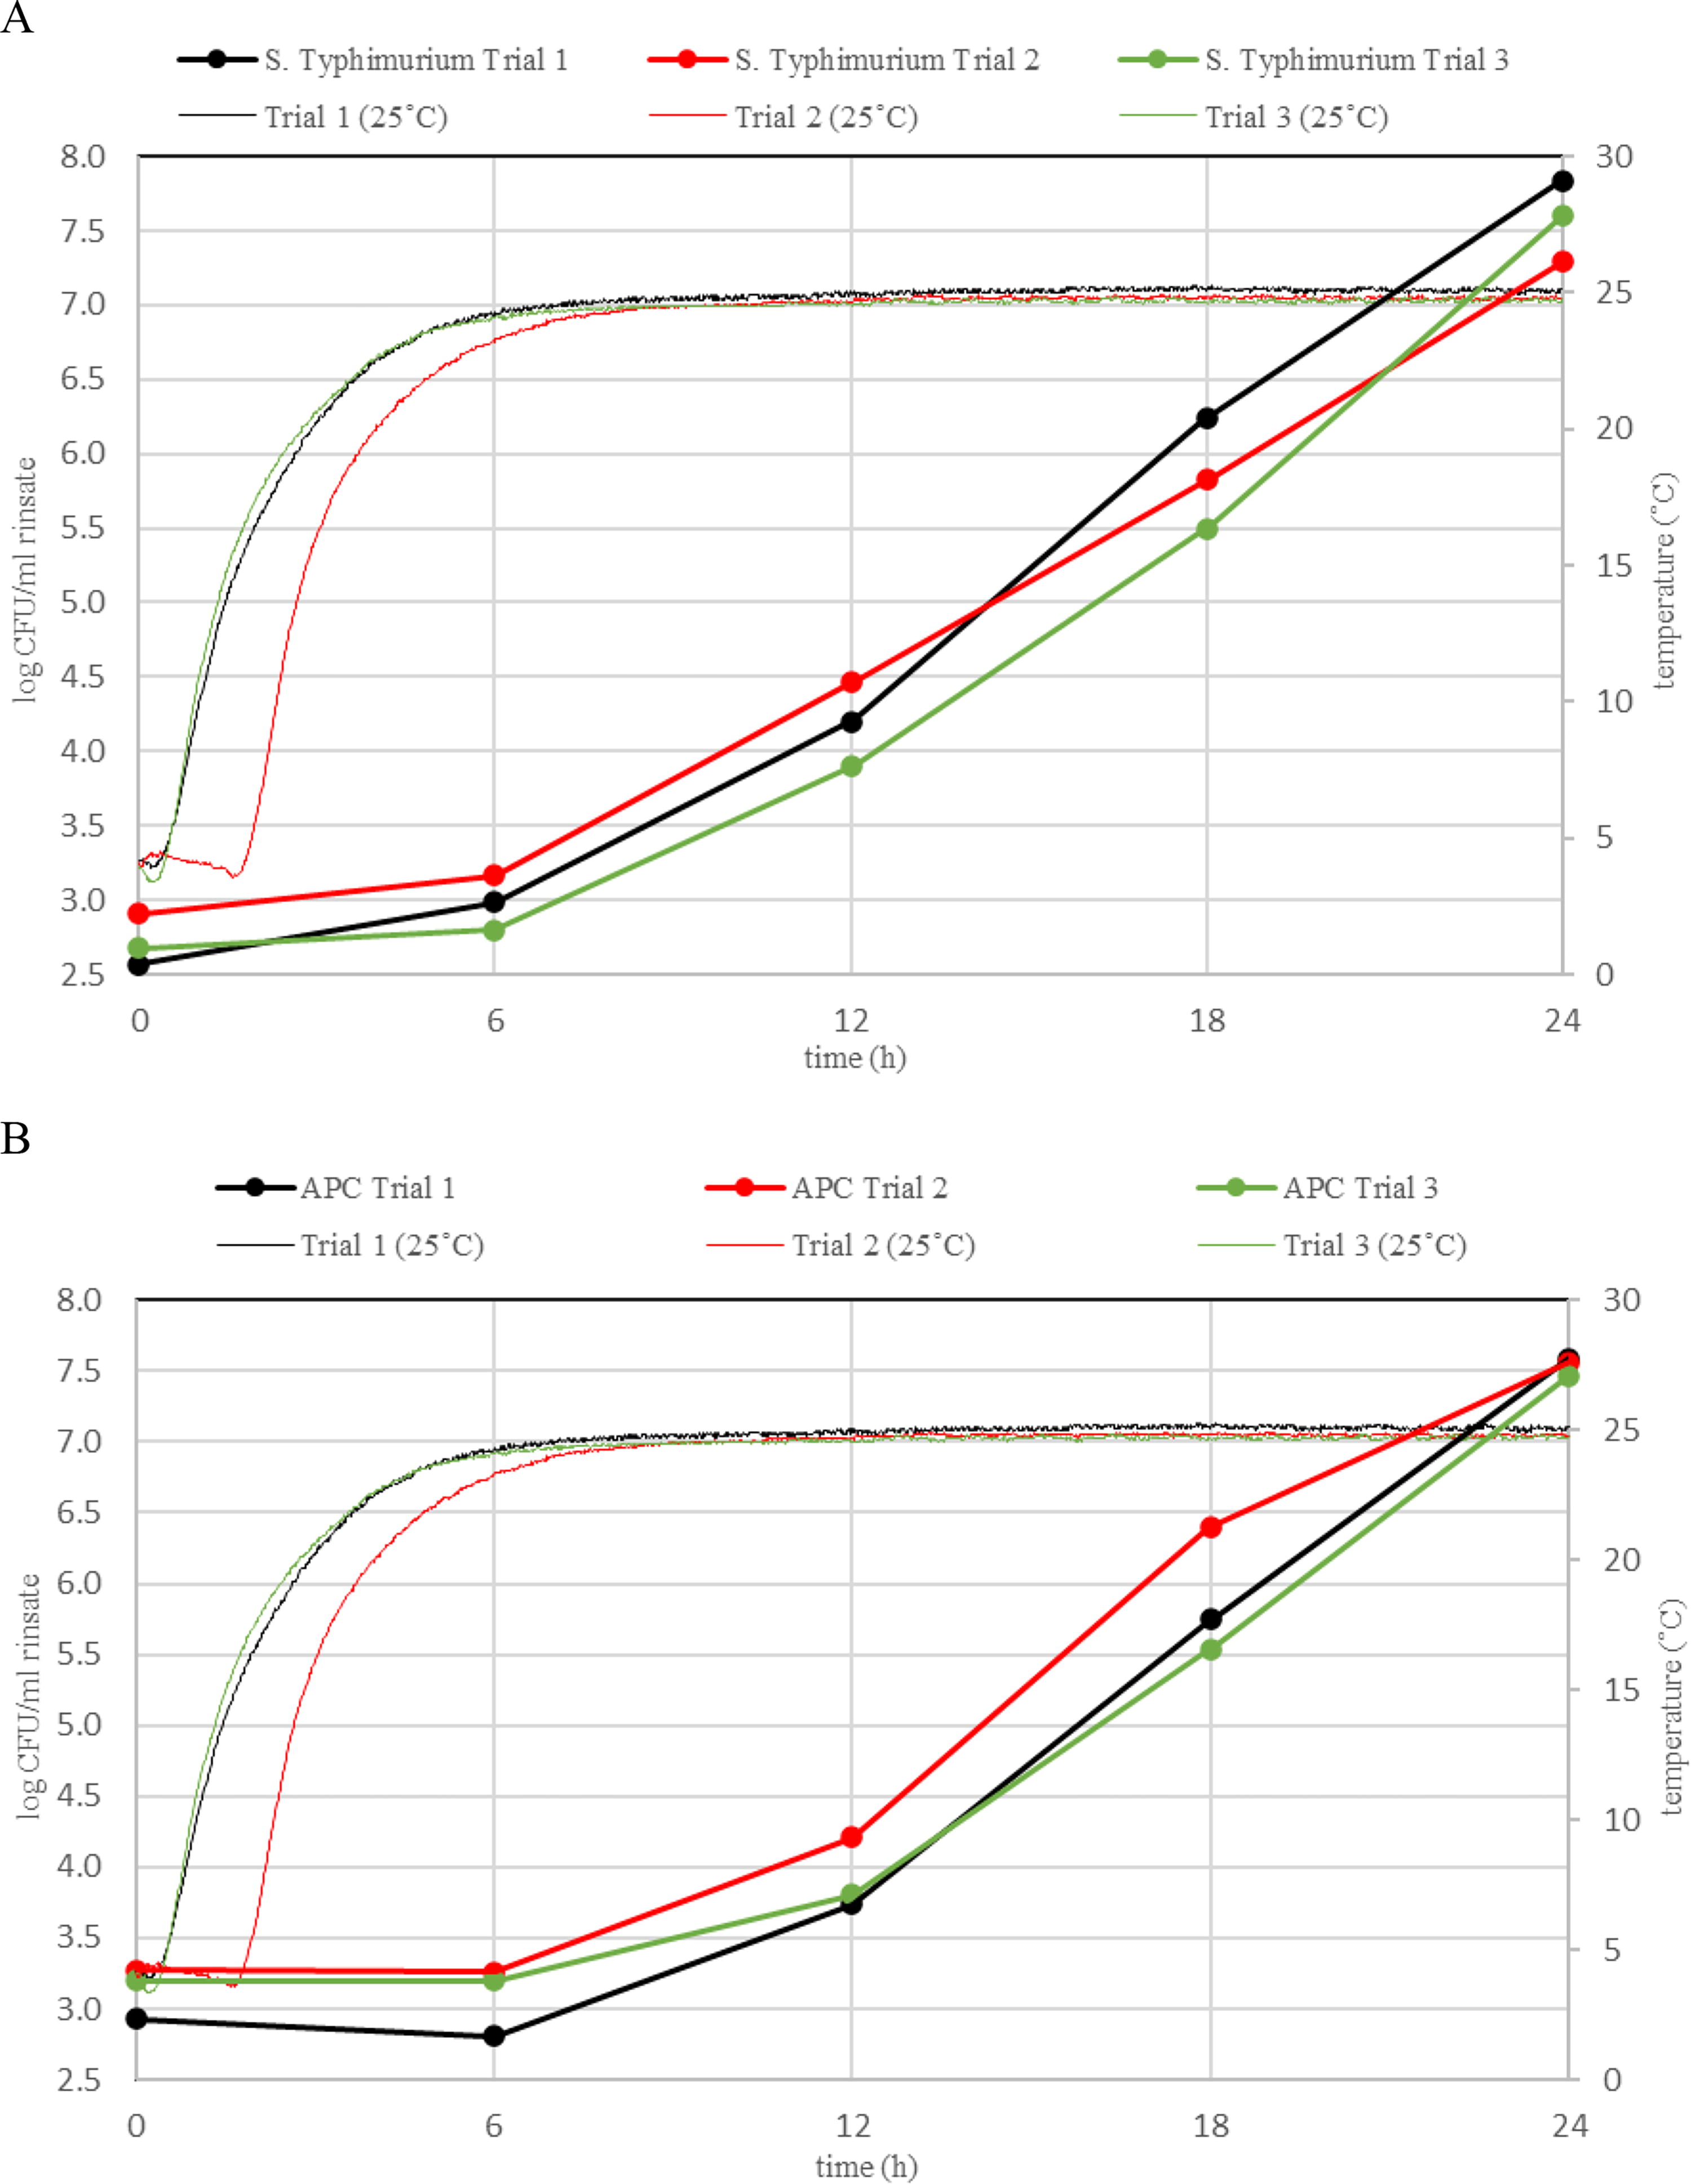
Measuring the APC alongside Salmonella creates a more comprehensive evaluation of the food product (i.e., chicken breast) by providing information of the impact on quality, in addition to the impact on safety demonstrated by Salmonella Typhimurium. At 4°C (Fig. 1), we did not observe significant growth (p < 0.05) in any of our trials when comparing 0 h and 24 h. This is consistent with previous research as most bacteria do not rapidly grow below 4°C (Wimpfheimer et al., 1990; Senter et al., 2000; Morey and Singh, 2012). A slightly lower initial temperature (∼ 3°C difference) was observed for trial 2; however, this likely did not impact bacterial growth as no statistical significance was observed. At 25°C (Fig. 2), APCs increased by 4.7, 4.3, and 4.3 log CFU/mL for trials 1, 2, and 3, respectively. Again, this is consistent with previous research (Pooni and Mead, 1984; Russell et al., 1996). Significant differences (p < 0.05) were calculated for all three trials when comparing the values at 0 with 12, 18, and 24 h.
Salmonella Typhimurium
Salmonella Typhimurium
APC of raw chicken fillets under simulated LTL conditions
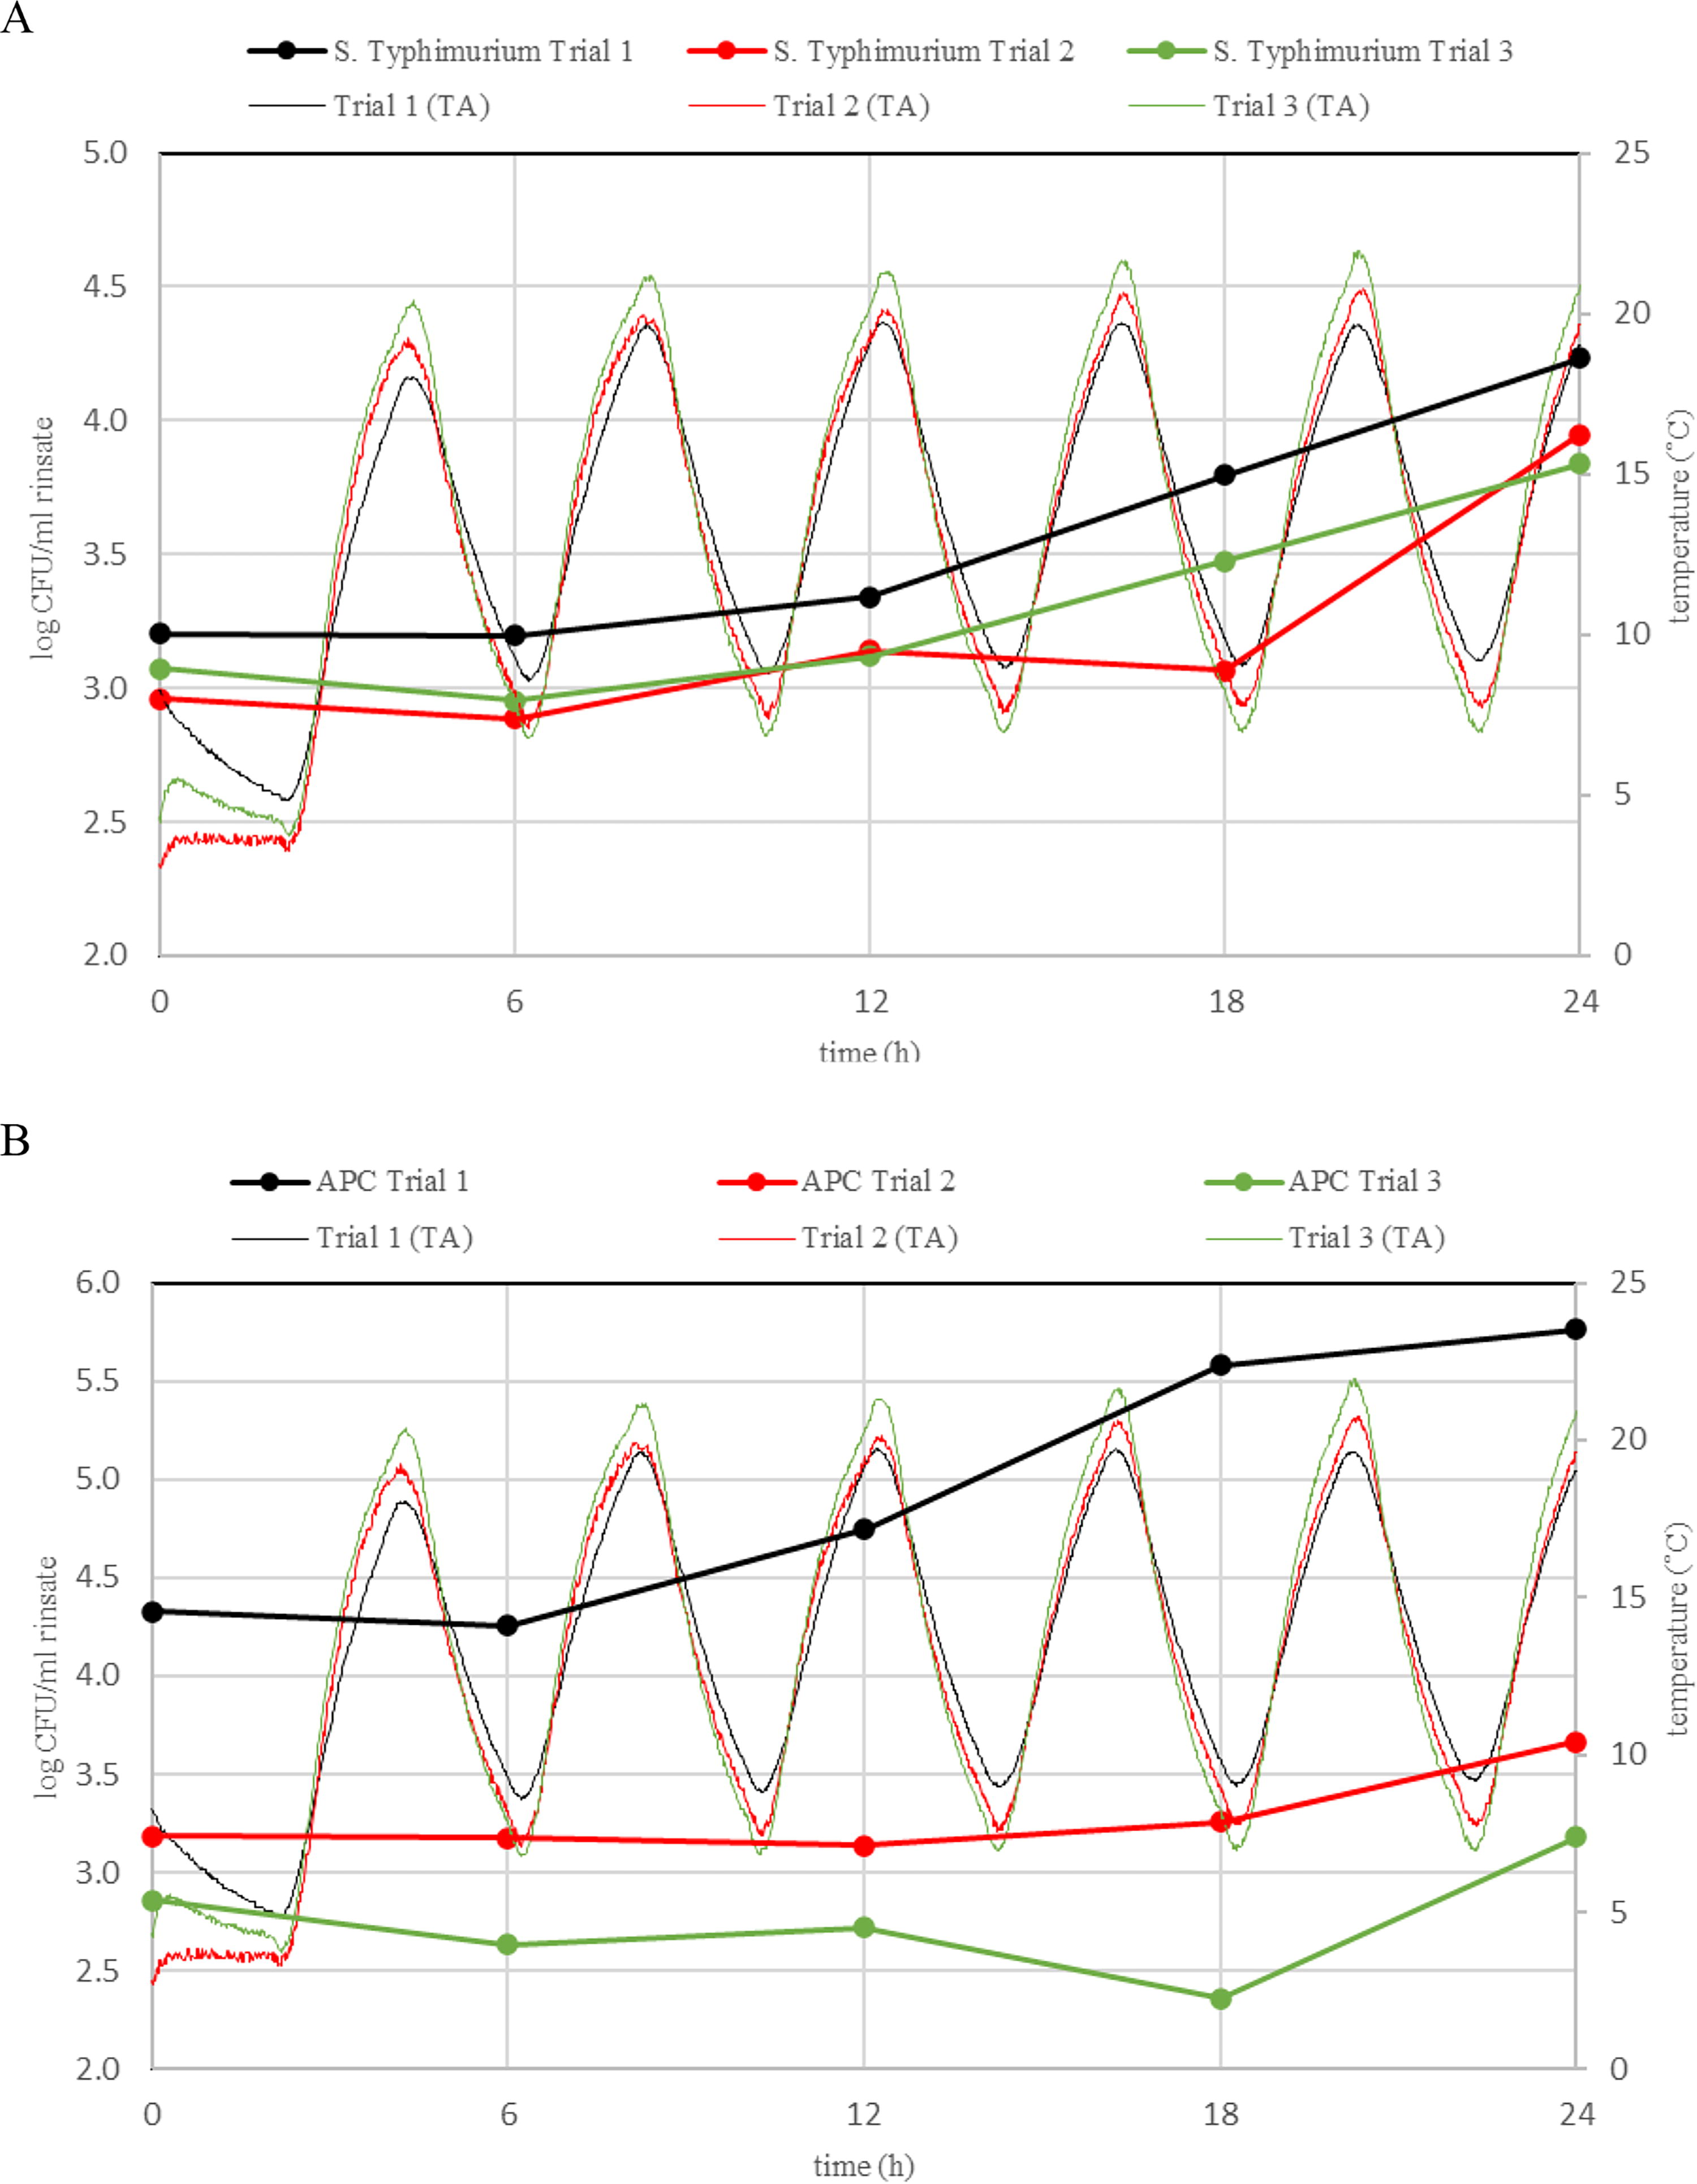
Chicken fillets were exposed to 2-h cyclical TA profiles over 24 h (Fig. 3). An increase of 1.4, 0.5, and 0.3 log CFU/mL (0.7 log CFU/mL average) was observed for trials 1, 2, and 3, respectively. Trial 1 had a higher initial concentration (4.3 log CFU/mL) compared with trials 2 (3.2 log CFU/mL) and 3 (2.9 log CFU/mL). This may have contributed to the higher APCs observed. Previous research has yielded similar results (Herron et al., 2022). Our statistical analysis revealed significant growth (p < 0.05), compared with 0 h, after 18 and 24 h for trial 1, after 24 h for trial 2, and after 18 h for trial 3. While the primary goal of this research was to develop a Salmonella growth model, the results of our secondary research objective (i.e., measuring APC growth as a reference point for future studies) provide insights into how LTL TA results in an elevated spoilage rate for temperature-sensitive products.
Salmonella Typhimurium
Growth of Salmonella Typhimurium on raw chicken fillets at 4 and 25°C
Salmonella Typhimurium did not have statistically significant (p < 0.05) growth on raw chicken fillets at 4°C during the 24-h incubation period (Fig. 1), consistent with previous reports (Matches and Liston, 1968; Morey and Singh, 2012). At 25°C (Fig. 2), Salmonella Typhimurium concentrations increased by 5.3, 4.4, and 4.9 log CFU/mL for trials 1, 2, and 3, respectively. The average lag time and GR for Salmonella Typhimurium for the three trials were 6.9 h and 0.285 log CFU/h, respectively, compared with 5.3 h and 0.469 log CFU/h, respectively, as reported by Oscar (2009) for Salmonella Typhimurium growth on raw chicken skin. Noviyanti et al. (2018) reported a GR of 0.148 log CFU/h for Salmonella Enteritidis in raw chicken juice, and Zaher and Fujikawa (2011) reported a GR of approximately 0.6 log CFU/h for Salmonella Enteritidis in raw ground chicken. Significant differences (p < 0.05) in Salmonella growth were observed, compared with 0 h, after 6, 12, 18, and 24 h for trial 1, after 6, 12, 18, and 24 h for trial 2, and after 12, 18, and 24 h for trial 3.
Differences in GR among independent studies can be influenced by different background species (Nemergut et al., 2013), as well as other environmental factors such as gaseous environment and bacterial production of antimicrobials (Murphy et al., 2001; Porter et al., 2020).
Growth of Salmonella Typhimurium on raw chicken fillets under simulated LTL conditions
Consistent with the fillets used for APC, chicken fillets were exposed to 2-h cyclical TA profiles over 24 h (Fig. 3). Fillets in the TA scenario were exposed, on average, to 16.8 h above 10°C (Fig. 3). This has been shown to be an important temperature threshold for the growth of Salmonella serovars on poultry (Morey and Singh, 2012). Salmonella Typhimurium increased by 1.0, 1.0, and 0.8 log CFU/mL for trials 1, 2, and 3, respectively. Our statistical analysis showed significant (p < 0.05) growth of Salmonella Typhimurium compared with 0 h after 18 and 24 h for trial 1, after 24 h for trial 2, and after 18 and 24 h for trial 3. A slight decrease in bacterial concentration resulted in nonsignificance in trial 2 after 18 h. We attribute this to factors such as sampling variation (Nagendra et al., 2001) and intrinsic factors (Galarz et al., 2016).
The intent of the present study was to simulate commercially relevant conditions encountered under LTL shipping. This included using nonsterile tray-packed chicken meat and a dynamic temperature profile (Fig. 3), specifically 2-h cyclic conditions at 4 and 25°C, with the latter temperature being commonly used in TA studies (Ababouch et al., 1991; Ahmed, 2019; Raffo et al., 2021). The 2-h cycle was selected since it represents a common loading/unloading time interval for trucks (Dunn et al., 2014). Overall, the results of these studies demonstrate that temperature-sensitive products exposed to TA in a simulated LTL cold chain may increase the GR of Salmonella potentially leading to an increased risk of salmonellosis.
Evaluation of tertiary models to estimate Salmonella Typhimurium growth during LTL conditions
Various predictive models have been developed for Salmonella viability on raw, cooked, and irradiated chicken, including isothermal and dynamic models (Oscar, 1999; Oscar, 2002; Dominguez and Schaffner, 2008; Oscar, 2008; Yimenu et al., 2019). Among these, tertiary models incorporate secondary models developed for raw chicken products, thereby including the effects of endogenous background spoilage bacteria on Salmonella growth.
In the present study, secondary models from three published studies were utilized: (1) a report by Oscar (2009) describing Salmonella Typhimurium lag time and GR on raw chicken skin from 25°C to 45°C; (2) a study by Noviyanti et al. (2018), who measured GR of Salmonella Enteritidis in raw chicken juice from 10°C to 35°C, and 3) a report by Zaher and Fujikawa (2011) for Salmonella Enteritidis GR in raw ground chicken from 12°C to 32°C. Since only Oscar (2009) modeled lag time, this secondary was used in all tertiary models.
The LTL time-temperature profile (Fig. 3) for each of the three trials and the initial inoculum level were inputs for each tertiary model (Fig. 4). Models B f and A f were 1.031 and 1.047, 0.963 and 1.049, and 0.981 and 1.034 for the Oscar (2009), Noviyanti et al. (2018), and Zaher and Fujikawa (2011) GR models, respectively. These performance measurements fall within the acceptable prediction zone, as defined by Oscar (2005) and Ross (1996). Considering B f reflects the average relative distance between observation and prediction, the tertiary model that utilizes the GR of Oscar (2009) model may be a preferred fail-safe model for use by supply chain risk managers.

Ideally, this model would be tested using data obtained from actual LTL poultry delivery to retail stores. To provide robustness and validity to the model, we took care to create realistic (although extreme) scenarios in the experimental design. Furthermore, A f and B f fall within the acceptable range and provide validity to the model.
Conclusions
Under LTL shipping conditions, products are exposed to dynamic TA scenarios when trucks unload cargo at multiple destinations. This study developed tertiary models for chicken producers and shippers to more proactively manage risk of LTL temperature conditions on Salmonella growth, as well as to evaluate supply chain performance. Comparison of the three tertiary models created from three previously published secondary models for GR was performed. The model utilizing the Oscar (2009) GR outperformed the other models when compared with our experimental data. Models such as these are becoming increasingly relevant due to increased use of real-time thermal sensors in food supply chains (Tamplin, 2018; Tsang et al., 2021).
Footnotes
Authors’ Contributions
C.H. led the project, led data collection/investigation, and was the primary writer of the article. M.T. contributed to the methods (led the mathematical modeling), formal analysis of data, visualization of the results, project supervision, and revising the article. A.S., B.W., and M.T.B. aided in the investigation portion of the project. L.G. provided project administration, project supervision, and helped in revising the article. T.H. and S.R. helped in conceptualization and idea formulation. Lastly, A.M. obtained funding for the project and contributed to the conceptualization of the project, project administration, obtaining resources, project supervision, and revising the article.
Disclosure Statement
No competing financial interests exist.
Funding Information
Funding was provided via a grant from the Foundation of Food & Agriculture Research (FFAR). It was grant number: 593601.