
Abstract
The aim was to longitudinally evaluate the association between antimicrobial exposure and resistance occurrence within generic Escherichia coli and Enterococcus spp. populations in feedlot beef cattle raised conventionally or raised without antimicrobials. Angus steers (n = 180) were sorted into 1 of 2 treatments over 2 consecutive years (108 in yr 1 and 72 in yr 2): steers raised without antimicrobials (NAT) and conventionally raised steers exposed to antimicrobials (CONV). Pens within treatment were adjacent and separated by five empty pens from the other treatment. Monensin and tylosin were included in CONV steer diets. On d 123, CONV steers received a metaphylactic antimicrobial. Longitudinal diet (n = 6/year) and fecal (n = 5/year) sampling timepoints were collected to determine E. coli and Enterococcus spp. concentration, prevalence, and resistance patterns. Dietary Enterococcus spp. concentrations, and erythromycin (8ERYR; 128ERYR), tetracycline (TETR), trimethoprim-sulfamethoxazole (COTR), and cefotaxime (CTXR) resistant E. coli concentrations and prevalence were greater in NAT diets than CONV diets (p < 0.02). Fecal E. coli concentrations tended to be greater in NAT steers than CON steers (p = 0.07). Fecal TETR E. coli concentrations were greater in CONV steers than NAT steers (p = 0.03). Fecal COTR and CTXR E. coli prevalence was greater for CONV steers at the beginning of the finishing phase while greater for NAT steers at the end of the finishing phase (p < 0.01). Fecal Enterococcus spp. concentrations did not differ between treatments (p = 0.11). Concentrations of 8ERYR and 128ERYR Enterococcus spp. were greater in CONV steers on d 64, 130, and 168 than NAT steers (p < 0.05). Overall, antimicrobial resistant Enterococcus spp. and E. coli were detected regardless of antimicrobial exposure.
Introduction
In 2017, the U.S. Food and Drug Administration (FDA) implemented the Veterinary Feed Directive (VFD) to mitigate imprudent use of antimicrobial drugs (AMD) in livestock. Although there is debate regarding the contribution of livestock-derived AMD use toward human antimicrobial resistant (AMR) infections, consumer perception has prompted a critical examination of medically important AMD use in cattle. The World Health Organization (WHO) defines a medically important AMD as any antimicrobial used in human medicine and categorizes importance based on (1) sole, or limited availability of therapies, to treat serious bacterial infections in humans and (2) use to treat infections caused by bacteria from nonhuman sources or with resistance genes from nonhuman sources (WHO, 2019).
In 2020, cattle accounted for 41% of medically important AMD use in livestock (FDA, 2022). Metaphylactic administration and dietary supplementation of AMD are common in the beef industry. Metaphylaxis is the treatment of a large cohort or entire population to provide therapy to infected animals and prophylaxis to animals potentially susceptible to disease. Injectable antimicrobials used for metaphylaxis, such as cephalosporins and sulfonamides, are considered critically and highly important AMD to veterinary medicine, respectively (FDA, 2022). Ionophores are commonly fed in the beef industry, but not considered medically important to human medicine. Conversely, though tylosin is a veterinary antimicrobial, its classification as a macrolide makes it critically important to human medicine because of potential cross-resistance to other macrolides like erythromycin (WHO, 2019).
Cattle potentially pose as reservoirs for pathogenic bacteria, like Salmonella, Escherichia coli, and Enterococcus spp. Cazer et al. (2020) observed an increase in erythromycin-resistant Enterococcus spp. 100 days after feeding tylosin to cattle. Although 75% of fecal samples harbored cephalosporin-resistant E. coli at harvest, no isolates were found in the final beef product (Schmidt et al., 2015).
Although most antimicrobials are administered early in the feeding period when cattle morbidity is greater, antibiotics can be administered at any time during the feeding period if the withdrawal period is monitored before harvest. Nevertheless, heightened consumer awareness of AMR has increased the demand for “natural” beef products from cattle raised without antimicrobials. Labels containing such statements are perceived as harboring decreased levels of antimicrobial resistant bacteria than conventionally raised beef (Schmidt et al., 2021). Nevertheless, other studies have reported no differences in antimicrobial resistant bacterial concentrations between cattle raised conventionally and raised without antimicrobials (Vikram et al., 2017; Zhang et al., 2010). Therefore, the objective of this study was to longitudinally evaluate the association between AMD exposure and AMR in generic E. coli and Enterococcus spp. populations in beef cattle raised in the same environment conventionally or raised without antimicrobials.
Materials and Methods
All experimental procedures were approved by the U.S. Meat Animal Research Center Institutional Animal Care and Use Committee (approval number 57.1) and conducted from October 2017 to May 2018.
Animal management
This study was conducted over 2 years (2017 and 2018). Before weaning in the autumn of each year, Angus dam and calf health records were used to identify and sort steer calves into 1 of 2 treatments: conventionally raised steers (CONV; n = 100 steers/year) exposed to antimicrobials and steers raised without antimicrobials (NAT; n = 100 steers/year).
Before weaning each year, steers were identified as potential candidates for CONV or NAT treatment based on herd health records. Only steers that had never been given an antimicrobial were eligible for use in the NAT treatment. In year 1 before weaning, for the CONV treatment, 36 steers had been administered antimicrobials before weaning: 28 were administered tulathromycin (macrolide), 1 was administered oxytetracycline (tetracycline), 2 were administered tildipirosin (macrolide), 2 were administered oxytetracycline (tetracycline) and tildipirosin (macrolide; 33 days apart), 1 was administered florfenicol (thiamphenicol), and 2 were administered ceftiofur crystalline free acid (cephalosporin) and tildipirosin (macrolide; 42 days apart). In year 2 before weaning, for the CONV treatment, 46 steers had been administered antimicrobials before weaning: 18 were administered tildipirosin (macrolide), 27 were administered tulathromycin (macrolide), and 1 was administered ceftiofur crystalline free acid (cephalosporin) and then tildipirosin 82 days later.
At weaning each year approximately 60 d before the start of the study, steers were transported to the feedlot and housed in 8 pens (n = 20 to 25 steers/pen). Treatments were separated by 2 empty pens. All pens were cleaned before steer arrival. Once at the feedlot, steers in the NAT pen groups requiring treatment with an antimicrobial were removed from the study before d 1 and not returned to the pen (n = 3 steers removed yr 1 and n = 7 steers removed yr 2). All steers were vaccinated against clostridial species (Vision 7 with SPUR; Merck Animal Health, Kenilworth, NJ) and Bovine Rhinotracheitis-Virus and Diarrhea-Parainfluenza 3-Respiratory Syncytial Virus (Vista 5 SQ; Merck Animal Health). All steers were fed a forage-based diet without antimicrobials. On d 3 before study start, steers were individually weighed and given a coccidiostat (Deccox; Zoetis, Parsippany, NJ). Steers with similar body weight (n = 108 steers in yr 1 and 72 steers in yr 2) were used in the study and allotted randomly to pens within treatment based on previous antimicrobial exposure.
A washed trailer was used to transport steers on d 1 to newly renovated feedlot pens. The NAT steers were transported first to avoid cross contamination with CONV steers. Renovated pens last contained cattle in 2014. New concrete aprons, feed bunks, fencing, barn siding, and automatic water tanks were installed before study start. Soil was excavated and replaced with fresh soil from an area without cattle presence. The pen layout consisted of partially covered concrete pads at the north end with soil surface to the south.
Steers were sorted into 18 pens (9 pen block/treatment) containing 6 steers/pen in year 1 and 4 steers/pen in year 2. Treatments were separated by 5 empty pens to prevent cross-contamination. Starting on d 0, all steers were fed a high-concentrate diet in which the diets were identical apart from monensin (300 mg/steer daily; Rumensin 90; Elanco Animal Health, Greenfield, IN) and tylosin (85 mg/steer daily; Tylan-40, Elanco Animal Health), which were included in CONV steer diets from d 0 to 168 to mimic the commercial beef industry. Separate feed trucks were assigned to each treatment to prevent cross-contamination of antimicrobials in the diet.
To represent the control of late day disease outbreaks in feedlots (e.g., metaphylaxis), CONV steers were assigned randomly within pen to a subcutaneous injection of 1 of 4 antimicrobials (each steer was given only 1 antimicrobial) on d 123 to evaluate the effects of an antimicrobial administered near the end of the finishing period (approximately 50 d before harvest). Antimicrobials included tulathromycin (Draxxin; Zoetis), ceftiofur (Excede; Zoetis), florfenicol (Nuflor; Merck Animal Health), and enrofloxacin (Baytril 100; Bayer USA, Whippany, NJ). The NAT steers were administered 5 mL sterile saline injection. From d 0 to 168, no NAT steers were removed for antibiotic therapy, and all CONV and NAT steers completed the study each year. On d 168, steers were individually weighed and transported to a commercial abattoir for harvest.
Sample collection
Fecal samples were aseptically collected via rectal palpation on d 0, 64, 123, 130, and 168. Likewise, mixed diet samples were also collected directly from the feed bunks. All samples were transferred into sealable plastic bags and placed into a cooler with ice to maintain a temperature between 0°C to 4°C before analysis.
Sample processing for Escherichia coli and Enterococcus spp
Microbial analysis of fecal and diet samples for E. coli and Enterococcus spp. was conducted as reported by Agga et al. (2016). Briefly, 10 g of sample was enriched in a 1:10 dilution of Tryptic Soy Broth (TSB; Becton Dickinson and Company, Franklin Lakes, NJ) containing 100 mM potassium phosphate buffer (18 mM KH2PO4 and 82 mM K2HPO4, pH 7.2; Sigma–Aldrich, St. Louis, MO). After homogenizing the enriched sample, 500 µL was subsampled for total and AMR bacterial enumerations. The remaining homogenate was enriched for 8 h at 37°C to determine total AMR bacterial prevalence. To determine bacterial enumerations, 50 µL of homogenate was spiral plated (WASP Touch; Don Whitley Scientific, West Yorkshire, UK) onto CHROMagar E. coli (DRG International Inc., Springfield, NJ) or CHROMagar ECC (DRG International Inc.). Targeted AMR E. coli populations were cefotaxime-resistant (CTXR, 2 mg L−1 cefotaxime), tetracycline-resistant (TETR, 32 mg L−1 tetracycline), and trimethoprim-sulfamethoxazole-resistant (COTR, 4 mg L−1 trimethoprim and 76 mg L−1 sulfamethoxazole). A higher TETR breakpoint was used because we used agar media and the CLSI break points (i.e., 8 mg L−1 for TETR) are based on liquid media. Erythromycin-resistant (8ERYR, 8 mg L−1; 128ERYR, 128 mg L−1 erythromycin) E. coli and Enterococcus populations were also targeted. Although 8 is the CLSI breakpoint for ERYR, the medically important Enterococcus tend to have higher concentrations at 128 mg L−1 erythromycin or higher. Most E. coli was sensitive to 128 mg L−1 erythromycin and using only 8 mg L−1 is diluting out a lot of the medically important Enterococcus strains. After incubation at 37°C for 8 h, phenotypic E. coli colonies were selected and confirmed by polymerase chain reaction (PCR) using the uidA gene Phenotypic Enterococcus spp. were confirmed by PCR for soda (Jackson et al., 2004). Resistance levels were established using the National Antimicrobial Resistance Monitoring System.
Statistical analysis
Data expressed in colony-forming unit (CFU/g) were log10 transformed (1og10 CFU g−1 of feces or diet) for bacterial concentration analyses. The lower limit of detection for enumeration was set at 200 CFU/g (2.3 log10 CFU g−1).
The study was a completely randomized design. Individual steer was the observational unit, with pen considered the experimental unit. Bacterial enumeration and prevalence were averaged within pen before analysis. The MIXED procedure of SAS 9.4 (SAS Inst., Cary, NC) was used with fixed effects of treatment, day, and treatment × day interaction included in the model. Pen nested within a treatment × year interaction was included as a random effect. Autoregressive (1) covariance structure provided the smallest Akaike and Schwarz Bayesian criteria and considered the most appropriate for analysis. A p ≤ 0.05 was considered significant, and tendencies were discussed at 0.05 < p ≤ 0.10.
Results
Total and AMR E. coli and Enterococcus concentrations in the diet
Total generic E. coli and Enterococcus spp. concentrations were greater in the diet fed to NAT steers than CONV steers (p < 0.01; Table 1). Similarly, both 8ERYR and 128ERYR E. coli and Enterococcus spp. concentrations were greater in the diet fed to NAT steers than CONV steers (p < 0.01). Diets provided to NAT steers had greater TETR E. coli concentrations than that provided to CONV steers (p < 0.01). Prevalence of COTR (p = 0.02) and CTXR (p < 0.01) in E. coli in the diet fed to NAT steers was greater than that provided to CONV steers.
Total and Antimicrobial Resistant Escherichia coli and Enterococcus spp. count and Prevalence in Feedlot Diets for Steers Raised Conventionally or Raised Without Antimicrobials a
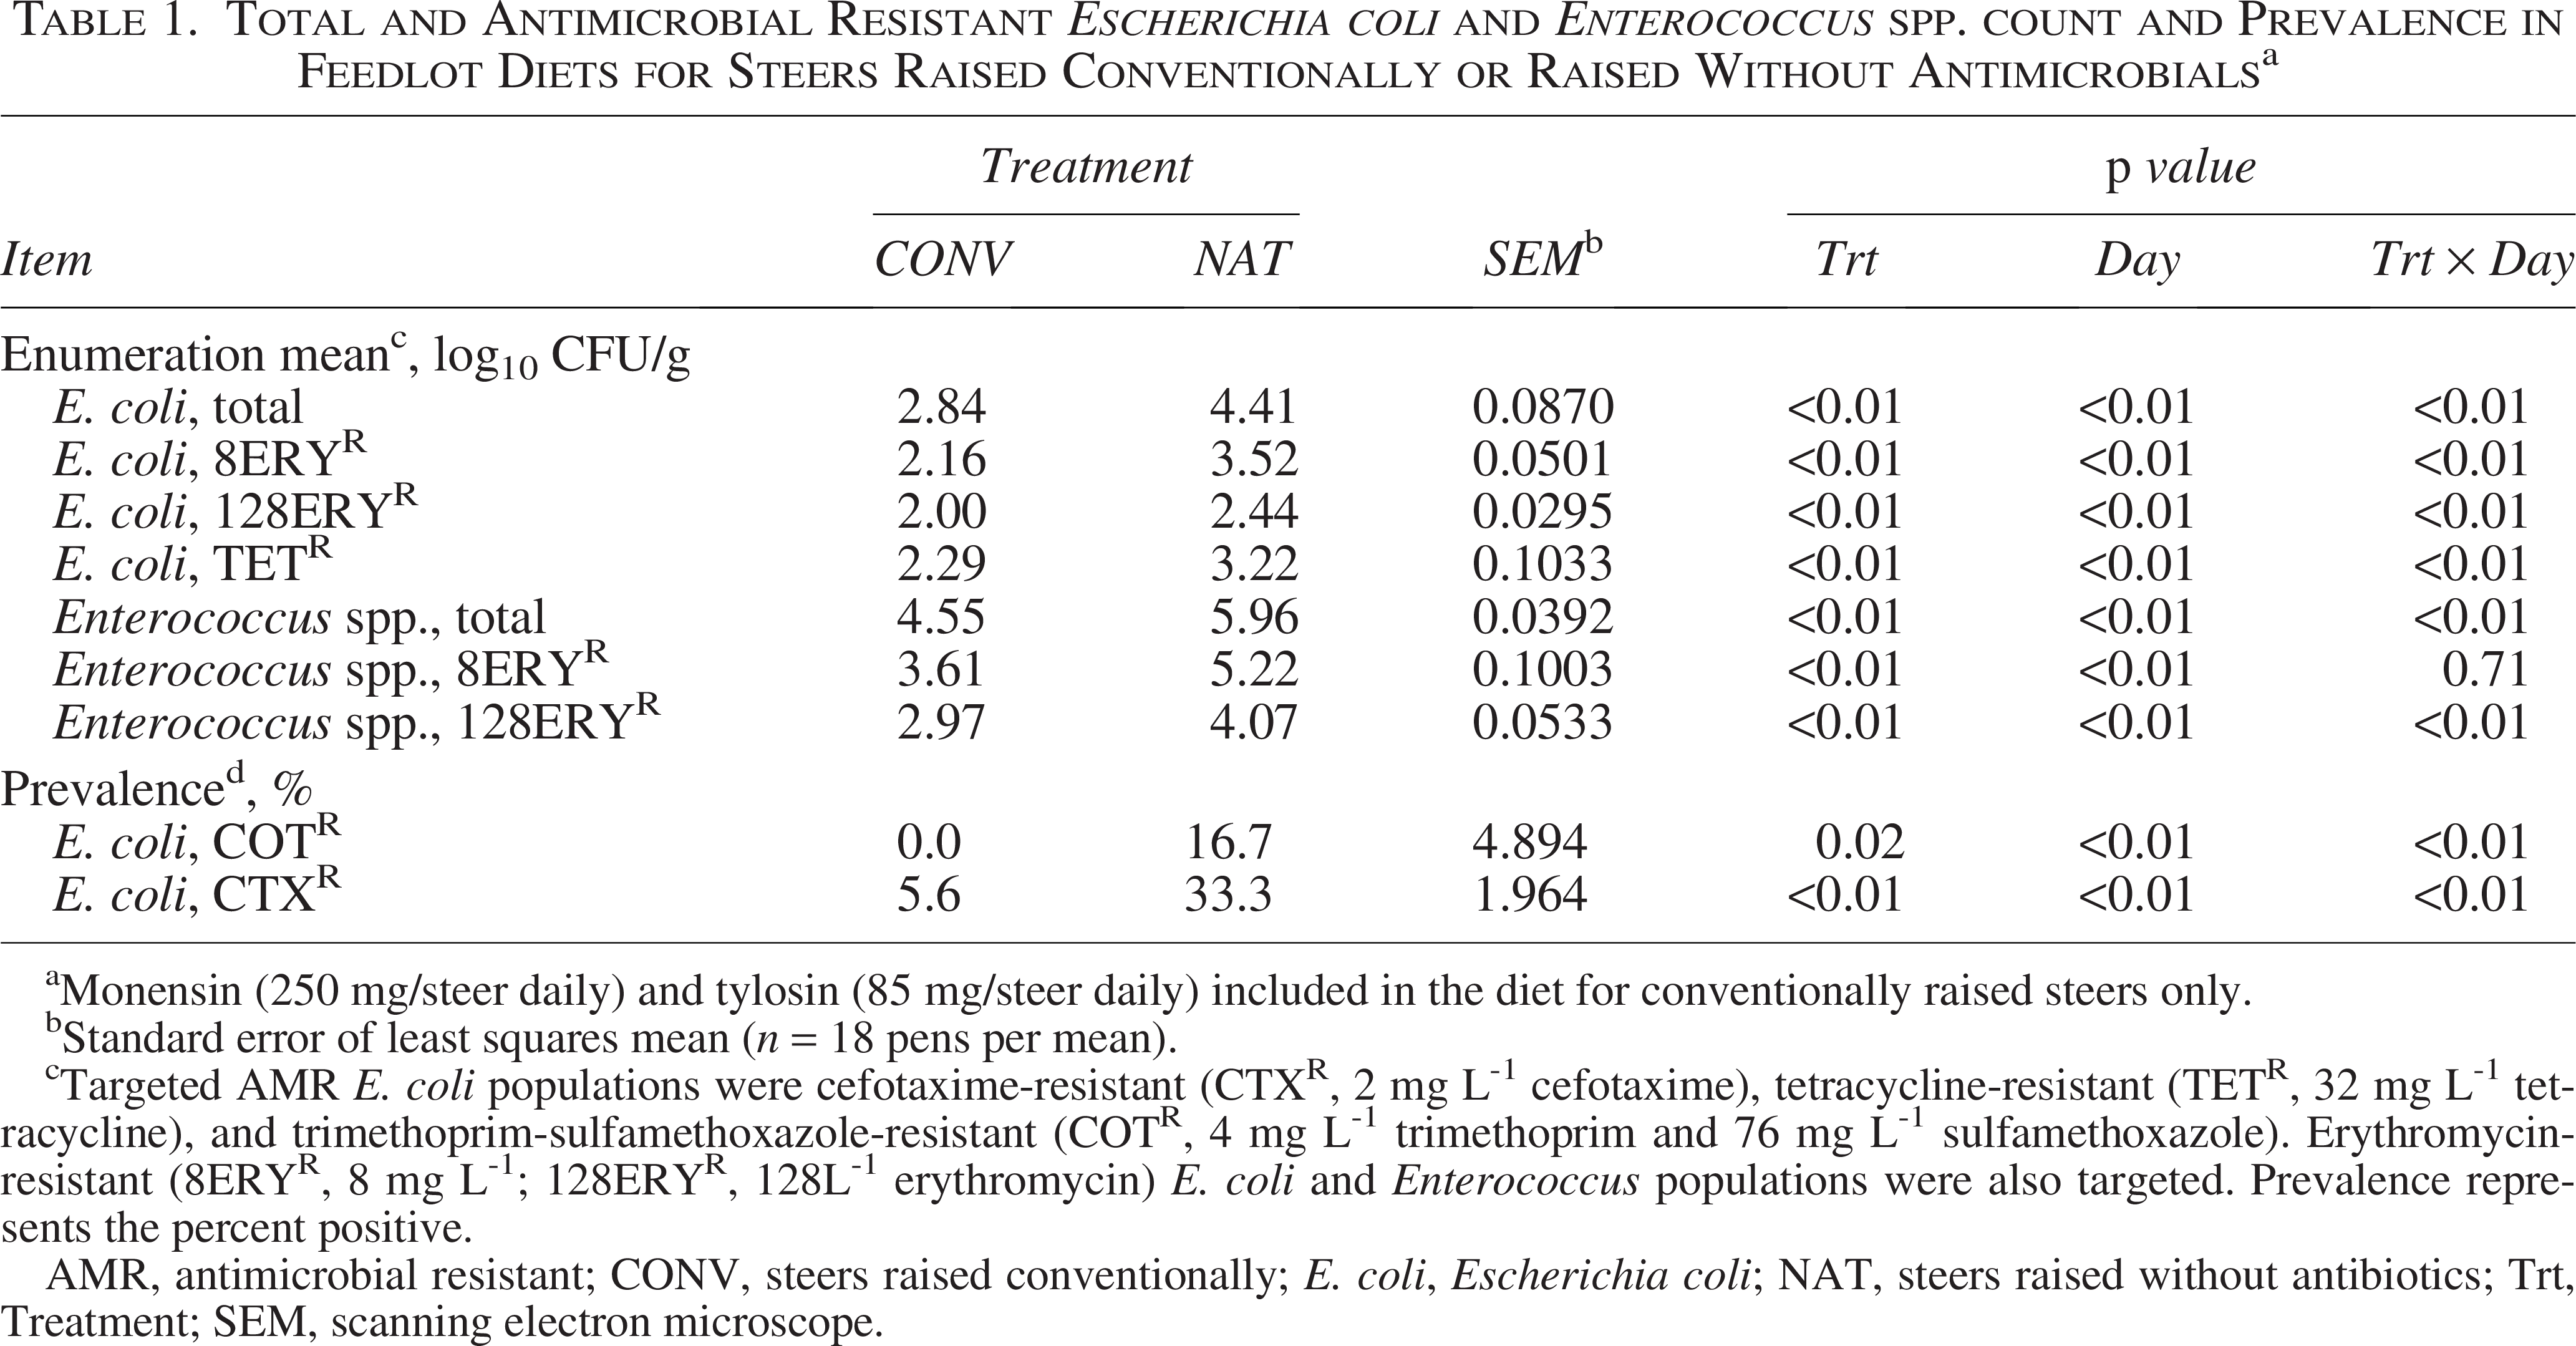
Monensin (250 mg/steer daily) and tylosin (85 mg/steer daily) included in the diet for conventionally raised steers only.
Standard error of least squares mean (n = 18 pens per mean).
Targeted AMR E. coli populations were cefotaxime-resistant (CTXR, 2 mg L-1 cefotaxime), tetracycline-resistant (TETR, 32 mg L-1 tetracycline), and trimethoprim-sulfamethoxazole-resistant (COTR, 4 mg L-1 trimethoprim and 76 mg L-1 sulfamethoxazole). Erythromycin-resistant (8ERYR, 8 mg L-1; 128ERYR, 128L-1 erythromycin) E. coli and Enterococcus populations were also targeted. Prevalence represents the percent positive.
AMR, antimicrobial resistant; CONV, steers raised conventionally; E. coli, Escherichia coli; NAT, steers raised without antibiotics; Trt, Treatment; SEM, scanning electron microscope.
Total and AMR E. coli and Enterococcus spp. concentration and prevalence in feces
No treatment × day interaction was observed for mean total E. coli concentrations (p = 0.90); however, there was a tendency for total E. coli concentrations to be greater in NAT steers than CON steers (p = 0.07; Fig. 1a). Day affected total E. coli concentration (p < 0.01), with concentrations being least on d 0 and greatest on d 168 (p < 0.01). For 8ERYR E. coli concentration, a treatment × day tendency was detected (p = 0.06; Fig. 1b), with NAT steers showing a tendency of greater 8ERYR E. coli concentrations on d 64 and 130 than CONV steers. Conversely, CONV steers had greater 128ERYR E. coli concentrations on d 130 and 168 than NAT steers (p < 0.01; Fig. 1c).

For TETR E. coli concentrations, no treatment × day interaction was detected (p = 0.20; Fig. 2), although CONV steers had greater TETR E. coli concentrations than NAT steers (p = 0.03). A day effect was detected (p < 0.01), with TETR E. coli concentrations being greater on d 168 than d 0 despite a decrease from d 64 to 123. Prevalence of COTR E. coli had a treatment × day interaction, with CONV steers having a greater prevalence on d 0 than NAT steers (p < 0.01; Fig. 3a). Conversely, NAT steers displayed greater COTR E. coli prevalence on d 123 and 130 (p < 0.01), although no difference was observed by d 168 (p = 0.99). A treatment × day interaction was detected for CTXR E. coli prevalence (p < 0.01; Fig. 3b). While CONV steers had a greater CTXR E. coli prevalence on d 0 than NAT steers (p < 0.01), NAT steers had greater CTXR E. coli prevalence on d 130 and 168 (p < 0.01). Overall, COTR and CTXR E. coli prevalence decreased from d 0 to 123 before increasing from d 123 to 168 (p < 0.01).
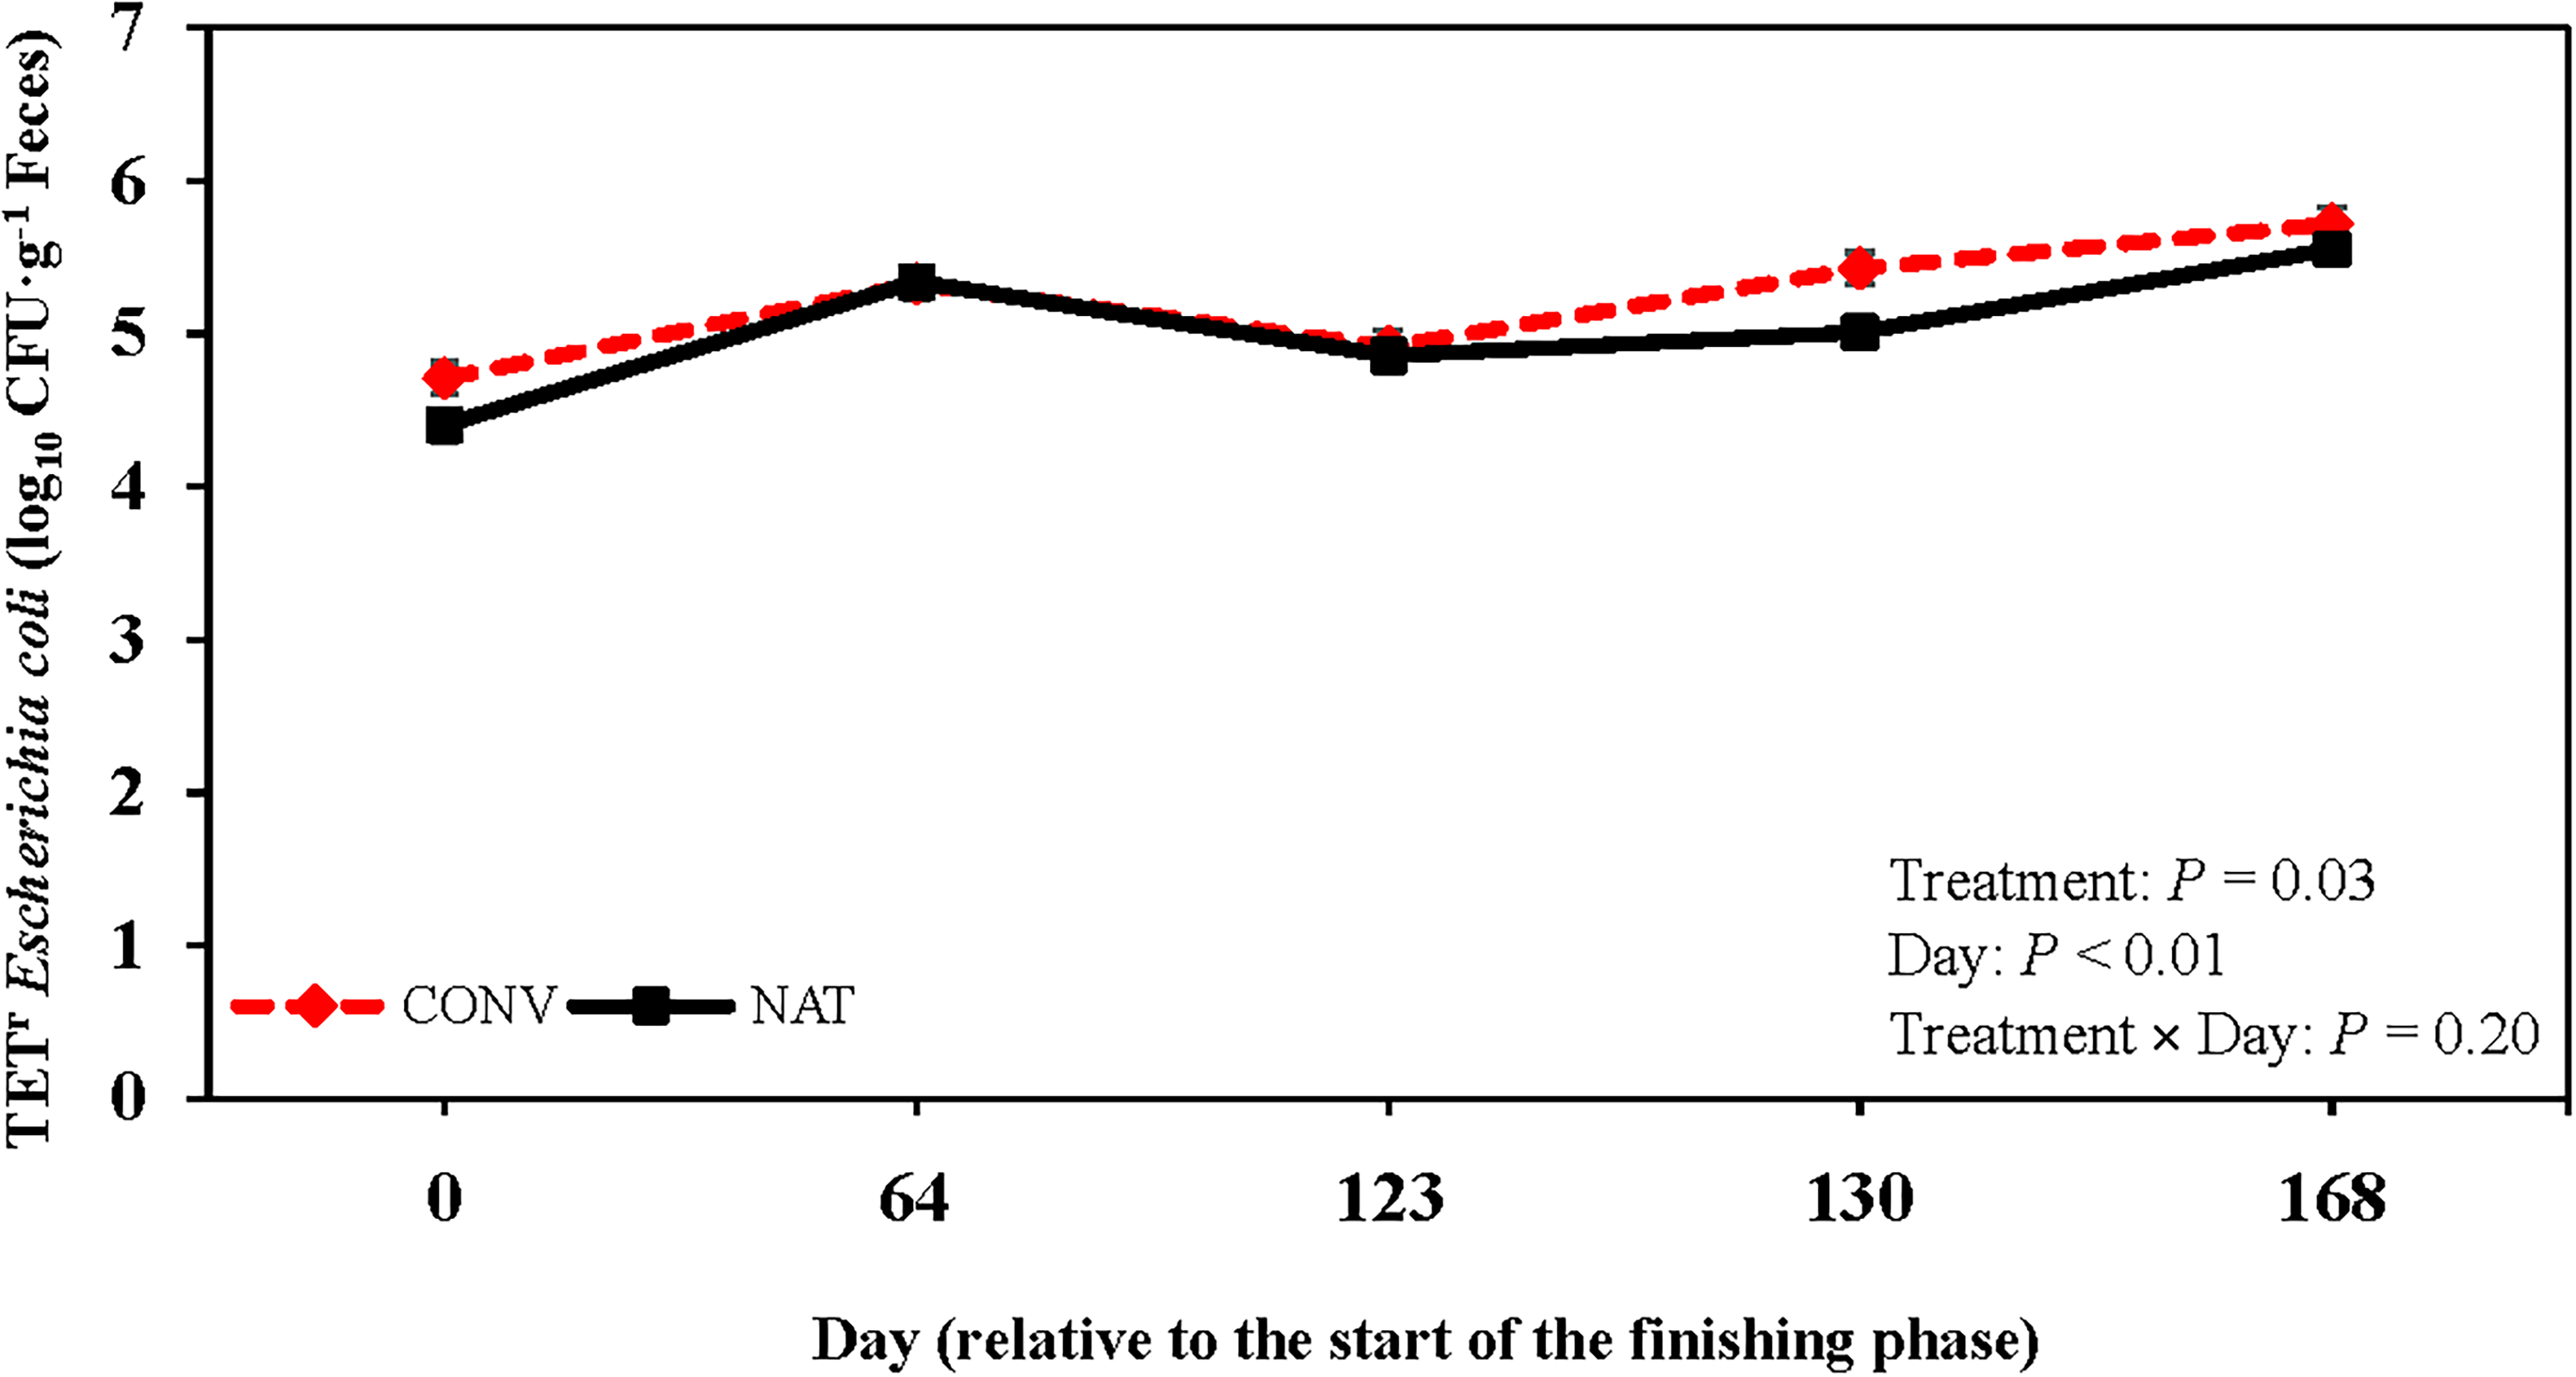
Log10 colony-forming unit (CFU) counts·g−1 feces of tetracycline resistant (TETR, 32 mg·L−1 tetracycline) Escherichia coli in fecal samples collected from cattle raised conventionally with commercial antimicrobials (CONV; dashed red line) and cattle raised without antimicrobials (NAT; solid black line). Injectable antimicrobial administration to conventionally raised cattle occurred on d 123. Error bars represent standard error of the mean.

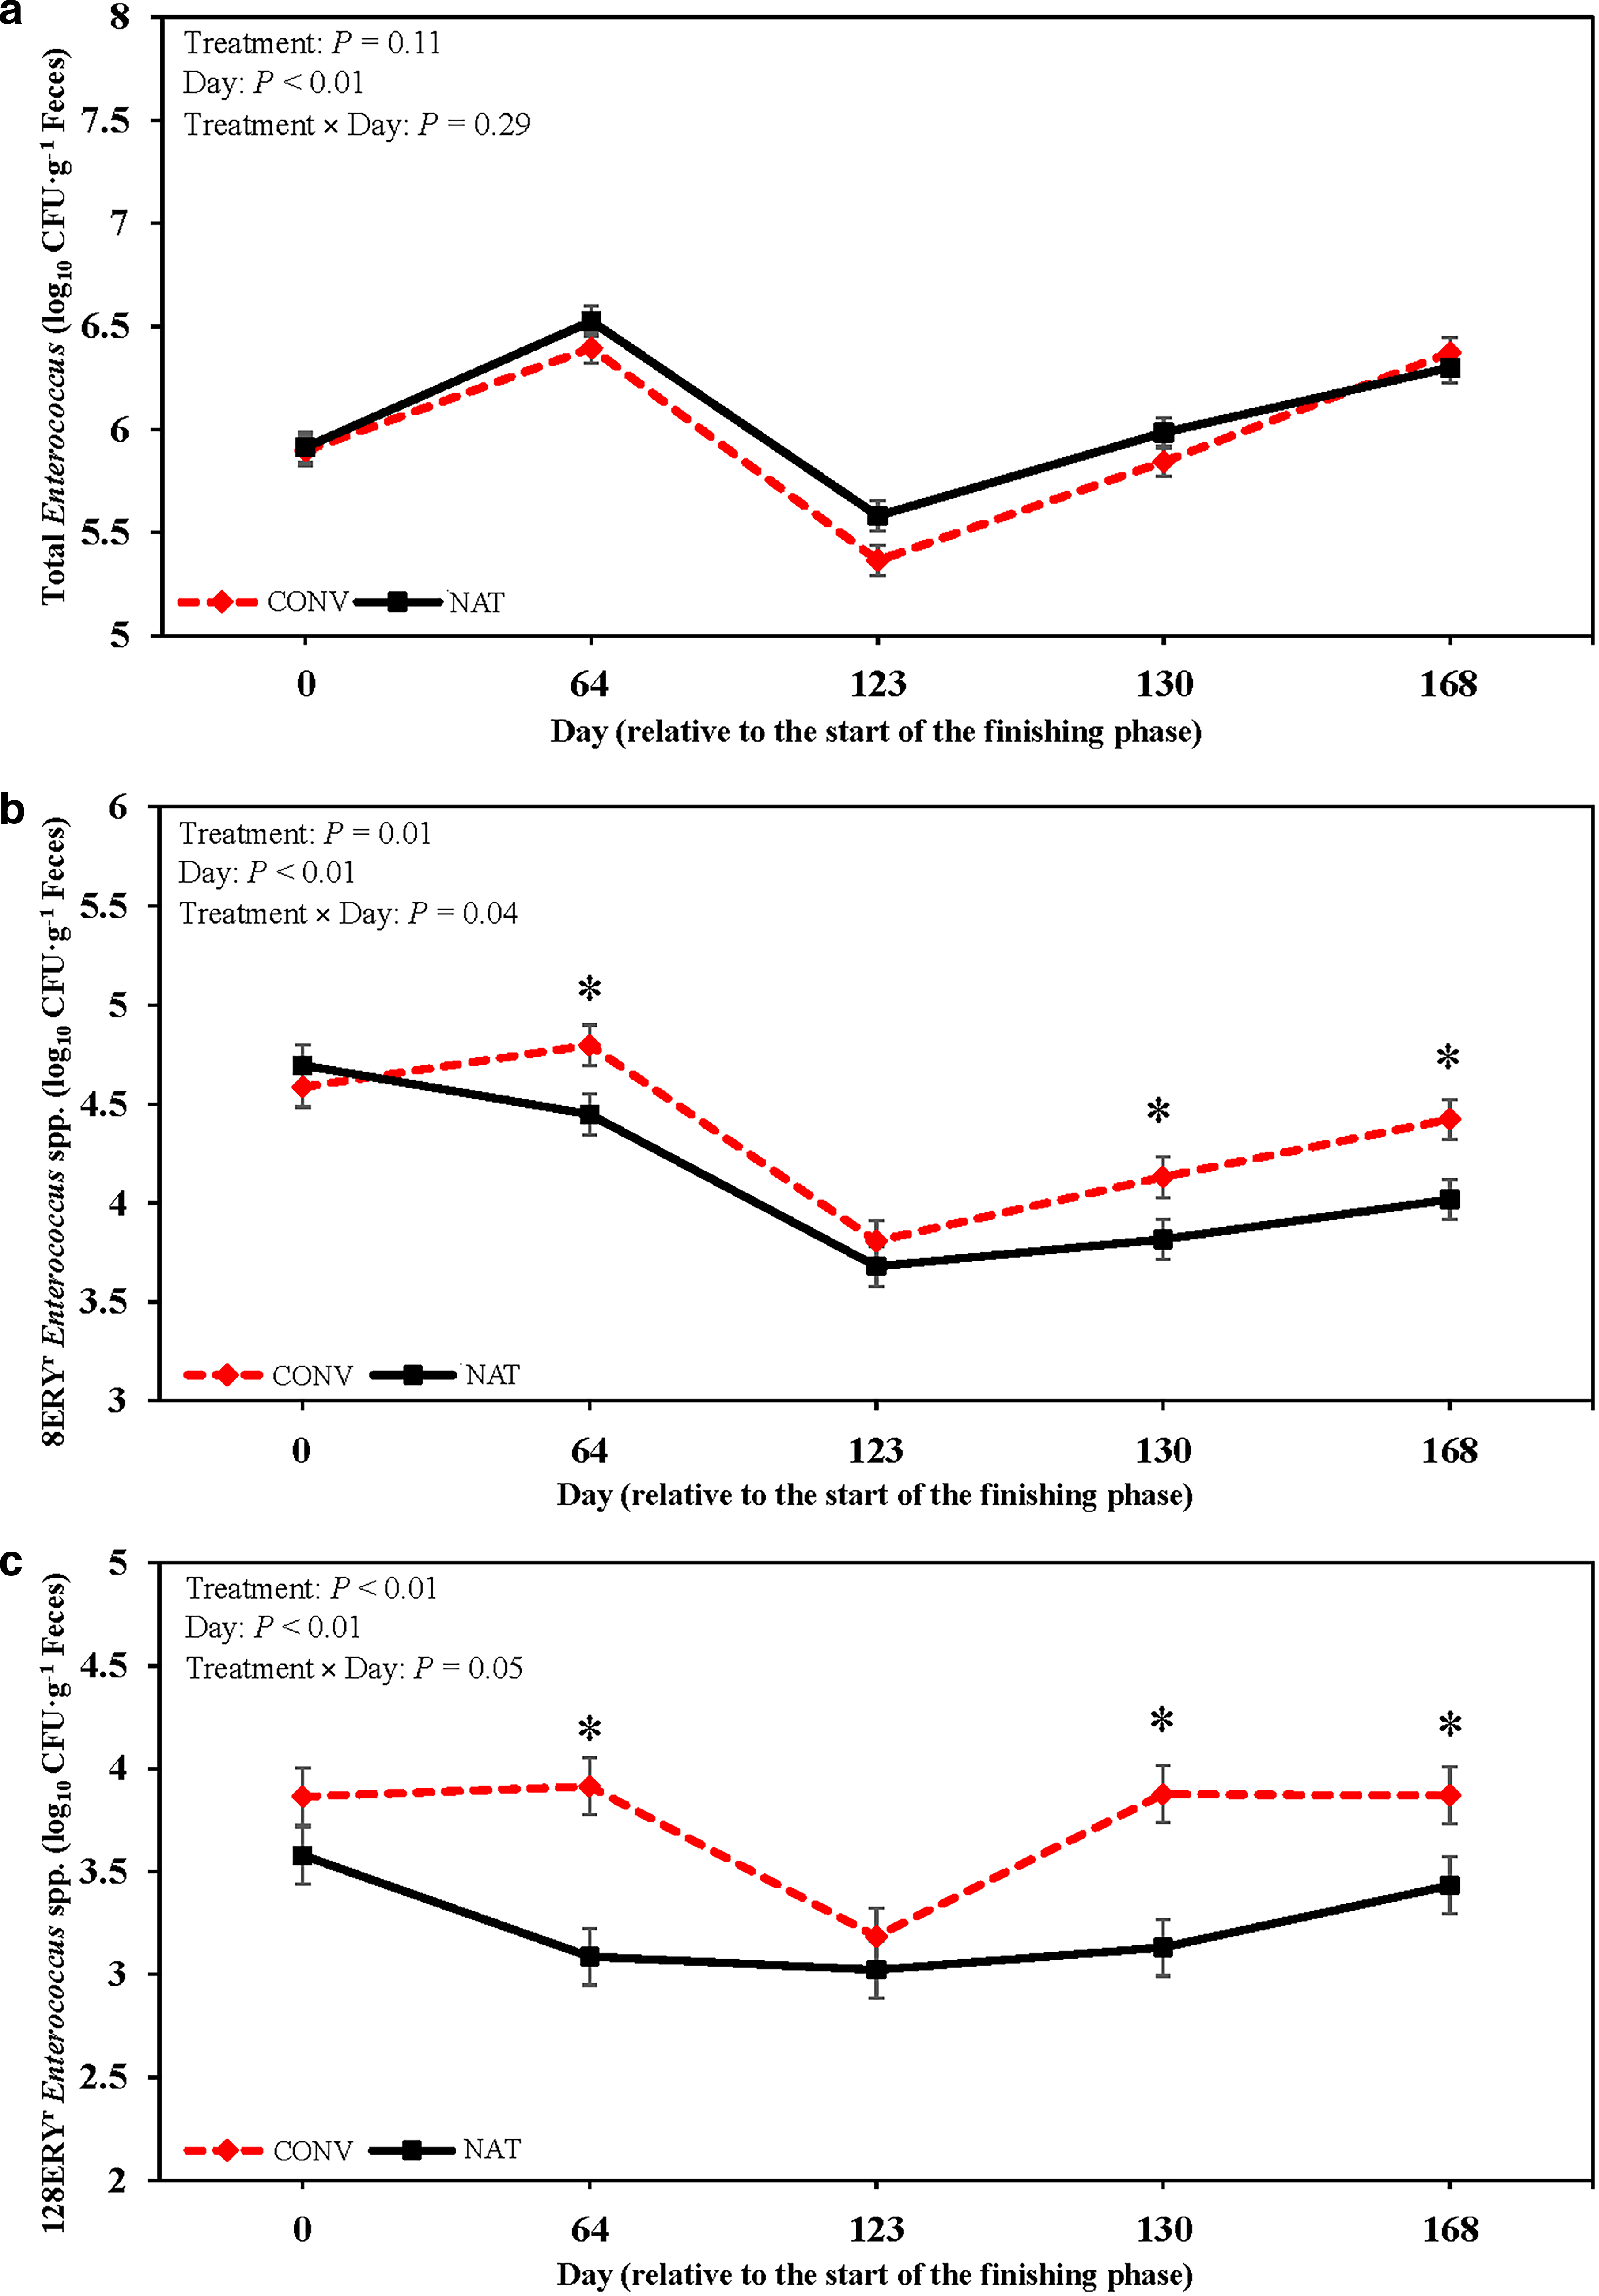
Mean total Enterococcus concentrations did not display a treatment (p = 0.11; Fig. 4a) or treatment × day interaction (p = 0.29). Total Enterococcus concentrations were greatest on d 64 and 168 and least on d 123 (p < 0.01). A treatment × day interaction was detected for 8ERYR Enterococcus concentrations (p = 0.04; Fig. 4b), in which CONV steers had greater 8ERYR Enterococcus concentrations on d 64, 123, and 168 than NAT steers. Similarly, CONV steers had greater 128ERYR Enterococcus concentrations on d 64, 130, and 168 than NAT steers (p = 0.05; Fig. 4c).
Discussion
Dietary Escherichia coli and Enterococcus spp
Enteric bacterial contamination of dietary ingredients is ubiquitous across U.S. feedlots (Dargatz et al., 2005) and dairies (Lynn et al., 1998). Potential contamination vectors include onsite birds, rodents, and insects (Gwenzi et al., 2021), feed deliveries from off-site facilities (Ge et al., 2013), and manure application on forage and row crops (Hancock et al., 1997). In the current study, generic and AMR E. coli and Enterococcus spp. were present in diets delivered to steers on each treatment, but birds, rodents, and insects were not evaluated for AMR. The concentrations of E. coli and Enterococcus spp. were greater in the NAT diet devoid of monensin or tylosin than the CONV diet. Beef cattle in feedlots are commonly fed monensin for coccidiosis prevention and tylosin for the mitigation of liver abscess prevalence (Nagaraja and Chengappa, 1998; Stock et al., 1995). The ionophore monensin currently has no medicinal application in humans, and is not considered medically important (WHO, 2019). Conversely, tylosin is a macrolide classified as critically important and of highest priority because of the importance of macrolides in human medicine. Even though 70% of cattle in feedlots receive dietary tylosin (Apley et al., 2023; USDA, 2013), judicious regulation outlined in the VFD minimizes the potential for AMR development.
Monensin and tylosin in diets can alter ruminal microbial populations, potentially giving Gram-negative bacteria a competitive advantage (Callaway et al., 2009). Pure cultures of Gram-positive bacteria were completely inhibited when monensin was supplemented to growth medium but Gram-negative bacteria were not inhibited (Petzel and Hartman, 1985). Literature regarding antimicrobial exposure and development of erythromycin resistance in E. coli is limited. Although E. coli possesses a 50S ribosomal subunit which is the target of macrolides, the polar outer membrane of Gram-negative bacteria confers an intrinsic resistance against hydrophobic compounds like macrolides (Leclercq and Courvalin, 1991). Unexpectedly, in the current study, diets containing antimicrobials had less generic E. coli concentrations. Studies regarding the impact of these antimicrobials on generic E. coli populations are limited. McAllister et al. (2006) reported a 2 log10 reduction in E. coli O157:H7 in the ruminal fluid of cows consuming forage with monensin and tylosin; however, a decrease was not observed when cows were consuming grain. Furthermore, high concentrations of monensin were found to be inhibitory to some E. coli O157:H7 strains, in vitro (Bach et al., 2002). Likewise, in experimentally infected swine, dietary tylosin was reported to decrease the fecal shedding duration for E. coli O157:H7. Petzel and Hartman (1985) reported that when the E. coli cultures were stressed, monensin was shown to be inhibitory to bacterial growth. Agga and Galloway (2023) did not report an increase in generic, TETR, or CTXR E. coli concentrations in the feces of calves that received in-feed tylosin. Vikram et al. (2017) suggested in-feed tylosin could plausibly increase macrolide, lincosamide, and streptogramin resistance despite it not being directly measured in the current or aforementioned study. The recovery of lower concentrations for total and AMR E. coli concentrations from the CONV diet samples was likely a result of the E. coli in the feed being static and stressed, increasing susceptibility to monensin and/or tylosin.
The commensal Gram-positive bacterium, Enterococcus is commonly measured to assess AMR risk because of its presence in human and animal gastrointestinal tracts (Beukers et al., 2015; USDA, 2017). Generally, cultured in greater concentrations from diets than E. coli, Enterococcus is better suited to survive in adverse conditions (Ge et al., 2013; Kühn et al., 2003), in agreement with the current study. Enterococcus is susceptible to monensin, which renders the single lipid bilayer ineffective at balancing monovalent cation diffusion (Simjee et al., 2012). Likewise, tylosin binds to the 50S ribosome, inhibiting protein synthesis (Taubman et al., 1966). Therefore, a decrease in the recovery of total and AMR Enterococcus spp. in CONV diet samples was expected in the current study.
Fecal Escherichia coli
Total fecal E. coli concentrations tended to be greater in NAT than CONV. In contrast, Vikram et al. (2017) reported no differences between feedlot cattle raised with or without antimicrobials. Generic E. coli concentrations were 43.3% greater in NAT diets than CONV diets and likely contributed to the differences in fecal E. coli concentrations. From d 0 to 168, total E. coli concentrations increased 12.5% between treatments, with diet adaptation and season likely contributing to this observation. The greatest increase in total E. coli concentrations (8.3%) occurred from d 0 to 64, corresponding to late November and early February. It is unlikely seasonality can solely explain this increase. The 4.2% increase from d 123 to 168 can likely be attributed to increased ambient temperature changes that occurred from April to May each year. This agrees with previous literature regarding the effects of increased ambient temperatures on fecal E. coli shedding (Berry and Wells, 2010; Long et al., 2022). Nonetheless, the effects of seasonality on AMR shedding warrants further investigation.
It is likely that because total generic E. coli was greater in the diet fed to NAT than CONV steers, this partially explains the greater fecal E. coli concentrations. The influence of in-feed antimicrobials such as monensin and tylosin on generic E. coli concentrations was unexpected and other studies report similar findings. Although the feed ingredients used to make the diets were the same between NAT and CONV steers, less generic E. coli was detected when monensin and tylosin were included in the mixed diet (CONV treatment). It is unknown whether monensin and tylosin are directly exerting an inhibitory effect on the generic E. coli or if our ability to detect generic E. coli are decreased. Additionally, previous work has reported that when the E. coli cultures were stressed, monensin was shown to be inhibitory to bacterial growth (Petzel and Hartman, 1985). Indeed, whatever the cause, these data indicate that diet is a source of AMR and diet should be monitored closely in future studies.
Although the steers in the current experiment were housed in the same facility separated by 5 empty pens, it is unlikely that AMR was shared between NAT and CONV steers. Soil and concrete sponge samples were collected before cattle entered the facility (data not presented). Enumerable AMR target bacteria were not isolated from any pens or concrete before the start of the experiment each year. Likewise, it is unlikely that AMR was carried on dust particles throughout the experiment. The facility was covered on the North side with pens open to the South. Generally, from October through May the wind direction in Southcentral Nebraska is from the North.
E. coli is naturally resistant to lesser erythromycin concentrations (<64 mg L−1). In the current study, 8ERYR E. coli tended to be greater in NAT steers on d 64 and greater for CONV steers on d 130. Nonetheless, each treatment displayed a similar trend over time, with 8ERYR E. coli concentrations decreasing from d 0 to 123 before a slight increase to the end of finishing. Greater fitness costs associated with AMR genes coupled with unfavorable environmental conditions from d 0 to 123 could explain the decreased 8ERYR E. coli concentrations until re-exposure to macrolides on d 123 (San Millan and MacLean, 2017). Similarly, no differences between treatments were observed for 128ERYR E. coli concentrations from d 0 to 123. One week after CONV steers received an antimicrobial injection, 128ERYR E. coli concentrations increased 26.3%, and remained elevated above NAT steer concentrations through d 168. An attenuated and delayed increase was observed in NAT steers from d 130 to 168. Long et al. (2022) reported an increase in fecal 128ERYR E. coli concentrations 28 d after ceftiofur and florfenicol administration, both of which were used in the current study. These responses in 128ERYR E. coli populations may have arisen from development of co-resistance development, which occurs via horizontal gene transfer (Cantón and Ruiz-Garbajosa, 2011).
E. coli resistance to tetracyclines is ubiquitous in the environment and has been reported in cattle that have not been exposed to antimicrobials (Alexander et al., 2009; Mirzaagha et al., 2011). Although TETR E. coli concentrations were greater in CONV steers than NAT steers, this difference is likely a consequence of antimicrobial administration rather than monensin and tylosin inclusion in diets (Schmidt et al., 2020). Concentrations of TETR E. coli were greater on d 130 for CONV steers following AMD administration. By d 168, TETR E. coli concentrations did not differ between treatments. Transient effects of antimicrobial exposure have previously been reported (Agga et al., 2016). Additionally, multiple studies reported no difference in TETR E. coli concentrations 28 d after metaphylactic exposure (Long et al., 2022; Vikram et al., 2017). Similar to generic E. coli concentrations, seasonal variation contributed to the 23.7% increase in TETR E. coli concentrations from d 0 to 168 between treatments. Vikram et al. (2017) previously noted a strong correlation between generic and TETR E. coli concentration variations across seasons.
In the current study, COTR E. coli prevalence was greater in CONV steers on d 0 but was not present again until d 168. Conversely, COTR E. coli prevalence was greater in NAT steers on d 123 and 130. By d 168, COTR E. coli prevalence was 100% across treatments. Similar prevalences before harvest have been reported by Schmidt et al. (2015) and Long et al. (2022) at 95.1% and 100%, respectively. Although CONV steers did not receive an injectable sulfonamide on d 123, previous studies have noted an increase in COTR E. coli prevalence after florfenicol administration (Jensen et al., 2018; Long et al., 2022). Moreover, CONV steers that received therapeutic florfenicol before d 0 might explain the increased COTR E. coli prevalence observed on d 0. The subsequent decrease in COTR E. coli prevalence until re-exposure to florfenicol suggests that while plasmids allow bacteria to survive in the presence of AMD, they impose fitness costs when the host bacteria in the absence of AMD (San Millan and MacLean, 2017). Additionally epistatic interactions between the host bacteria and plasmid are critical for success of the plasmid-bacteria association but can hinder the ability to predict AMR evolution (Wong, 2017). As florfenicol and trimethoprim-sulfamethoxazole have differing modes of action, further research is needed to understand these results and the potential for co-resistance development.
Through β-lactamase genes, resistance against third generation cephalosporins can be conferred by E. coli (Tadesse et al., 2018). Dietary contamination and injectable antimicrobial administration are probable factors for the CTXR E. coli observations in the current study. The presence of CTXR E. coli in feed provided to the NAT steers might explain the increase in CTXR E. coli prevalence from d 123 to 130. Conversely for CONV steers, CTXR E. coli was greater on d 0 and increased following ceftiofur administration in the current study. Like the increased COTR E. coli prevalence observed on d 0, therapeutic cephalosporin use can explain the increased CTXR E. coli in CONV steers. Ceftiofur injection has been reported to increase (Long et al., 2022; Schmidt et al., 2013) or have no effect (Agga et al., 2016) on CTXR E. coli prevalence. A sustained increase in CTXR E. coli prevalence was noted in CONV steers following ceftiofur injections, suggesting antimicrobial exposure increases resistance prevalence.
Fecal Enterococcus spp
Generic Enterococcus spp. concentrations were not altered by antimicrobial exposure in the current study. This observation differs from Vikram et al. (2017) and Long et al. (2022), in which decreased concentrations of generic Enterococcus spp. were reported following dietary antimicrobial exposure. Schmidt et al. (2020) reported a transient effect of tylosin on generic Enterococcus spp. concentrations, with antimicrobial exposure decreasing concentrations initially. By the end of the finishing period on d 168, concentrations did not differ between treatments.
Macrolide resistance in Enterococcus spp. isolated from animal origins is commonly conferred via the ermB gene (Jensen et al., 1999). This gene causes 23S rRNA methylation, therein rendering ribosomes intolerant to erythromycin (Roberts et al., 1999). Although erythromycin was not used in the current study, CONV steers received dietary tylosin. Numerous studies have observed an increase in erythromycin resistant Enterococcus spp. following tylosin exposure (Murray et al., 2022; Vikram et al., 2017). When tylosin is fed in conjunction with monensin, increased resistance to erythromycin has also been reported (Jacob et al., 2008). After feeding tylosin for 100 d, erythromycin-resistant Enterococcus spp. prevalence increases (Cazer et al., 2020).
Greater 8ERYR and 128ERYR Enterococcus spp. concentrations were observed in CONV steers by d 68 in the current study. Nevertheless, by d 123, 8ERYR and 128ERYR Enterococcus spp. concentrations did not differ between treatments. Following injectable antimicrobial administration on d 130 and 168, 8ERYR and 128ERYR Enterococcus spp. concentrations were greater in CONV steers than NAT steers. Tulathromycin, a semi-synthetic macrolide, was administered on d 123. Previous studies have reported that metaphylactic tulathromycin injection can increase erythromycin-resistant Enterococcus spp. prevalence (Lewy et al., 2022). Nevertheless, greater 8ERYR and 128ERYR Enterococcus spp. concentrations were not sustained in CONV steer feces throughout the feeding period as seen on d 123. Environmental conditions and season have been reported to alter AMR Enterococcus spp. prevalence (McAuley et al., 2015; Long et al., 2022; Sinton et al., 2007). Generic, 8ERYR, and 128ERYR Enterococcus spp. concentrations decreased in both treatments from d 0 to 123 with subsequent increase from d 123 to 168 with warming temperatures.
Results from this study indicate that antimicrobial exposure does not inherently increase generic E. coli and Enterococcus spp. concentrations. Rather, inclusion of tylosin preferentially selected for ERYR Enterococcus spp. in feces. Increases in AMR E. coli and Enterococcus spp. concentrations in feces following injectable antimicrobial exposure demonstrate the greater potential for selection pressure to favor resistant populations among the targeted bacteria. Nonetheless, AMR Enterococcus spp. and E. coli were detected regardless of antimicrobial exposure. In the current study, our ability to detect AMR decreased in steers fed monensin and tylosin. Conversely, when subcutaneous antimicrobial injections were administered, large increases in AMR were observed. Therefore, injectable metaphylactic antimicrobial use has a greater impact on AMR shedding than dietary presence of monensin and tylosin within the same environment.
Authors’ Contributions
C.W.D.: Formal analysis (lead); writing—original draft (lead). J.E.W.: Project administration (equal); investigation (equal); methodology (equal); formal analysis (supporting); resources (equal); writing—review and editing (equal). E.D.B.: Project administration (equal); investigation (equal); methodology (equal); resources (equal); writing—review and editing (equal). S.C.F.: Funding acquisition (lead); writing—review and editing (equal). P.R.B.: Writing—review and editing (equal). K.E.H.: Project administration (equal); investigation (equal); funding acquisition (supporting); methodology (equal); resources (equal); formal analysis (supporting); resources (equal); writing—review and editing (equal).
Footnotes
Acknowledgment
The authors would like to thank the employees at the USDA-MARC research feedlot personnel for their support and guidance, and Dee Kucera and Shannon Ostdiek for their technical support during this project.
Author Disclosure Statement
The authors declare no conflict of interest.
Funding Information
This work was supported by USDA-MARC and the United States Department of Agriculture–National Institute of Food and Agriculture, Effective Mitigation Strategies for Antimicrobial Resistance grant no. 2018–68003-27545 and 2023–68015–40015.
Data Availability Statement
Data available upon request.
Disclaimer
Any opinions, findings, conclusions, or recommendations expressed in this presentation are those of the authors and do not necessarily reflect the view of the USDA. Mention of a trade name, proprietary product, or specific equipment in this study is solely for the purpose of providing information and does not imply guarantee or warranty by the USDA nor does it imply approval to the exclusion of other products that may be suitable. The USDA is an equal opportunity provider and employer