




Abstract
Objective:
The human–computer interface is pivotal in advancing products like virtual reality (VR) games tailored for upper limb rehabilitation.
Materials and Methods:
A comparative study was conducted with 60 male participants, all young construction workers aged 20 to 30, who were selected from two rehabilitation centers, specifically targeting individuals with comparable upper limb dysfunctions resultant from occupational injuries, as assessed by qualified physiotherapists. The study evaluated various image presentation methodologies, two types of head-mounted displays (HMDs), tethered to a PC and a stand-alone, and a TV. Participants engaged in a series of five distinct rehabilitation games, executing a standardized sequence of movements over a 30-minute duration.
Results:
Findings revealed a significant correlation between the chosen interface and factors such as technology acceptance, usability, user experience, spatial presence, and perceived stress during the training sessions. To compare display methods Mann–Whitney U tests were performed. The HMD configurations generally outperformed the TV option. The stand-alone HMD particularly demonstrated superior outcomes in comparison to both, TV and HMD tethered to PC, with increases observed in intent to use (52% and 16%), overall performance (41% and 15%), and perceived usefulness (20% and 16%). The usability assessment conducted by physiotherapists yielded an average score of 74.5, indicating a consensus on the practicality and effectiveness of the system.
Conclusion:
The high usability of HMD aligns with previous studies. New findings concern an in-depth comparative analysis of interfaces across multiple dimensions. Future research should explore the evaluation of interfaces after long-term use and factors influencing therapy effectiveness and upper limb functionality.
Introduction
The growing interest in supporting the process of physiotherapy using games, including virtual reality (VR) games, means that the number of publications on this topic is also growing, also because various types of hardware can be used in VR-based exercise therapy. 1 Support for human functioning and the rehabilitation process using games focuses on several issues like upper limb physiotherapy,2–5 rehabilitation after stroke,6,7 improve recovery after surgery, 8 improvements in balance, 9 visuomotor reaction time, 10 and cognitive rehabilitation.11–13 Some works focused on the use of rehabilitation games for children11,14,15 and seniors.16–18
The review of 21 experimental studies that reported an assessment or intervention (for patients with a range of disorders, including stroke, multiple sclerosis, spinal cord injury, and Parkinson’s disease) using a head-mounted display (HMD) shows that VR may be used as a therapeutic medium in physical rehabilitation because of their ability to immerse patients in safe, controlled, and engaging virtual worlds. 19
It is crucial to maintain interest and commitment during the rehabilitation process, which can often be quite lengthy. Research by Baluz 20 suggests that investigating the usability and likability of VR games can enhance engagement in the exercise process. Furthermore, Grabowski 21 emphasizes the significant impact of the computer interface on the usability and effectiveness of interactive systems, as assessed by users.
Crocetta 22 highlights the significance of the interface type in rehabilitation games. On one hand, using HMD in the interfaces of inspection robots improves operator productivity, spatial presence, distance evaluation, and task execution compared to flat screens. 23 On the other, some older studies 24 show that VR influences arm motor performance, however, flat screens are potentially more effective for upper limb rehabilitation compared to HMD. Thus, it seems that a more detailed study is needed to properly consider technological advancement in the field of VR. Moreover, Rand’s study in 2005 25 indicates that when selecting a suitable VR therapeutic application, it’s important to consider the attributes of the VR platform, as these factors seem to impact key outcome measures.
Materials and Methods
Research questions
It is essential to determine the most suitable interface for evaluating patients with upper limb dysfunction—whether it is an HMD or a television (TV). When considering HMDs, there are two distinct types: stand-alone HMDs with limited computing power (Quest) and HMDs connected to high-performance PCs (Rift S). The former is more cost-effective and portable, while the latter offers lower latency owing to the PC’s robust computing capabilities. Low latency is important because of the relatively high-speed movement of the upper limb. We examined the impact of each interface on presence perception, technology acceptance (particularly intent to use), load, and induced stress.
The research also aimed to explore the potential use of VR games in aiding the return to work after a work-related accident, because the built-in motion capture system simplifies the process of guiding desired motion trajectories for the upper limb. The games were designed to assist in rehabilitating mobility in joints and muscles affected by injury.
Participants
The research was conducted in two physiotherapy centers (“Kaśmin” and “MedCare”, both located in Mińsk Mazowiecki, Poland), with 30 patients in each of them. The number of participants (60) is larger than in a typical study on this subject, as indicated by a review by Wenk. 26 Studies with patients were carried out by physiotherapists trained in using VR hardware and games effectively. For each physiotherapy center, one day was devoted to training.
The inclusion criteria were the following: all participants were young male and active construction workers with secondary education with age below 30 years, (an average age of 23.9 ± 2.7, 25.0 ± 3.2, and 24.0 ± 3.6 for the TV, QUEST, and RIFT S groups, respectively), because accidents at work are more common among inexperienced employees. Patients with similar levels of upper limb dysfunction following work-related accidents, as assessed by physiotherapists, were included. The exclusion criteria: to eliminate the influence of prior VR experience, participants with VR experience were excluded from the study.
Ethical approval was obtained from the ethics committee at Warsaw University of Life Sciences, Poland, and all participants provided signed informed consent and a participant’s declaration form.
Between-subjects (between-groups) study design was used. In each physiotherapy center, participants were divided into three groups: 10 patients in each group, so that all groups related to the type of image presentation and representations from both centers were equal. The participants were randomly assigned to one of three study groups.
Measurements
The following research tools were used in the form of standard questionnaires to measure the level of:
Spatial presence and simulation realism (SPQ—Spatial Presence Questionaire).
27
It measures a user’s sense of “being there” in a mediated environment. It assesses the subjective experience of presence, focusing on how much a user feels located within and interacts with a virtual or mediated space, rather than the real world around them. Technology acceptance (TAM—Technology Acceptance Model).
28
TAM measures a person’s attitude towards using technology, their intention to use it, and their belief that this technology will enhance performance or help achieve specific goals. Load associated with rehabilitation games (NASA Task Load Index).
29
It assesses six dimensions: mental demand, physical demand, temporal demand, performance, effort, and frustration. Stress and anxiety (DSSQ—Dundee Stress State Questionnaire).
30
It measures subjective stress states experienced during a task. It assesses three main dimensions: task engagement (e.g., interest, focus), distress (e.g., anxiety, tension), and worry (e.g., concerns about performance). Usability (SUS—System Usability Scale).
31
SUS is a widely used, 10-item questionnaire that measures perceived usability. It provides a single overall score representing a user’s subjective assessment of a system’s ease of use and learnability. Symptoms of simulator sickness (SSQ—Kennedy’s Simulator Sickness Questionaire).
32
Experimental procedure
An experimental study utilizing a posttest-only design was conducted, in which participants were randomly allocated into three distinct groups. The primary objective of the research was to evaluate the efficacy of various image display methods in terms of user response and perception. The study involved the participation of the following three groups (Fig. 1):

Example of training game (Knight) with a TV-based interface (left) and training games (Library) with a VR-based interface (Oculus Rift S).
HMD Oculus Rift S connected to a PC, 20 patients (Rift S).
Stand-alone HMD (Oculus Quest), 20 patients (Quest).
TV (as a motion capture system Oculus Touch controllers were used), 20 patients (TV).
The participants underwent training on the VR equipment one day before the experimental session. During the experiment, participants engaged in the following tasks:
Completion of the SSQ for baseline assessment, Use of five distinct rehabilitation games: 30 minutes in total, without breaks. All participants followed a standardized sequence of movements, Execution of post-experiment surveys (all six questionnaires), which included a subsequent administration of the SSQ to evaluate any changes in simulator sickness symptoms experienced during the session.
The group sizes were not fixed in advance but were constrained by the availability of patients within a reasonable timeframe. Based on our prior experience with similar case studies involving VR, we have determined that this sample size is sufficiently robust for our analysis.
Rehabilitation games
Five games (Knight, Drummer, Pirate, Library, and Smith) were used. Each game required different upper limb movements. For example, in the Knight game, participants had to mimic the position of a translucent sword displayed on the screen within a limited time frame. The time allowed for completing each task was restricted to 5 seconds. The sequence of tasks guided the trajectory of the upper limb in three-dimensional space. However, certain games, such as Pirate, limited the range of movements to only pronation and supination for controlling the ship with a steering wheel.
Results
To evaluate and compare the outcomes across distinct groups, we conducted Mann–Whitney U tests.
Spatial presence
The lowest value of spatial presence (Fig. 2) was observed for the TV. The average value for HMD was 10% higher than for TV. The difference is statistically significant with P = 0.003 and P = 0.002 for Quest and Rift, respectively. The difference in SPQ between the different types of HMD is relatively small (1%) and is not statistically significant.
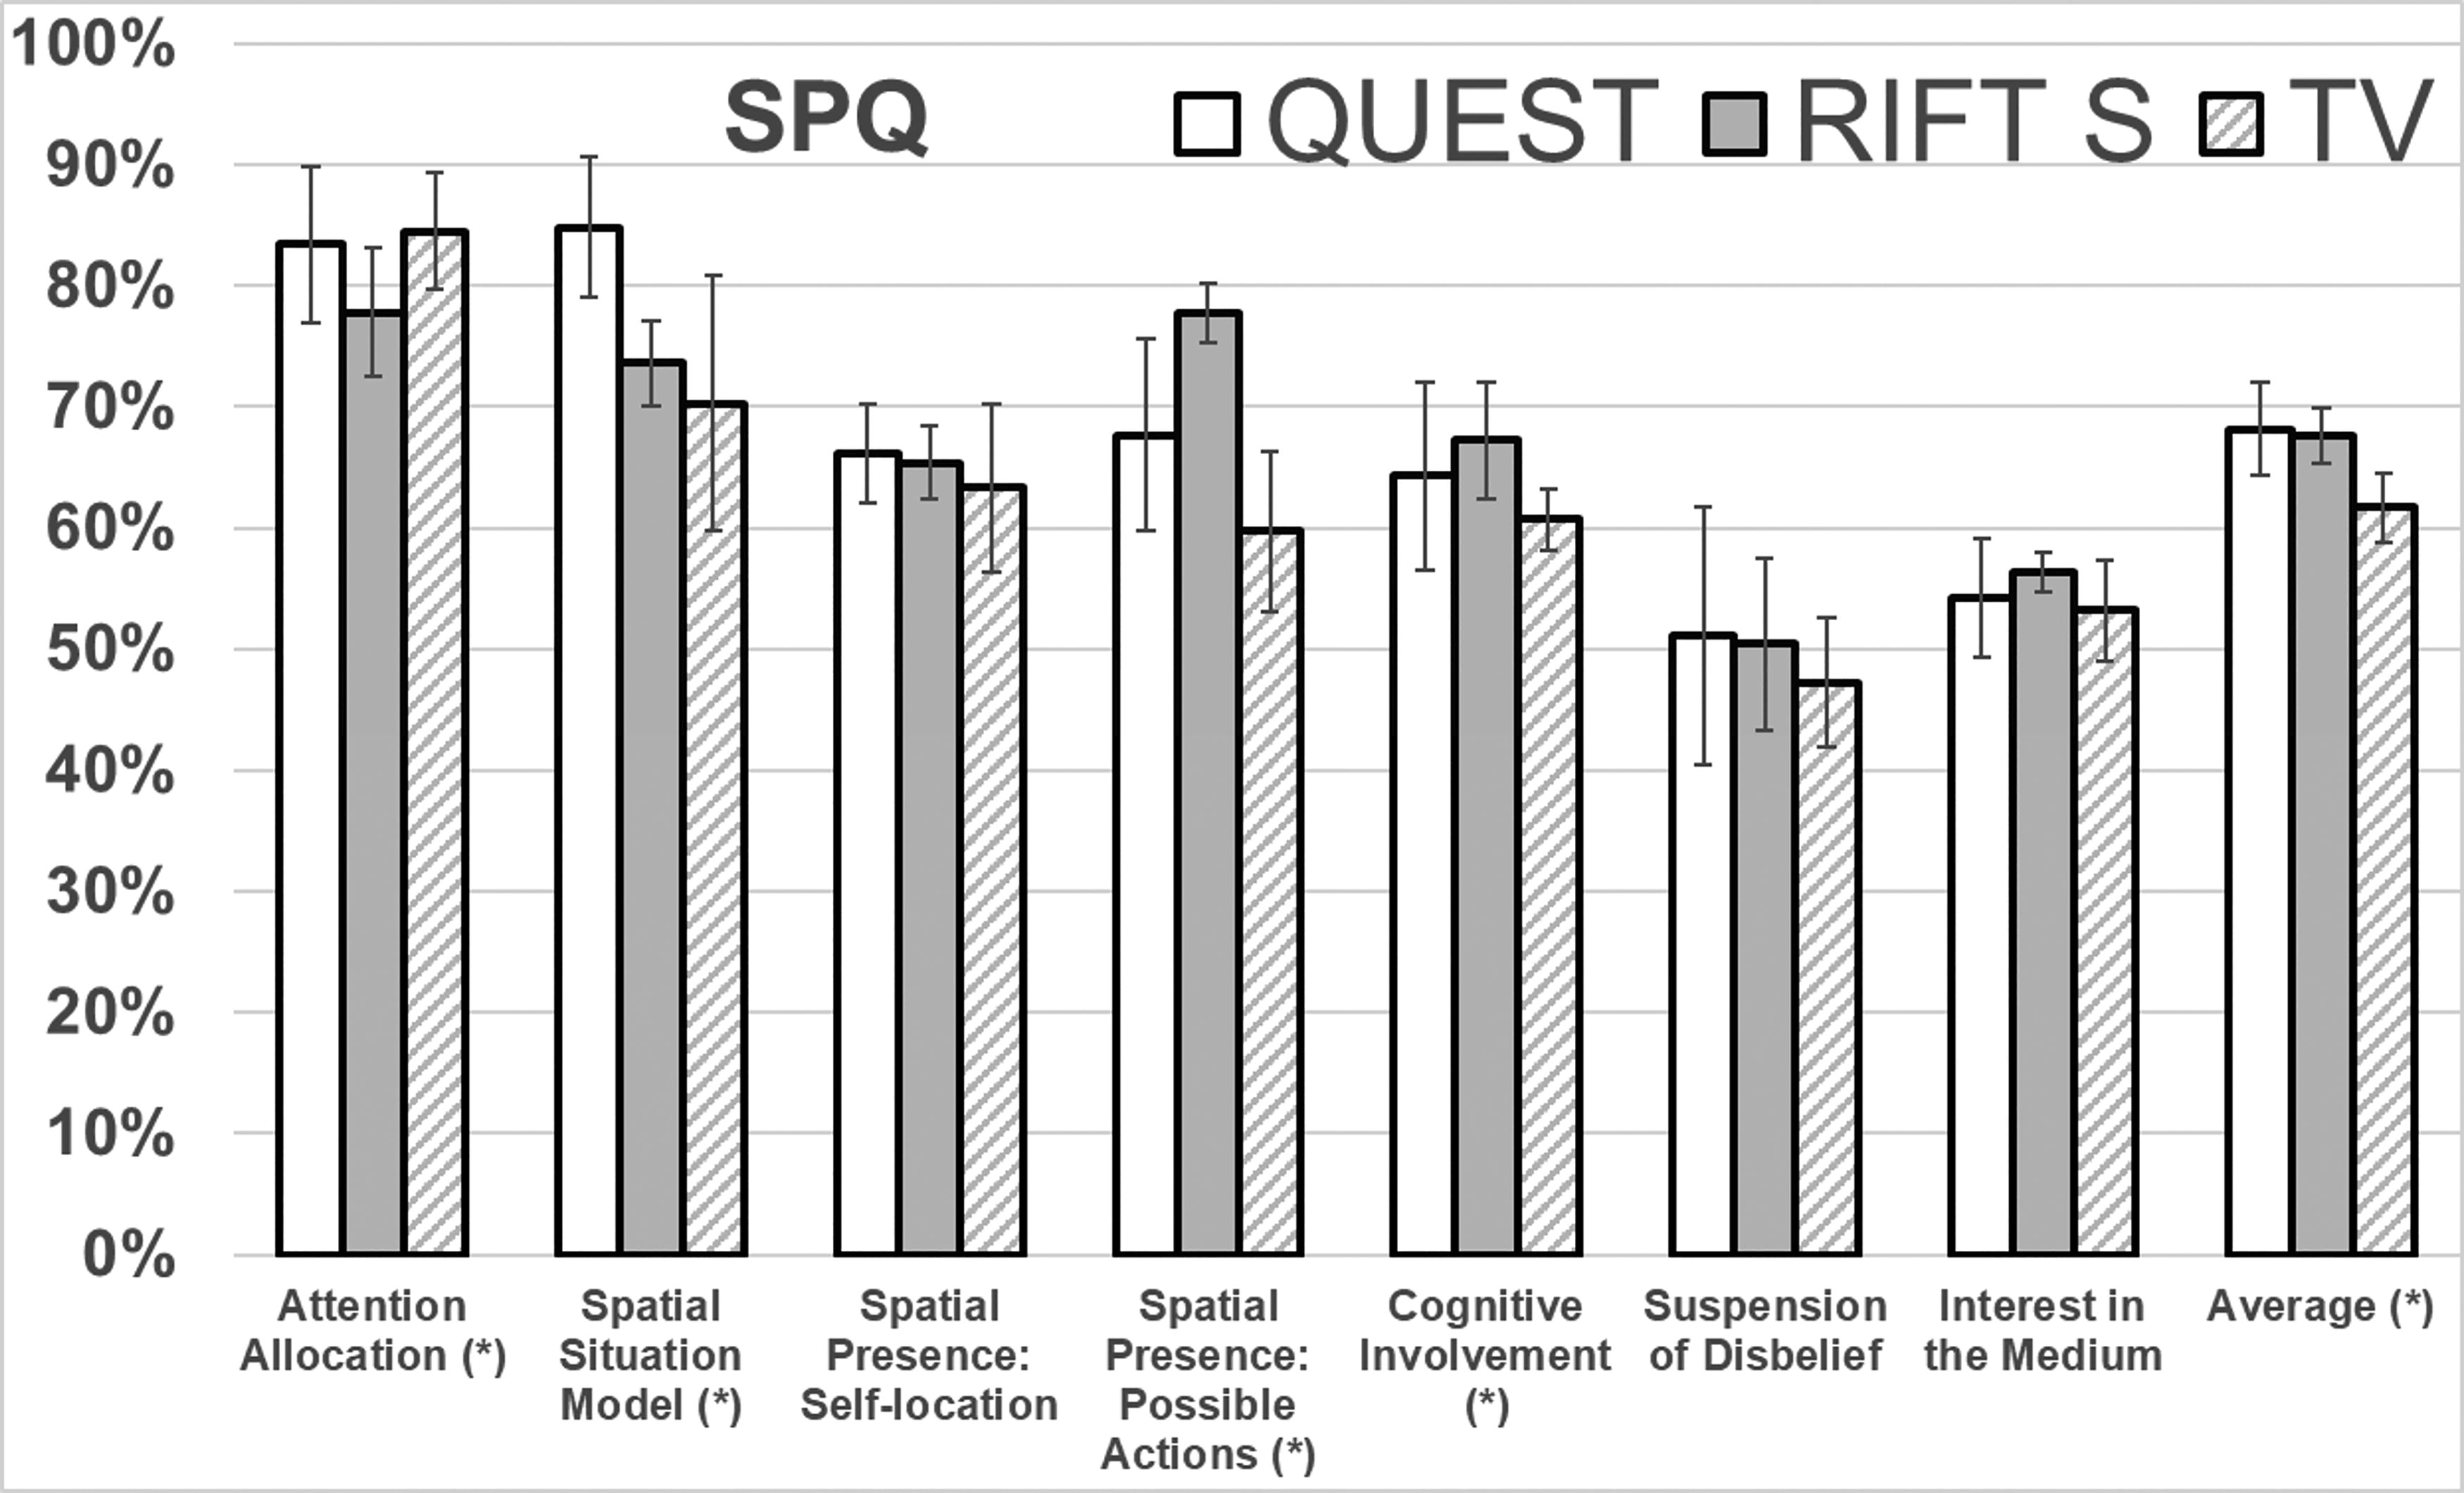
Results for Spatial Presence Questionnaire. The standard deviation is shown on the chart. Components with statistically significant differences are denoted by an asterisk.
Considering subscales the differences between TV and HMD are particularly well visible for the “Possible Actions” component (30% increase) and the “Spatial Situation Model” component (21% increase). The results for TV are similar to those obtained for HMD for the following components: “Attention Allocation” and “Interest in the Medium”. The differences between Rift S and TV are statistically significant for the following components: “Attention Allocation” (P = 0.04), “Possible Actions” (P < 0.001), and “Cognitive Involvement” (P = 0.014). The differences between Quest and TV are statistically significant only for the “Spatial Situation Model” (P = 0.03).
In favor of Rift S, the biggest difference was observed for the “Spatial Presence: Possible Actions” (increase by 15%, P = 0.03) compared to Quest. The result in the “Spatial Situation Model” is higher for Quest than for Rift S (15% increase, P = 0.001).
Technology acceptance
It is important for the practical implementation of VR games in rehabilitation and physiotherapy centers to determine which method is preferred by patients (Fig. 3). For Rift S the total score is 14% higher (P = 0.0016) and for Quest 22% higher (P = 0.0003) than for TV. Quest was rated on average 7% better than Rift S (P = 0.03).
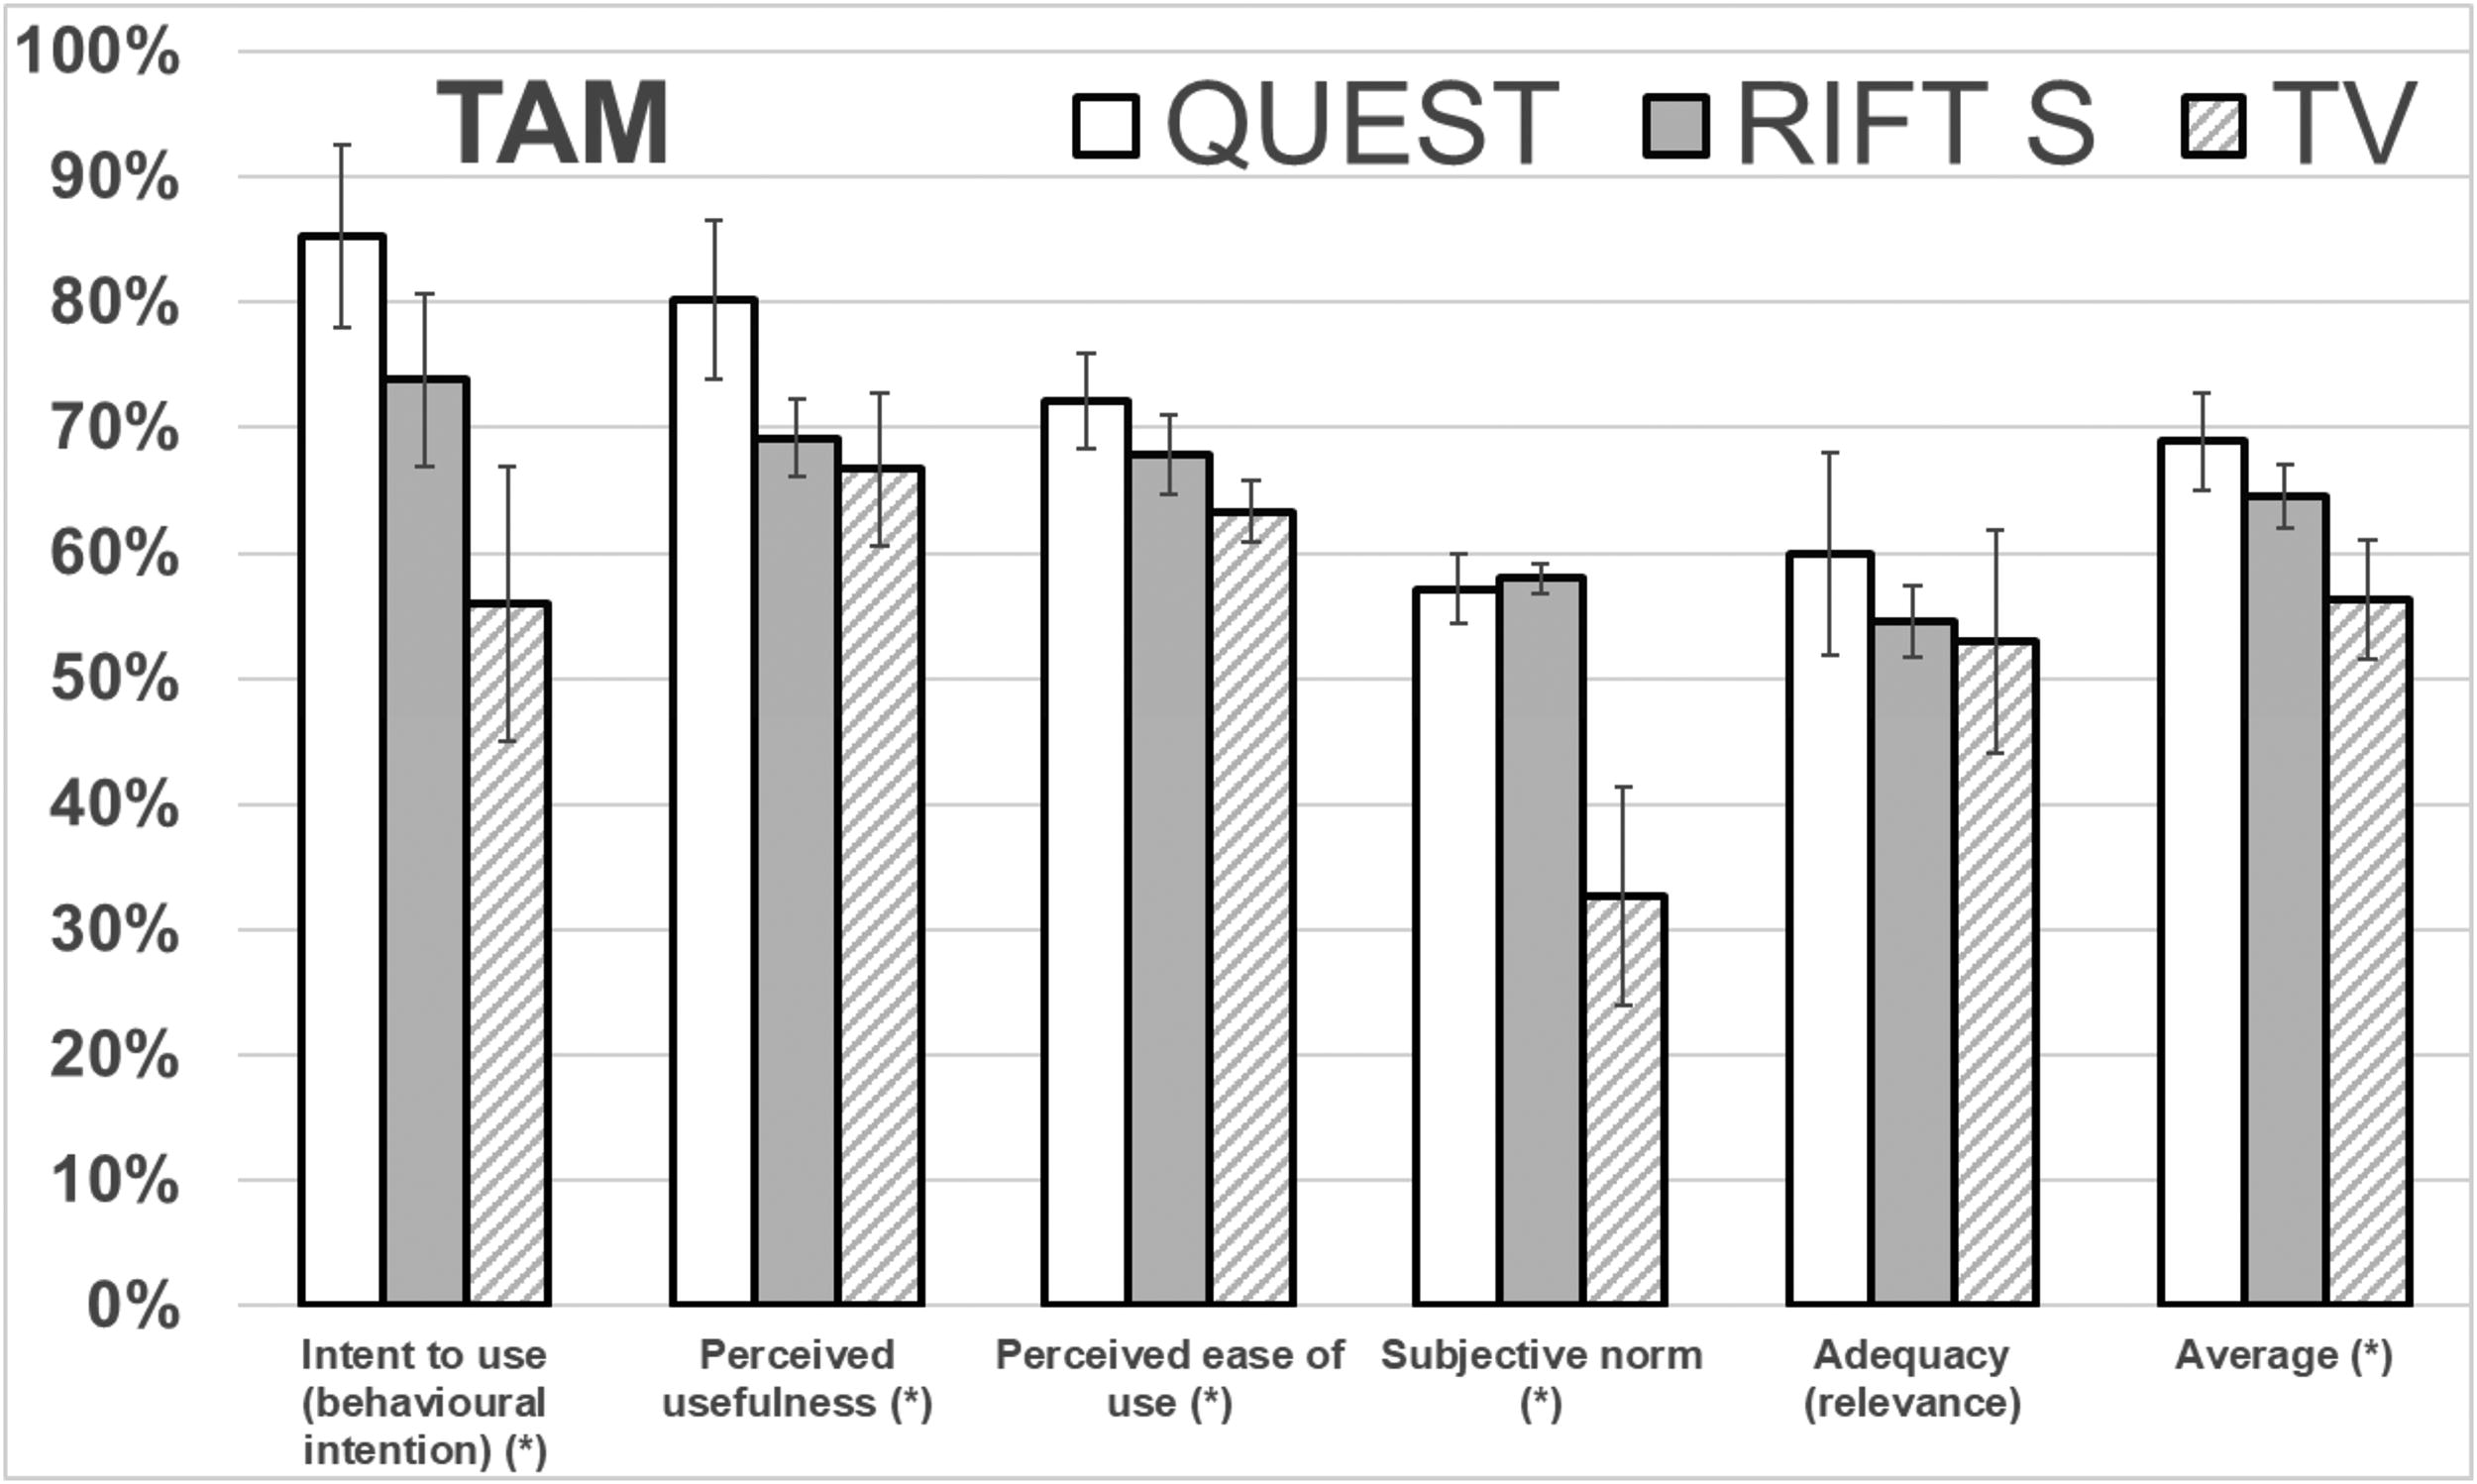
Results of the Technology Acceptance Model questionnaire. The standard deviation is shown on the chart. Components with statistically significant differences are denoted by an asterisk.
Considering subscales, comparing to TV the “Intent to use” value is 52% (P = 0.0002) and 30% (P = 0.007) better, for Quest and Rift S, respectively. The patients prefer to use an HMD rather than a TV, especially a wireless HMD.
The values of the following components are higher for HMD: “Perceived usefulness” (20% for Quest, P = 0.003) and “Subjective norms” (77% increase, P < 0.0001 and 75% increase, P < 0.0001, for Rift S and Quest, respectively). Patients consider HMD easier to use (7% increase, P = 0.02, and 14% increase, P = 0.001, for Rift S and Quest, respectively).
The statistically significant differences between HMDs are observed in “Perceived usefulness” (Quest was rated 16% better, P = 0.005), “Intent to use” the (Quest was rated 16% better also, P = 0.012) and “Perceived ease of use” (a 6% increase in favor of Quest, P = 0.05).
Load
The subjectively perceived load was measured using the NASA TLX questionnaire (Fig. 4). Considering subscales, the value of the “Mental demand” component is similar for all methods (the tasks were the same for all devices). The value of the “Physical Demand” component is highest for Oculus Rift S, (the result for wireless HMD is only slightly higher than for TV). For both components, the observed differences are not statistically significant.
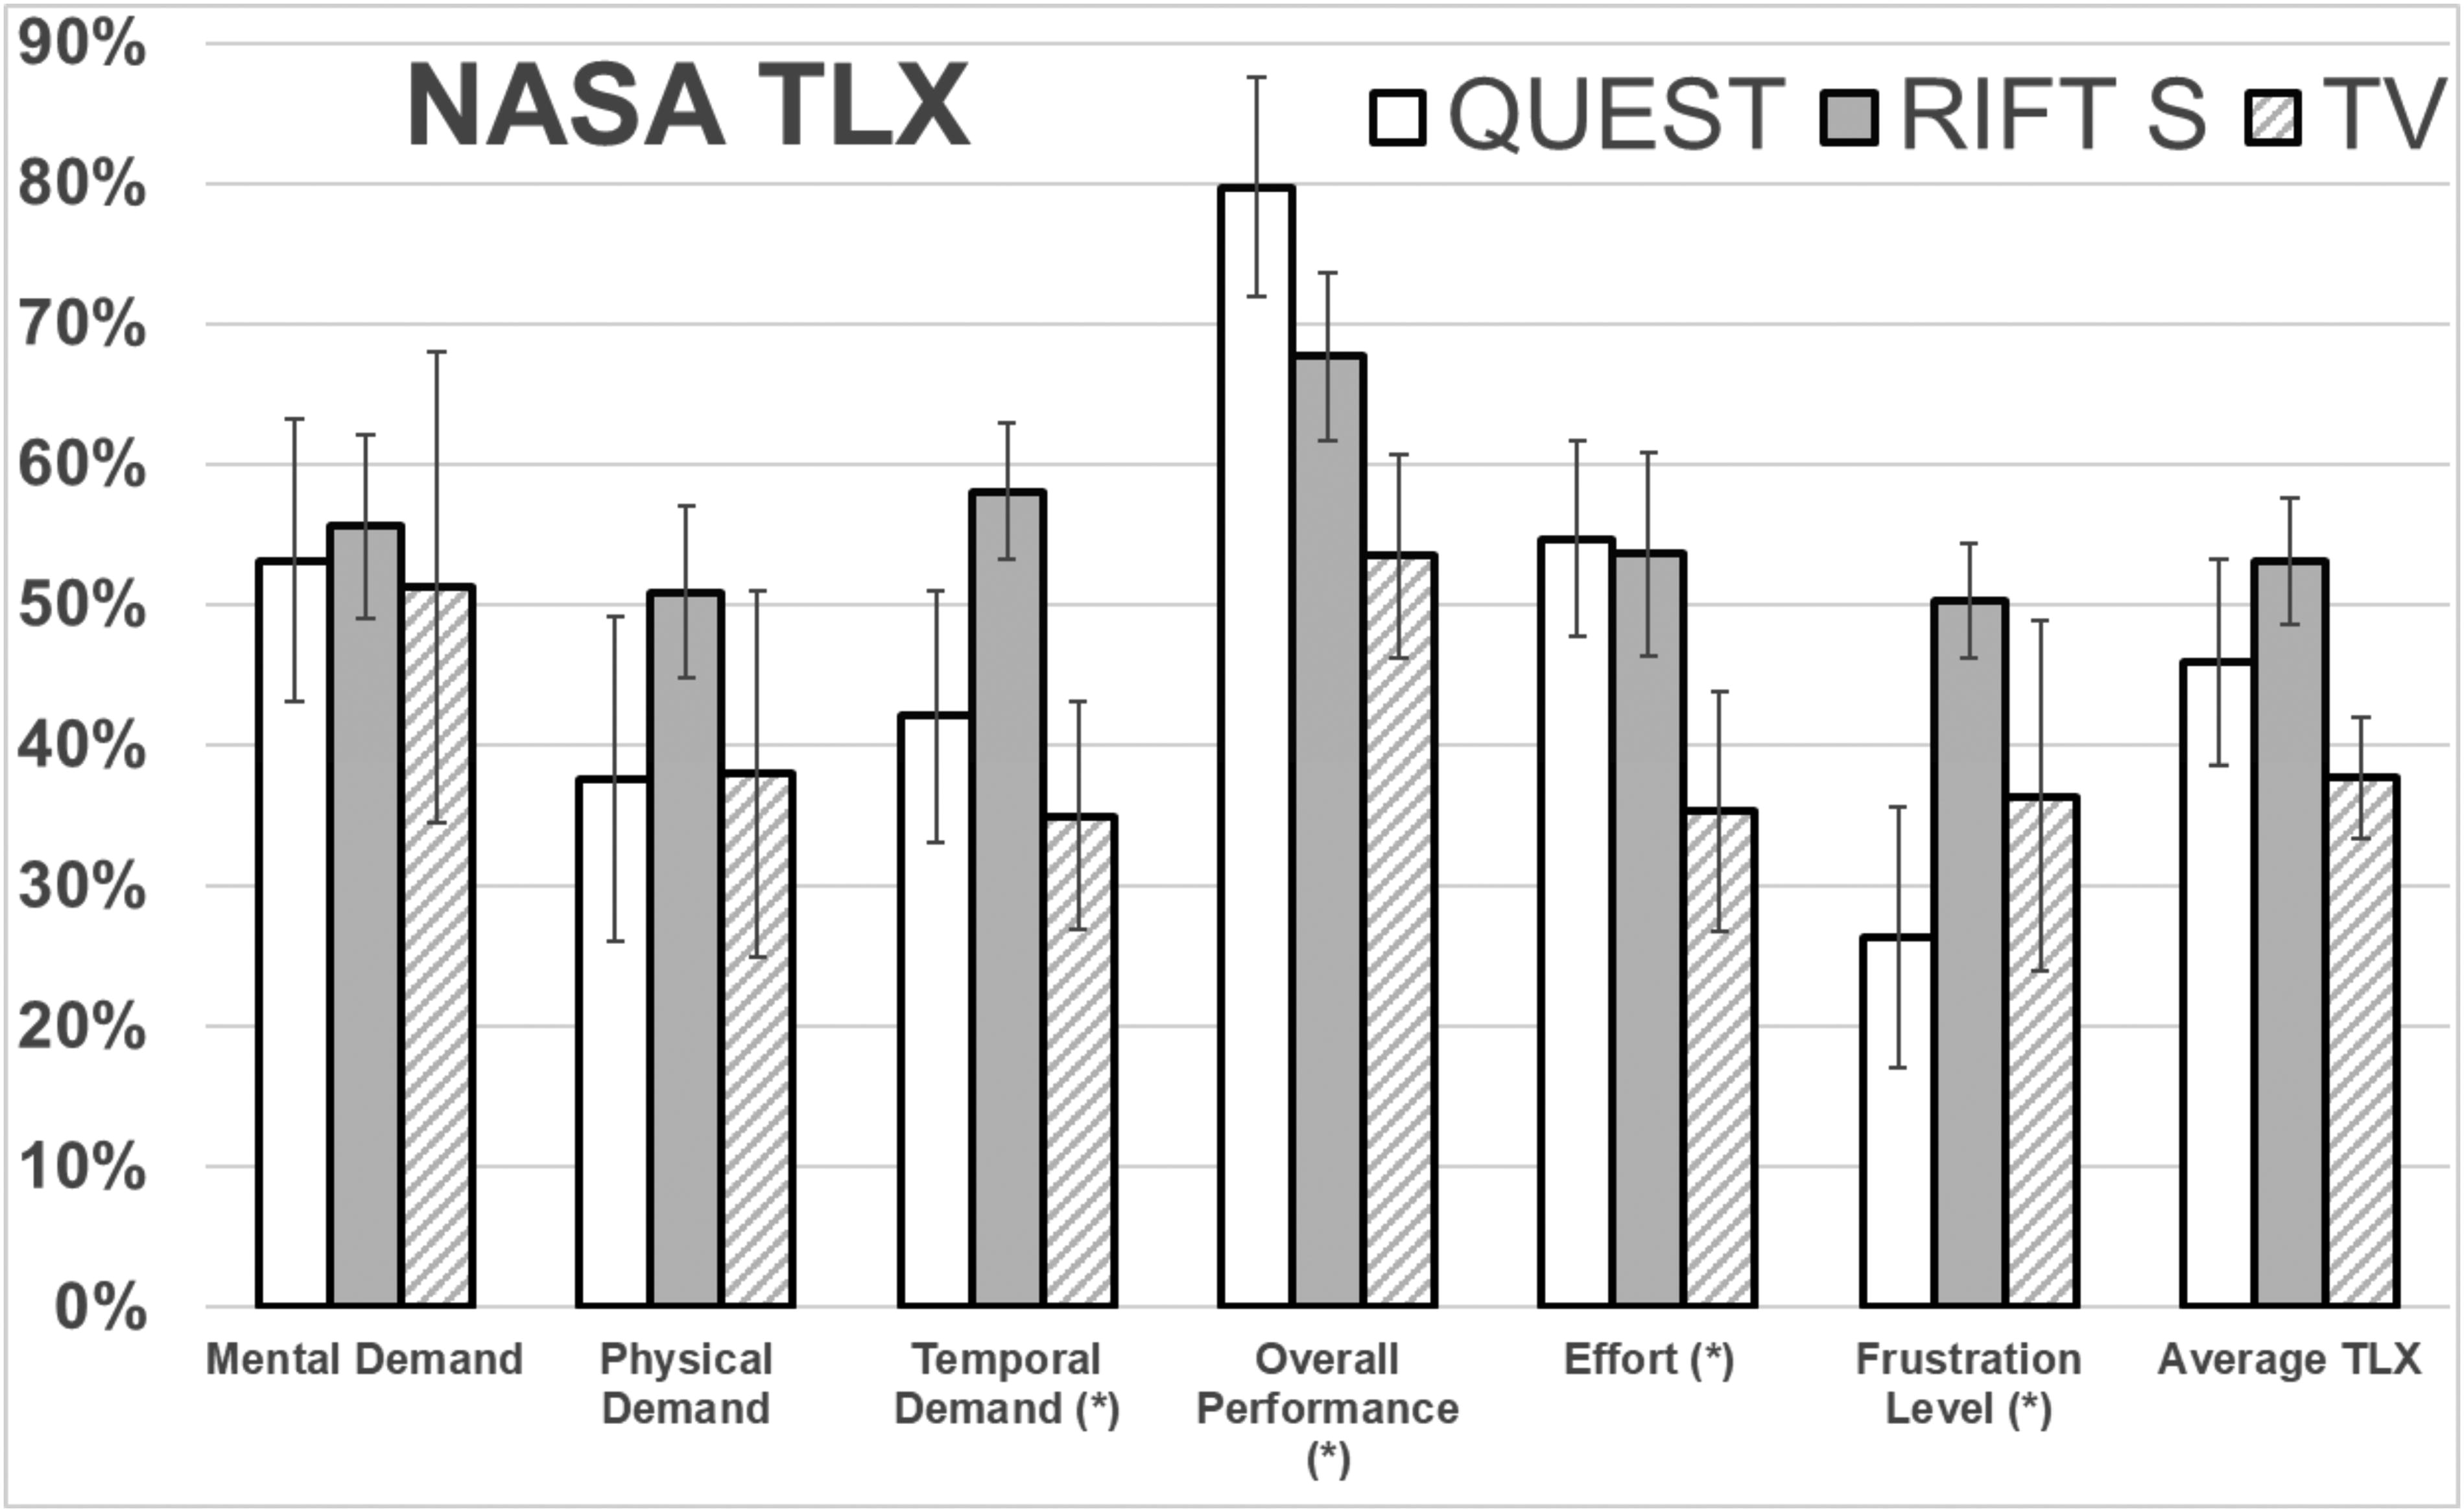
Results for NASA Task Load Index (NASA-TLX) questionnaire. The standard deviation is shown on the chart. Components with statistically significant differences are denoted by an asterisk.
Temporal demand for the Oculus Rift S is 63% higher compared to TV (P < 0.0001) and 38% higher compared to the Oculus Quest (P = 0.005). The mental effort is nearly equivalent for both HMDs but notably lower for TV (P = 0.001 for both Quest and Rift S). The frustration level is lowest for Quest. It is 27% lower than for TV (P = 0.014) and 48% lower than for Rift S (P = 0.0003).
Considering “Overall performance”, results are higher for Quest than Rift S (15%, P = 0.01) and TV (41%, P = 0.0001), indicating that patients evaluate the training as more effective. They are more satisfied with their effectiveness in achieving the task’s objectives. “Overall performance” is also statistically significantly higher for Rift S than TV (27% increase, P = 0.003).
Stress
The result of the stress measurement, which was made using the DSSQ questionnaire, is shown in Figure 5. The average results (total score) show the highest stress for the TV. The result for TV is 24% (P = 0.001) and 20% (P = 0.007) higher compared to Quest and Rift S, respectively.

Results for Dundee Stress State Questionnaire. The standard deviation is shown on the chart. Components with statistically significant differences are denoted by an asterisk.
Considering subscales, the difference is particularly evident in the “Task engagement” component (i.e., the stress associated with a task’s commitment). Value for TV is 24% (P = 0.0003) and 85% (P < 0.0001) higher than for Rift S and Quest, respectively. This component is also 49% higher for Rift S than for Quest (P < 0.0001).
The “Distress” component is highest for Rift S, and it is 19% higher than for Quest (P = 0.02) and 25% higher than for TV (P = 0.001). The “Worry” component is highest for TV, and it is 22% higher than for Quest (P = 0.02) and 20% higher than for Rift S (P = 0.01).
Simulator sickness
The measurement was taken before the test and immediately after using the games. The results are presented in Figure 6. The increase was observed only for the HMD Oculus Rift S (the average value increased by 28%). The result shows that in terms of comfort of use associated with simulator sickness symptoms, the best are Quest and TV.

Results for Kennedy’s Simulator Sickness Questionnaire. Scale from 1 to 4. The standard deviation is shown on the chart.
Usability assessed by physiotherapists
A training session for 20 physiotherapists was conducted at two rehabilitation centers, focusing on the use of a new rehabilitation system. The physiotherapists reviewed the content of the rehabilitation games included in the system. During this process, research was conducted to evaluate the system’s usability (Brooke 2013) in supporting physiotherapy through gaming. The average score obtained from this research was 74.5, indicating that the system is considered useful.
Discussion
To compare different interfaces effectively, the content and tasks in rehabilitation games were standardized across all cases. Consequently, the results for “Attention Allocation” and “Interest in the Medium” in terms of spatial presence were similar across all interfaces. When analyzing the spatial presence and comparing different HMDs, the most significant difference, favoring the Rift S, was observed in the “Spatial Presence: Possible Actions” component. This is likely due to the reduced delays during rapid movements, resulting from the superior computing power of the computer connected to the Rift S HMD. As a result, users were able to experience a greater sense of immersion in the virtual environment.
The patients find the HMD technology easier to use than TV. During the game, it is easier to position the upper limb accurately, because viewing the stereoscopic image from the head’s point of view, it is easier to replicate three-dimensional trajectories using the upper limb.23,26 The average value of NASA-TLX indicates that the load is consistently lowest when viewing the image on a TV. Wearing an HMD increases the effort component substantially, with minimal difference between the two HMDs, likely due to their similar weights. While HMDs do cause a higher load, this can be also attributed to the greater involvement, as indicated by the SPQ results. However, interpreting a larger load for HMDs as entirely negative may be misleading, because increased demand and effort could potentially enhance therapy by appropriately challenging patients.
The lower stress level associated with the HMD Quest is likely due to its wireless nature, eliminating the risk of accidents from tripping over a cable or damage caused by cable tangling. When we consider specific aspects, the difference is most noticeable in the “Task engagement” component, representing stress related to committing to a task. The high stress experienced when displaying images on a TV may be attributed to the user being immersed in a virtual environment while exercising with the HMD. This removes strong stimuli from the real environment, such as observations from a therapist assisting in the exercise, potentially contributing to the observed differences in stress levels.
According to a comprehensive meta-analysis 33 comparing 3D stereo displays (e.g., HMD) with 2D displays (e.g., TV), it appears that HMDs better support performance in most cases, particularly in tasks involving the recognition of spatial relations between objects, 26 such as in the case of a remotely controlled robot’s arm. 23 However, it’s important to note that some older studies 34 indicate that arm pointing movements in a 3D virtual environment showed no performance differences when viewed through an HMD versus a flat screen, suggesting that advancements in HMD technology, such as increased resolution and graphics quality, may be significant factors.
Interestingly, according to a review prepared by Apkan in 2018, 33 most authors who preferred 2D displays agreed that 3D displays offer overall better performance, but they preferred 2D because 3D VR is more challenging to use. In terms of different display technologies, the majority of participants in eye-hand coordination training saw greater improvement in VR than in 2D. 35 Results from a study involving players who played the same video game in 2D or HMD indicate that presence was higher in the HMD,36,37 which aligns with our findings.
Other studies also demonstrate the high usability 38 and acceptance 39 of using HMDs for rehabilitation games. For example, HMDs improve movement quality compared to conventional computer screens for rehabilitation tasks, 38 and immersive VR using HMDs increases walking speed and motivation compared to TV and conventional treadmill training in healthy participants and patients with multiple sclerosis and stroke. 39
Conclusion
The study compared three interfaces for rehabilitation: TV, stand-alone HMD, and HMD connected to a PC, involving 60 patients. Overall, the HMD showed better results regarding patient engagement, spatial presence, and reduced stress, though some NASA-TLX metrics did not favor the VR interface. The study emphasized the importance of considering delays in HMDs, particularly for fast upper limb movements, and highlighted that factors like ergonomics and satisfaction are crucial for physiotherapy. The Oculus Quest showed higher patient acceptance, intent to use, perceived usefulness, and satisfaction in achieving training goals without increasing stress levels.
It’s important to acknowledge the limitations of this study. As it was not a longitudinal study, the evaluation of different interfaces may change with the long-term use of the studied technologies. Future research should also focus on examining the various factors that impact the effectiveness and efficiency of therapy, as well as the improvement of upper limb functionality. Although review studies suggest that there’s no clear correlation between increased immersion and therapy effectiveness in motor recovery, 40 individual studies have shown that highly immersive VR with HMD is superior to traditional TV 39 or control group interventions. 41 Thus, there may be unidentified variables influencing motor recovery improvement, which require further investigation.
Footnotes
Author Disclosure Statement
The author declares that he has no known competing financial interests or personal relationships that could have influenced the work reported in this article.
Funding Information
This article has been based on the results of a research task carried out within the scope of the fourth stage of the National Program “Improvement of safety and working conditions” partly supported—within the scope of state services—by the Ministry of Family, Labor, and Social Policy. The Central Institute for Labor Protection—National Research Institute is the Program’s main coordinator.