




Abstract

Plenty is good. More is better.
At the end of September's analysis, it closed with the tease that October would likely make the previous month's national records of handle and revenue short-lived. The biggest factor in this relatively simple determination was the presence of “more.”
In October, there were five weekends, which meant five NFL Sundays versus the standard four. Five Saturdays of college football action versus the standard four. And more overall inventory of games to wager upon as the NBA and NHL started their respective seasons to help compensate for the finite amount of Major League Baseball playoff games available.
That extra inventory invited the prospect of more parlay wagering, be it traditional or the trendy single-game version. “More” also meant the number of states conducting legal sports betting—October would have Arizona conduct its first full month of sports betting, while Connecticut accepted its first wagers October 12 and commenced online betting seven days later. With handle records also set in both September and October of 2020, the finalization of October 2021 numbers also allowed for an intriguing year-over-year examination (see Fig. 1). There are factors that prevent the two sets of data from being a true like-for-like comparison: there were fewer states conducting wagering in 2020 versus 2021, and October 2020 had nine weekend days of wagering.
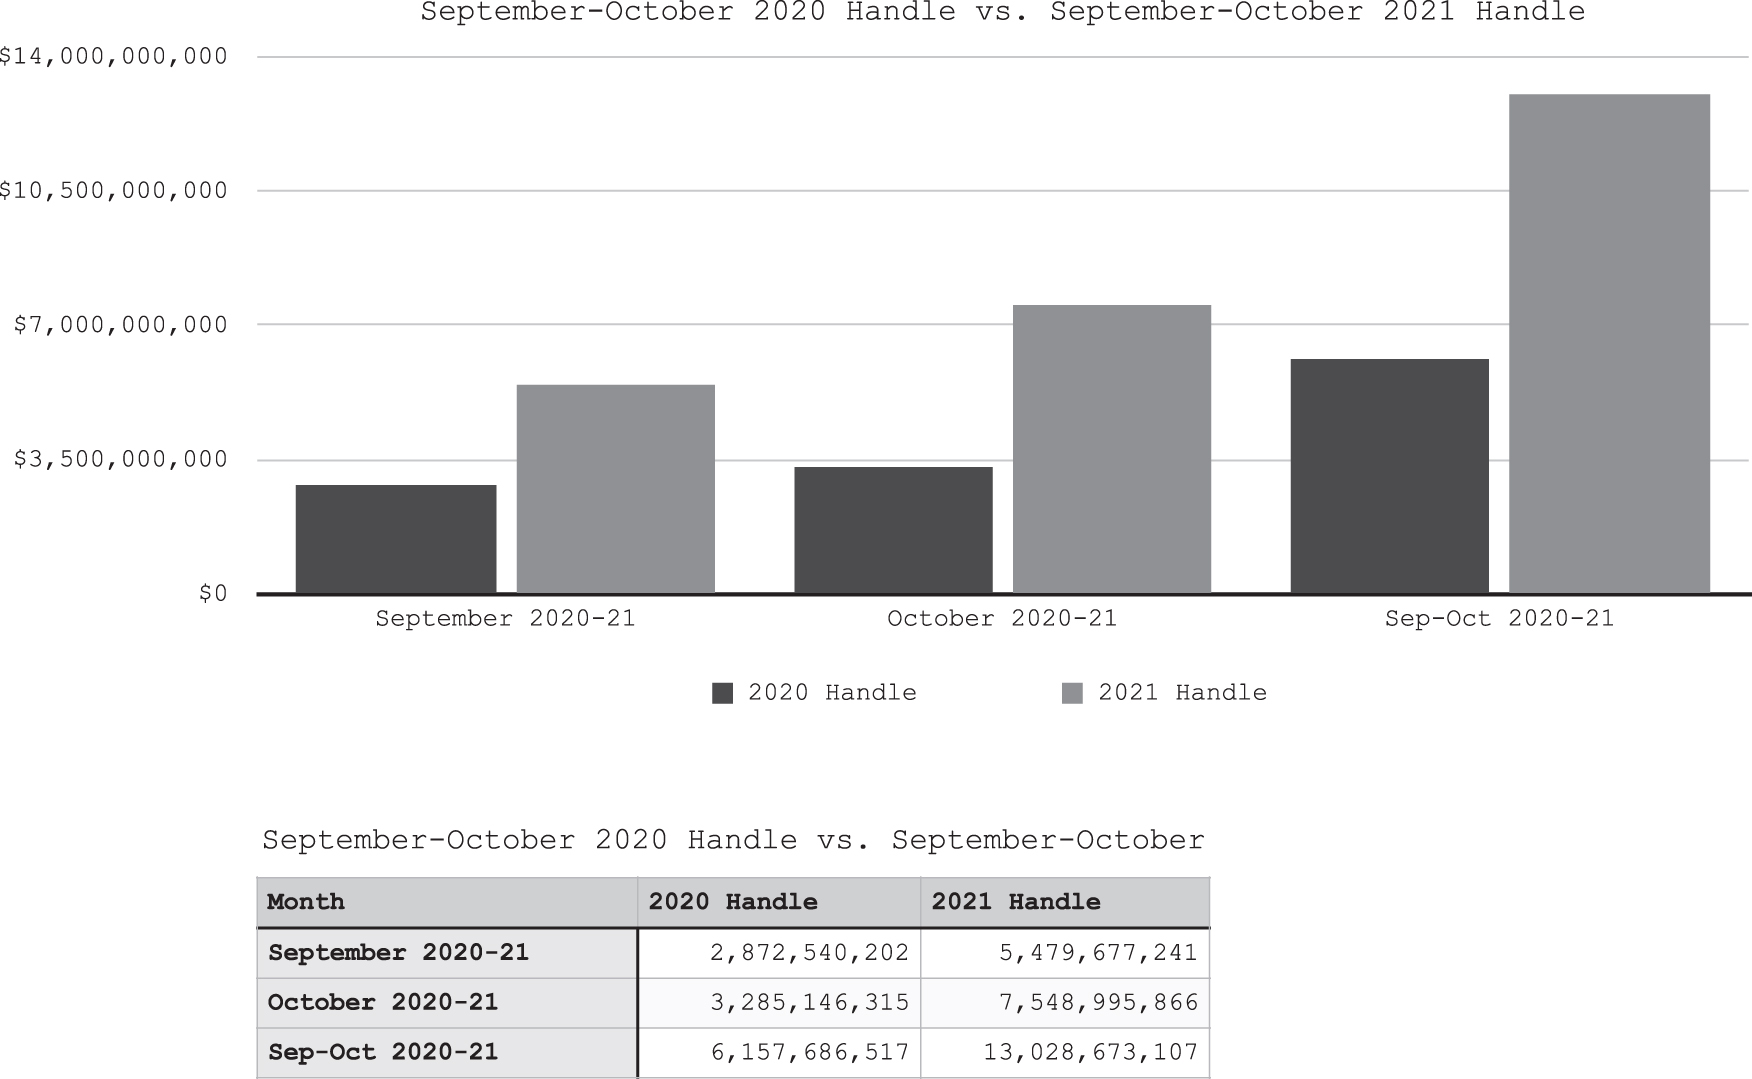
September–October 2020 handle vs. September–October 2021 handle.
But it was again clear the football and parlay wagering that sparked the first $5 billion monthly handle of the post-PASPA (Professional and Amateur Sports Protection Act) era continued to serve as the tide that lifted all numbers to their loftiest heights.
THE ALLURE OF THE HANDLE FIGURE
Providing sports betting handle figures is the best way to provide a sense of perspective to the general public of how much is being legally wagered. There is some industry debate whether this is the best entry point for the public given sports wagering is a business—people want to see how well these operators are doing when it comes to revenue—but there are layers to operator revenue that make those discussions more nuanced.
While there are two types of handle, traditional and completed events, traditional handle is the more commonly accepted version as it includes wagers made throughout that specific month. In contrast, completed events handle has monthly fluctuation because it takes into account “futures” bets that are made in advance for an outcome that may not be determined for weeks or even months from the time the wager is placed. An example of a futures bet would be someone placing a wager on a team to win the 2022 NBA Finals—which will not start until June—at the same time you are reading this story.
In October, 21 of the 23 states that conducted wagering set all-time monthly records for handle while Connecticut established its baseline as a debutant. To highlight the impact of what an extra weekend of action provided, nine states reported a month-over-month increase of at least $100 million compared to September. When those operators set the short-lived record for September, eight states had increases of $10 million or more.
As one would expect, powerhouse states Nevada and New Jersey were the primary drivers in national handle climbing 35.4% from September to October (see Fig. 2). In the case of Nevada, it joined New Jersey as the only states to post a $1 billion monthly handle, climbing nearly $313.8 million from September to $1.1 billion. For the Garden State, which had been the first state to reach $1 billion in September, it set a new national benchmark in October at $1.3 billion.
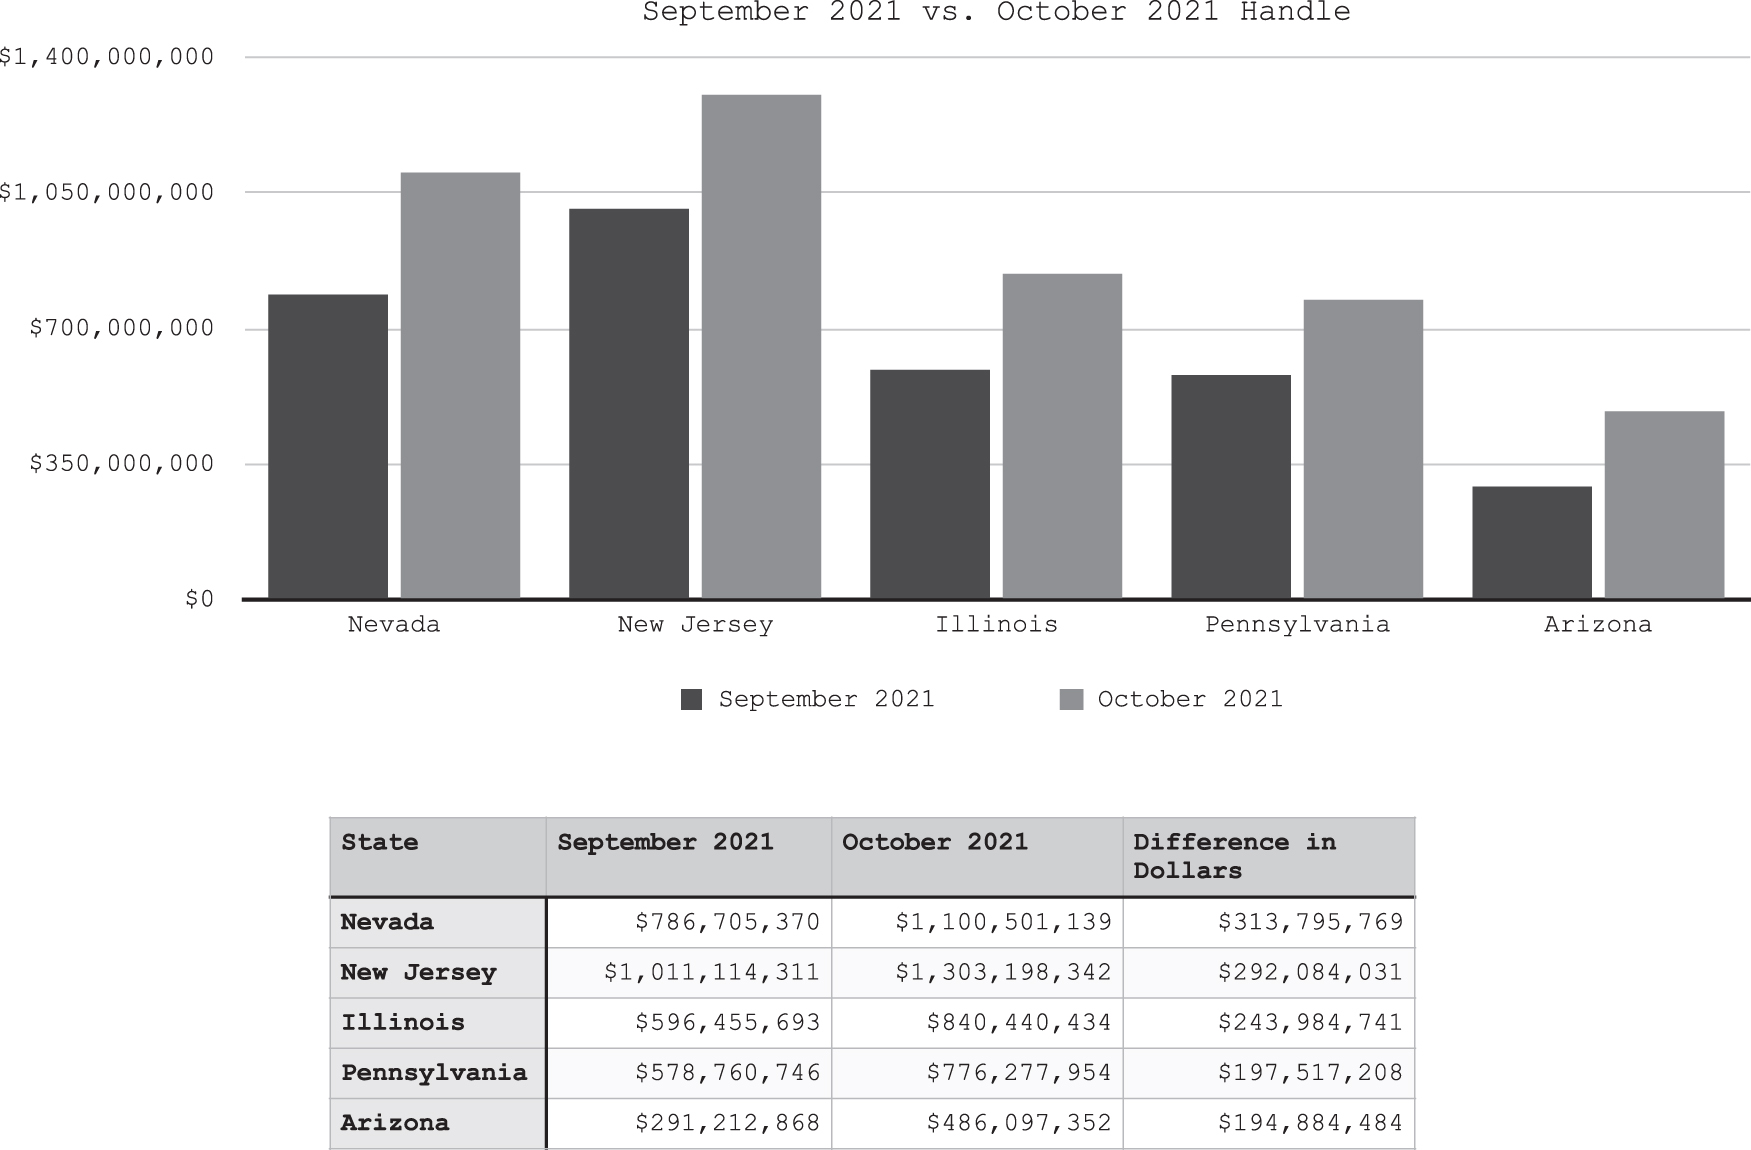
September 2021 vs. October 2021 handle.
Among those nine states, newcomer Arizona crashed the top five in its first full month of operation. The Grand Canyon State also quickly established itself as a Top 10 national market with its October handle of $486.1 million, meeting the high expectations of a state that moved in a relatively rapid fashion from governor's signature to accepting wagers while also navigating the challenge of combining commercial and tribal gaming operators.
Two other states that reported nine-figure increases, Virginia and Tennessee, were in the latter stages of impressive “rookie” seasons. Both states will likely end the 2021 calendar year having accepted more than $3 billion in wagers in a solely digital setting, with Virginia clearing $400 million for the first time in October with $427 million and Tennessee wrapping up its first 12 months of operation with more than $2.3 billion with an all-time high of $375.3 million in October.
The Rust Belt was also well-represented in this group with Michigan and Indiana. In the case of the Wolverine State, October's handle of $497.6 million was the highest reported of any state outside the “Big 4” of New Jersey, Nevada, Illinois, and Pennsylvania, and Michigan has since cleared the half-billion mark in handle. The Hoosier State continued to be a small state punching above its weight class in terms of nearly matching Michigan, aided in part from bettors in non-gaming jurisdictions Ohio and Kentucky crossing state lines to partake in the action.
WITH MORE HANDLE COMES MORE REVENUE
As mentioned previously, differentiating the types of revenue is one key reason handle is considered a better entry point for the general public when it comes to sports wagering. Another reason is the fluctuation in revenue amounts on a month-to-month basis based on bettor performance on a state-by-state basis.
For example, September's gross revenue of $440 million (see Fig. 3) smashed the previous post-PASPA era record set in January of $376.3 million in part because of an above-average operator win rate. The January win rate for gross revenue was 8.59%, and while the October win rate of 8.03% was more than one-half point lower, the nearly $1.7 billion difference in handle helped offset that gap.
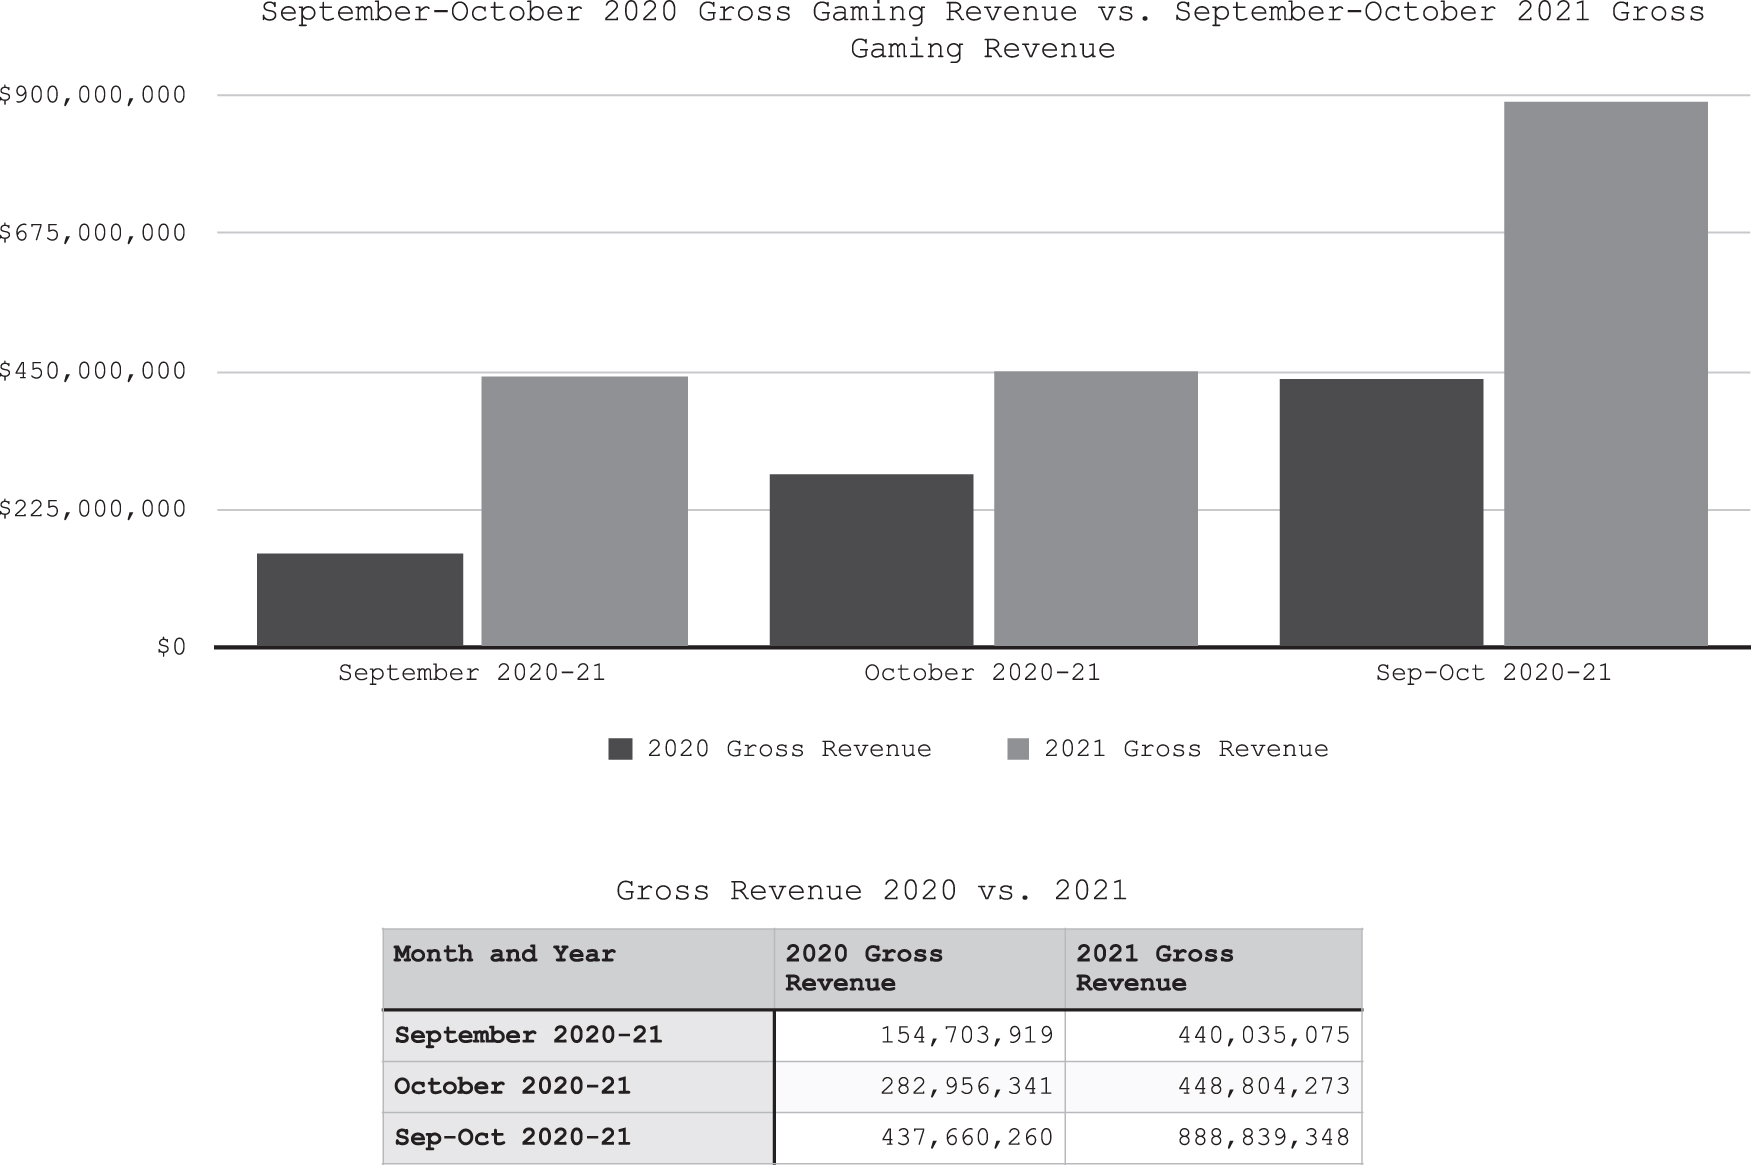
September–October 2020 gross gaming revenue vs. September–October 2021 gross gaming revenue.
The October handle was close to $2.1 billion more than September, which helped offset a far more drastic drop in operator win rate. The 5.92% hold was the lowest recorded in the first 10 months of the year, more than two full percentage points compared to September, but there was still enough wagered that gross revenue was $446.9 million, an increase of $6.8 million month over month.
Gross revenue, however, does not tell the whole story of winning and losing for sports betting operators. Multiple states do not tax percentages of promotional revenue at varying levels, which results in an adjusted revenue total eligible to be taxed that is sometimes substantially lower than gross revenue. And based on the performances of individual states, the percentage of adjusted revenue to gross revenue can also fluctuate.
While the gross revenue in September did set an all-time monthly post-PASPA era record, the adjusted revenue of $312.6 million did not. In October, however, there was an increase of $21.8 million in adjusted revenue despite the smaller $6.8 million increase in gross revenue and the much lower operator win rate.
Those revenue figures will take on increased prominence in November's analysis as the national numbers already show an all-time national monthly record in the post-PASPA era thanks to the combination of substantial handle and historically high operator win rate.