




Abstract
High-resolution melting (HRM) of DNA is a versatile method for mutation scanning that monitors the fluorescence of double-strand DNA with saturating dye. Performing HRM on a real-time thermocycler enables semiquantitative analysis (quantitative polymerase chain reaction, qPCR) to be associated to HRM analysis for detection of both large gene rearrangements and point mutations (qPCR-HRM). We evaluated this method of mutation screening for the two major breast and ovarian cancer susceptibility genes BRCA1 and BRCA2. Screening of these two genes is time-consuming and must include exploration of large rearrangements that represent 5% to 15% of the alterations observed in these genes. To assess the reliability of the HRM technology, 201 known nucleotide variations scattered over all amplicons were tested. The sensitivity of qPCR was evaluated by analyzing seven large rearrangements. All previously identified variants tested were detected by qPCR-HRM. A retrospective study was done with 45 patients: qPCR-HRM allowed all the variants previously tested by denaturing high-performance liquid chromatography to be identified. qPCR analysis showed three cases of allele dropout (due to a 104-bp deletion, SNP primer mismatch, and an Alu insertion). A prospective study was done with 165 patients allowing 22 deleterious mutations, 16 unclassified variants, and 2 rearrangements to be detected. qPCR-HRM is a simple, sensitive, and fast method that does not require modified PCR primers. Thus, this method allows in one step the detection of point mutation, gene rearrangements, and prevention of missing a mutation due to primer mismatch.
Introduction
BRCA1 (MIM# 113705)
In this study, we evaluated the sensitivity of the HRM technology by analyzing 201 known variants scattered over all amplicons of BRCA1 and BRCA2 genes and the sensitivity of qPCR by analyzing seven large gene rearrangements involving exons of BRCA1 or BRCA2. Results of a prospective study performed on 165 patients are analyzed.
Materials and Methods
DNA samples
DNA was isolated from peripheral blood after obtaining the patients' specific informed consent for BRCA1/2 genetic analysis. Samples were obtained from Hôpital Pitié Salpêtrière (Paris), Centre René Huguenin (Saint Cloud), and Centre François Baclesse (Caen). Human genomic DNA was prepared from whole blood samples using a semiautomatized Extragene® extractor (Genomic Industry, Archamps, France) and a DNA extraction kit (Promega, Charbonnières-les-Bains, France) according to the manufacturers' standard protocols, or DNA was extracted by column extraction with a QIAmp DNA blood kit (Qiagen, Courtaboeuf, France). Quality of DNA was assessed with the Nanodrop® technology (Coleman Technologies, Orlando, FL). Dilutions of DNA were normalized to 10 ng/μL before use. To validate the HRM assays, 201 DNA samples harboring known heterozygous gene variants randomly scattered in all amplicons of the BRCA1 and BRCA2 genes were screened by HRM (reported in Tables 1 and 2) and compared to profiles from 10 control individuals without any mutation or polymorphism (previously tested by denaturing high-performance liquid chromatography [DHPLC]). To validate the qPCR analysis, we analyzed seven DNA samples with known gene rearrangements of BRCA1 and BRCA2. DNA with a trisomy 13 was used as a control for BRCA2 duplication.
MUT, mutations; P, polymorphisms; UV, unclassified variants.
PCR and HRM conditions
Amplification of the entire coding sequence and intronic junctions of the BRCA1 and BRCA2 genes was performed with 33 amplicons and 46 amplicons, respectively.
Primers previously used for DHPLC screening were initially used as described (Wagner et al., 1999). If the HRM assay was not able to detect a variant previously identified by DHPLC, new primers were designed using the LightCycler Probe Design Software 2.0. The number of fusion domains was also checked by the Stanford Web site (http://insertion.stanford.edu/melt.html). Amplicons were chosen with a crossing point (Cp) before 30 cycles (the Cp is the fractional cycle number at which the fluorescence signal from the accumulating PCR product rises above background) and with no more than two fusion melting domains. Amplicon lengths were kept between 155 and 490 bp. Primers are listed in Table 1 for the BRCA1 gene and in Table 2 for the BRCA2 gene.
Real-time PCR cycling and HRM analysis of the genomic DNA samples were carried out on a LightCycler 480 System (Roche Diagnostics, Penzberg, Germany). Reaction mixture for HRM consisted in 0.3 μM of each primer, 1 × fluorescent intercalant agent (Resolight dye), 1 × LC480 Probe Master Mix (Roche Diagnostics), and 20 ng of genomic DNA samples. Assays were carried out in a 96-well format in 20 μL reaction volume and were performed using the touchdown PCR cycling and HRM conditions as follows. PCRs were initiated with a 10-min hold at 95°C, followed by 42 cycles of 95°C for 10 s, a touchdown annealing step (decreasing 1°C/cycle) ranging from 65°C to 55°C for 10 s and 72°C for 20 s. Each PCR run contained one negative (no DNA template) control. All qPCR-HRM experiments were performed in replicate.
qPCR data analysis
Quantitative analysis was performed to identify large gene rearrangements using the same couples of HRM primers. Relative allelic quantity was estimated by the delta-delta method, taking as a reference allele the SMAD4 amplicon (forward primer 5′-GCAACGTTAGCTGTTGTTT-3′ and reverse primer 5′-CTAGGATGAGCTCCATTTGTAG-3′ corresponding to a 300 bp amplicon) of the same DNA sample. The Cp for each reaction is the first cycle number at which the fluorescence signal from the accumulating PCR product rises above background. The gene copy number of samples was determined by comparative Cp method using the 2−ΔΔCp formula (Pfaffl, 2001). The ratio 2−ΔΔCp threshold was <0.75 for deletion and above 1.25 for duplication. To validate qPCR analysis, qPCRs were done in triplicate to identify five known BRCA1 rearrangements and two BRCA2 rearrangements. Large gene rearrangements identified in patients by qPCR analysis were confirmed by multiplex ligation-dependent probe amplification (MLPA) analysis. The SALSA MLPA P002 and P045 probemix kits (MRC-Holland BV, Amsterdam, The Netherlands) were used according to the manufacturer's instructions to screen for rearrangements of one or more exons of the BRCA1 and BRCA2 genes. Fragment analysis of multiplex PCR from MLPA was carried out on the ABI 3730 DNA analyzer (Applied Biosystems, Foster City, CA) and results were analyzed using GeneMapper software, version 4.0 (Applied Biosystems).
Melting conditions and melting analysis
The real-time PCR preceding HRM analysis can provide a useful quality control measure, because late Cp can cause increased variability between the melting plots and the gene scanning analysis. Therefore, HRM analysis should be designed so that Cp is below 30 cycles and dispersion of Cp between samples must be below 1.5 cycles. After PCR amplification, samples were heated to 95°C for 1 min and then cooled to 40°C for 1 min to induce heteroduplex formation. HRM curve data were obtained by melting over the desired range (70°C to 95°C) at the rate of 25 data collections per 1°C. HRM curve analysis was performed by LightCycler 480 Gene Scanning Software (version 1.5) to detect nucleotide variation. The first step of analysis is the normalization by selecting linear regions before (100% fluorescence) and after (0% fluorescence) the melting transition. For the normalization of the 100% fluorescence, each amplicon was analyzed with three different linear regions of a 0.5°C range before the melting transition. Sensitivity was set by default to 30% for all the amplicons. The normalized and temp-shifted melting curves allow samples to be directly compared. Difference plots were generated converting the melting profile to a horizontal line and normalizing the melting profiles of the other samples against a wild-type sample. A range of normality can be determined for each amplicon (usually a relative signal difference between −2 and +2), but a difference is also considered on the replicate. If the shape of difference plots is distinct from the wild type, the sample will probably have a genetic variant.
Sequencing
Samples with an altered HRM profile were directly sequenced from the amplified product obtained from the LC480. The PCR products were cleaned up on a MultiScreen™ PCR 96-well plate (Millipore, Billerica, MA) and sequencing reactions were carried out using the BigDye Terminator v1.1 cycle sequencing kit (Applied Biosystems). Products of the sequencing reactions were cleaned up using the Sephadex™ G-50 in a MultiScreen®-HV 96-well filter plate (Millipore), and then run up on an ABI 3730 DNA sequencer (Applied Biosystems). The resulting sequence data were analyzed with SeqScape software, version 2.5 (Applied Biosystems), in comparison with the reference sequence of BRCA1 and BRCA2 genes (NM_07294.2 and NM_000059.3).
Comparative genomic hybridization array
To confirm and characterize large rearrangements of the BRCA2 gene, a zoom-in comparative genomic hybridization (CGH) array was used. An 11,000-oligonucleotide microarray was specially designed with home-designed oligonucleotides and with already validated oligonucleotides from Agilent Technologies (Santa Clara, CA) (Rouleau et al., 2007). Of these, 3516 were located throughout the genome, 3107 oligonucleotides in the BRCA1 gene, and 2749 oligonucleotides in the BRCA2 gene and their flanking regions.
Results
Validation of qPCR analysis for gene rearrangement detection
Analysis was done using semi-qPCR by Cp data to estimate the copy number of gene fragments of interest in comparison with reference fragments. Three deletions and one duplication of the BRCA1 gene are shown on Figure 1a-d; one more deletion of exons 1 and 2 was detected (data not shown). We analyzed two gene rearrangements of the BRCA2 gene, exon 1 to 11 deletion (Fig. 2a), and duplication of exon 17 to 20 (Fig. 2b), whereas trisomy 13 DNA was used as a control for BRCA2 duplication (Fig. 2c). The large BRCA2 gene deletion from exon 1 to exon 11 was confirmed and characterized with zoom-in CGH array (data not shown). The size of this deletion was estimated between 427,337 and 435,142 bases (chr13:31811859-31376717 in hg18 nomenclature). The 3′ end of the deletion was within the exon 11 and the localization is 3456 bp after the first nucleotide of exon 11 between c.5368 and c.5383 (chr13:31,811,860-31,811,887 in hg18 nomenclature).
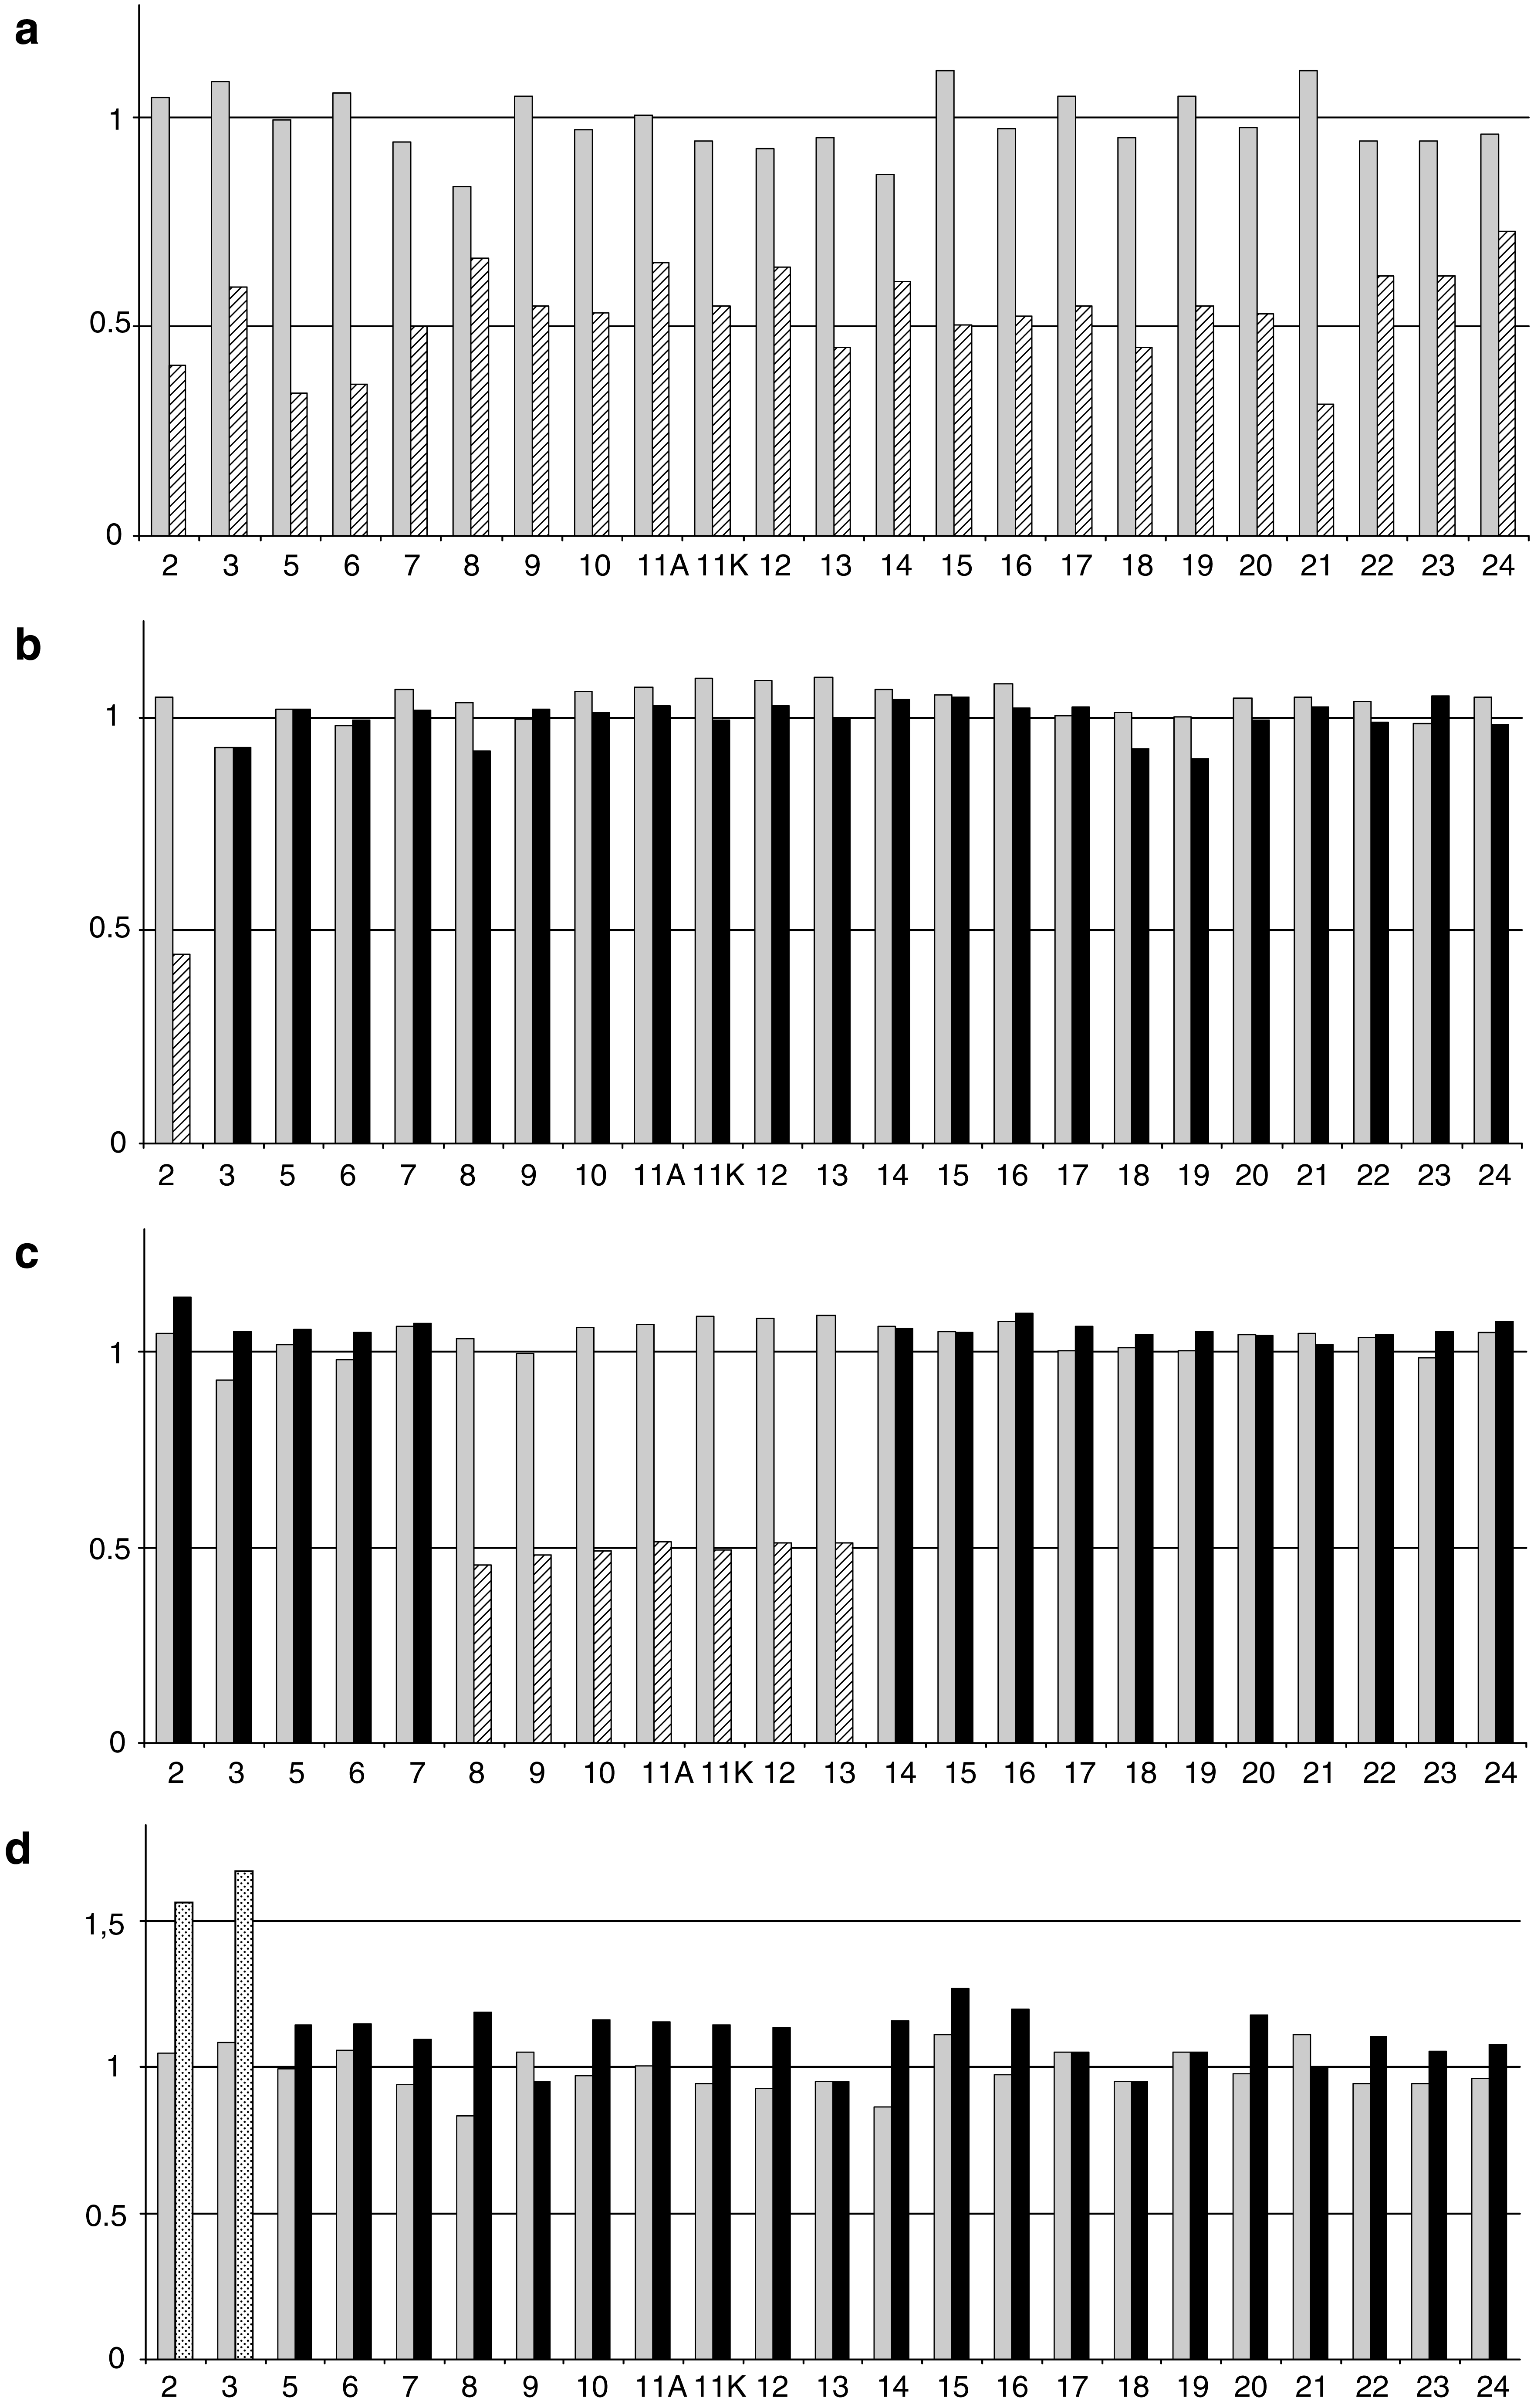
Quantitative polymerase chain reaction (qPCR) analysis for different BRCA1 gene rearrangements. BRCA1 amplicons were normalized to a reference gene (SMAD4). The 2−ΔΔcp ratios are reported in the y-axis for one wild-type individual (gray bars) and one patient with gene rearrangement (black bars). Hatched bars represent deleted amplicon from the patient and dot bars represent duplicated amplicon from the patient: (
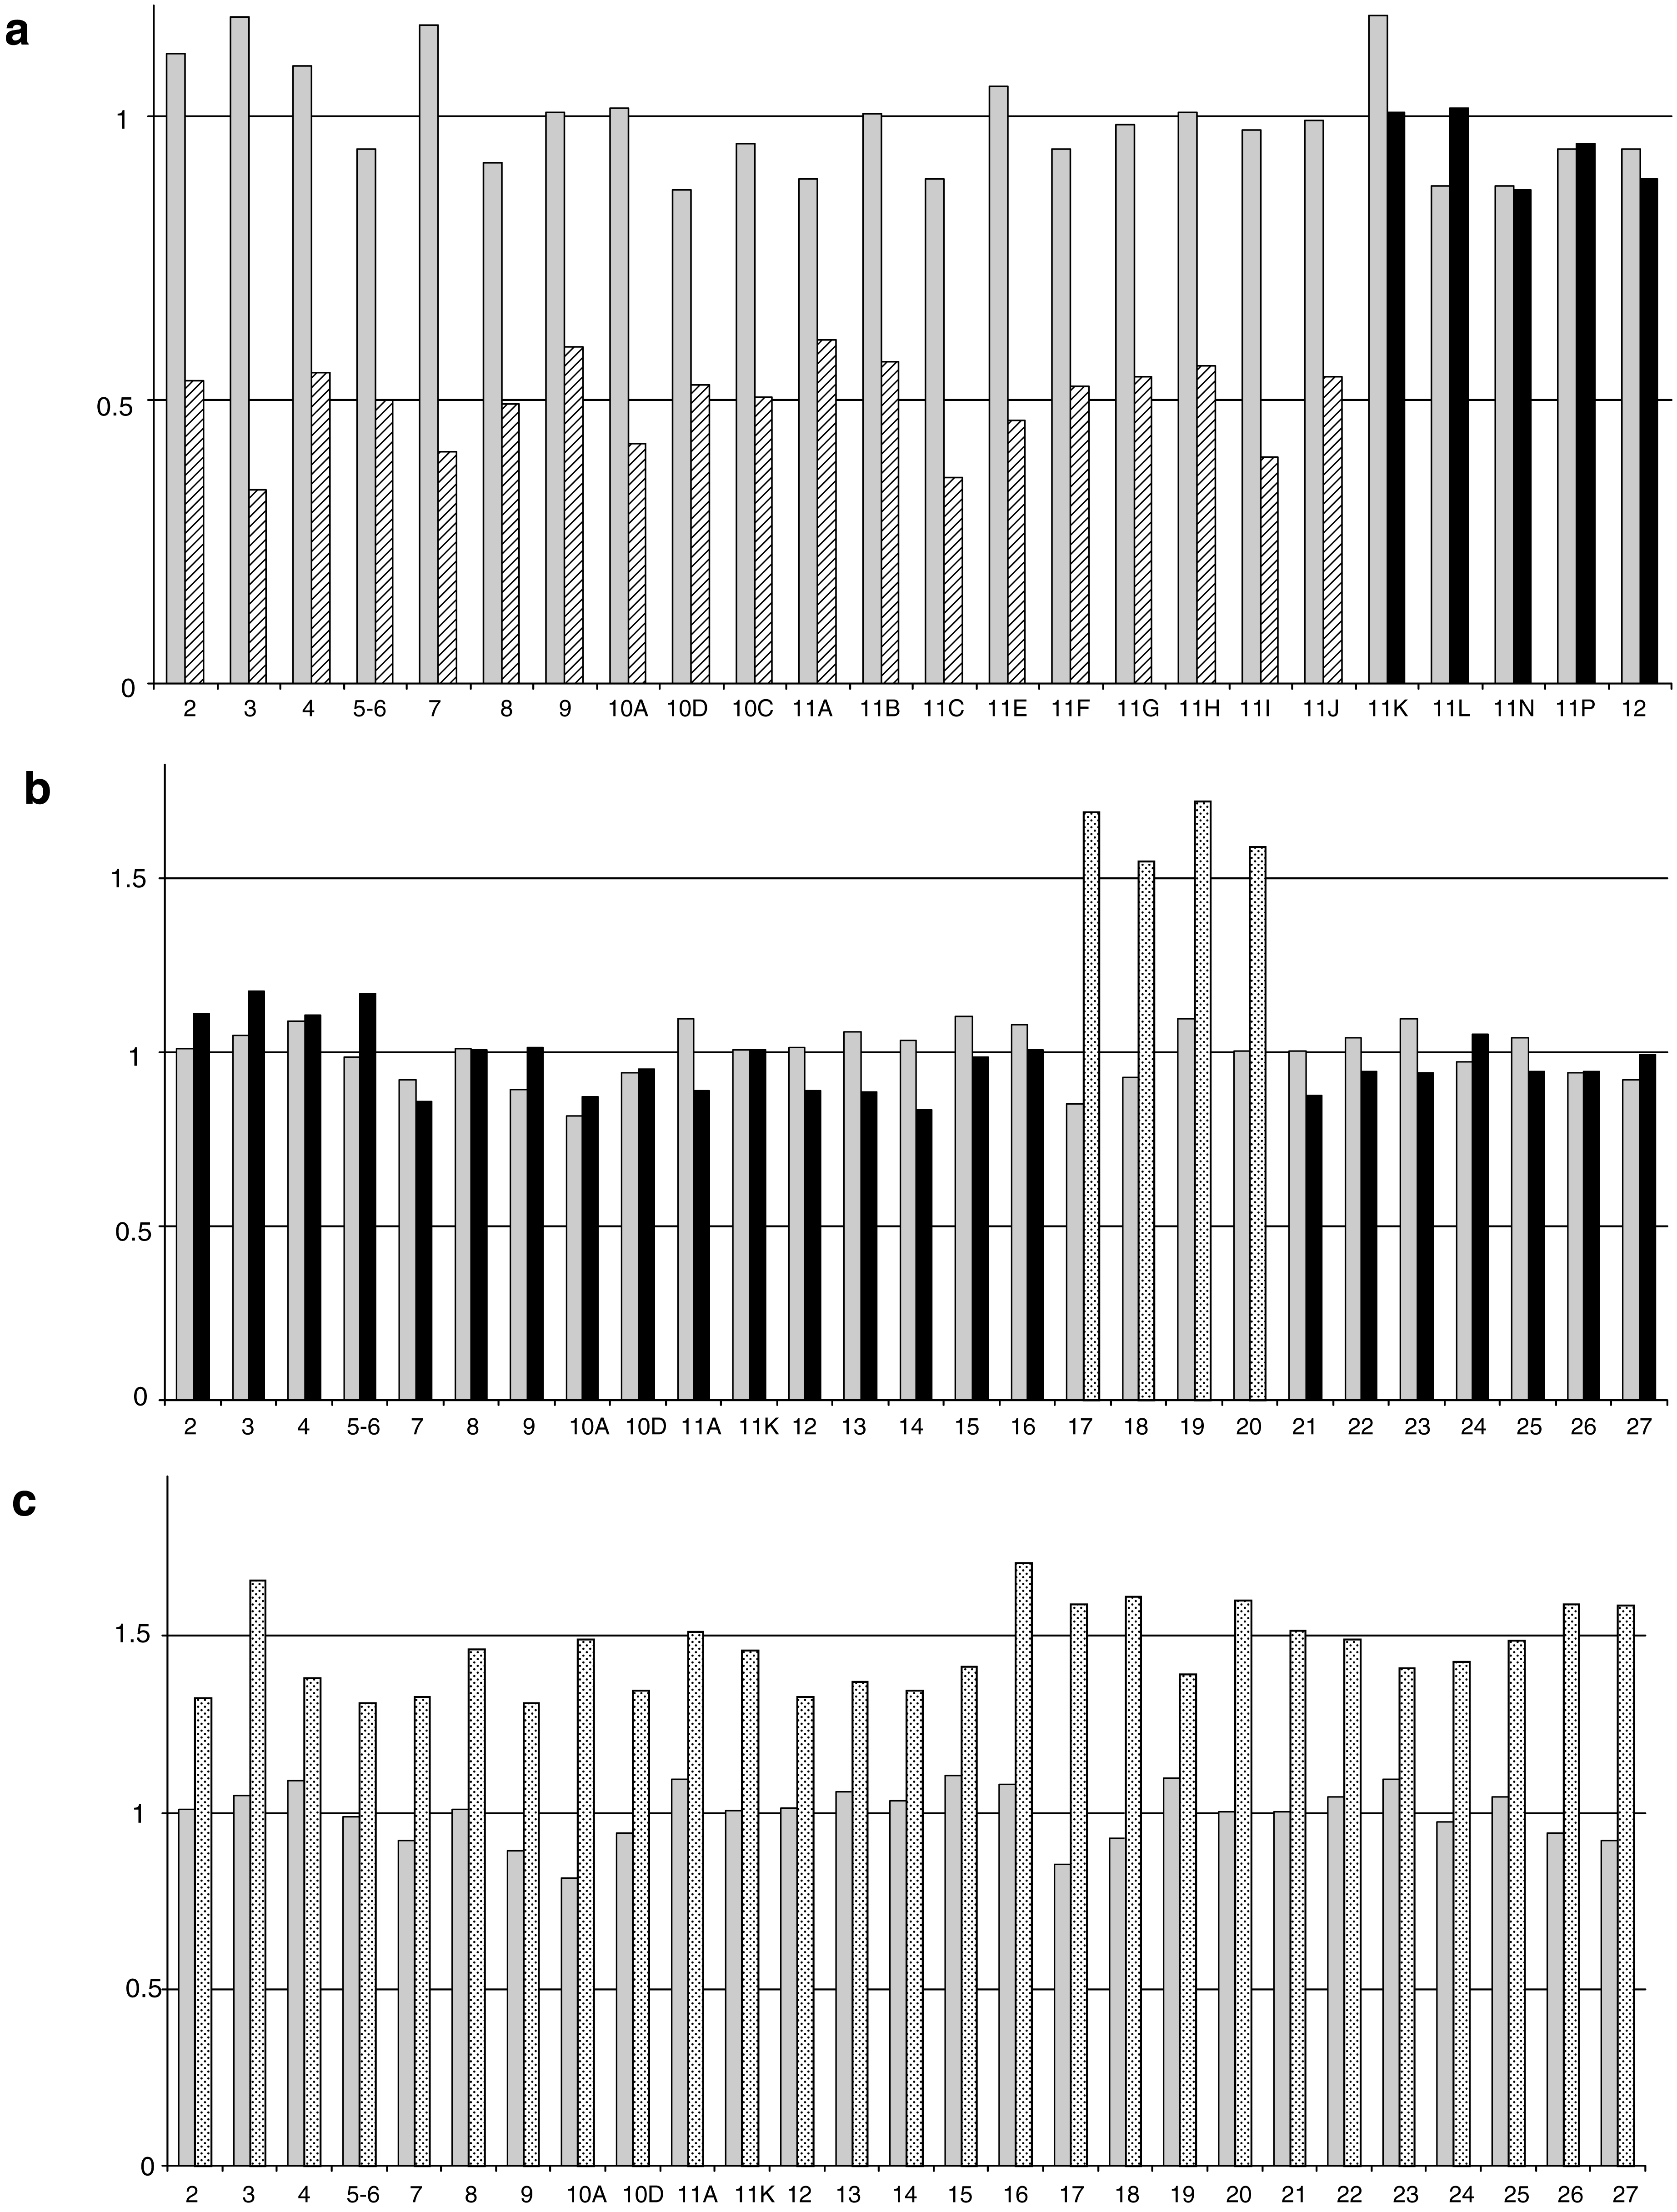
qPCR analysis for different BRCA2 gene rearrangements. BRCA2 amplicons were normalized to a reference gene (SMAD4). The 2−ΔΔcp ratios are reported in the y-axis for one wild-type individual (gray bars) and one patient with gene rearrangement (black bars). Hatched bars represent deleted amplicon from the patient and dot bars represent duplicated amplicon from the patient: (
We tested whether qPCR analysis is also able to detect an allele dropout linked to other mechanisms such as intra exonic deletion (Fig. 3), Alu-element insertion, or a variant located on the primer sequence. Figure 3a shows data applying to the 104-bp deletion (c.3313_3416del, p.His1105X) within BRCA1 exon 11, which was not detected by HRM analysis or DHPLC because the absence of amplification of the mutant allele with exons 11I and 11J primers (Fig. 3b). qPCR-HRM shows a ratio 2−ΔΔCp of amplicons 11I and 11J, respectively, equal to 0.48 an 0.52. The same result was observed with the inclusion of an Alu sequence (data not shown). We analyzed a DNA sample with the previously identified c.156_157insAlu BRCA2 Portuguese mutation (Teugels et al., 2005; Peixoto et al., 2009); the ratio 2−ΔΔCp of the exon 3 amplicon containing this mutation was equal to 0.47, which is indicative of a problem with a mutant allele amplification. Finally, a case of allele dropout was observed, since a ratio of 0.43 was calculated for BRCA2 amplicon 18B although the ratio of amplicon 18A was normal (data not shown). The variant c.8182G>A (p.Val2728Ile) (rs28897749) was identified by sequencing the 18A fragment showing the localization of this variant in the 18BF primer. This variant has been identified in 11 cases among 1959 French patients.
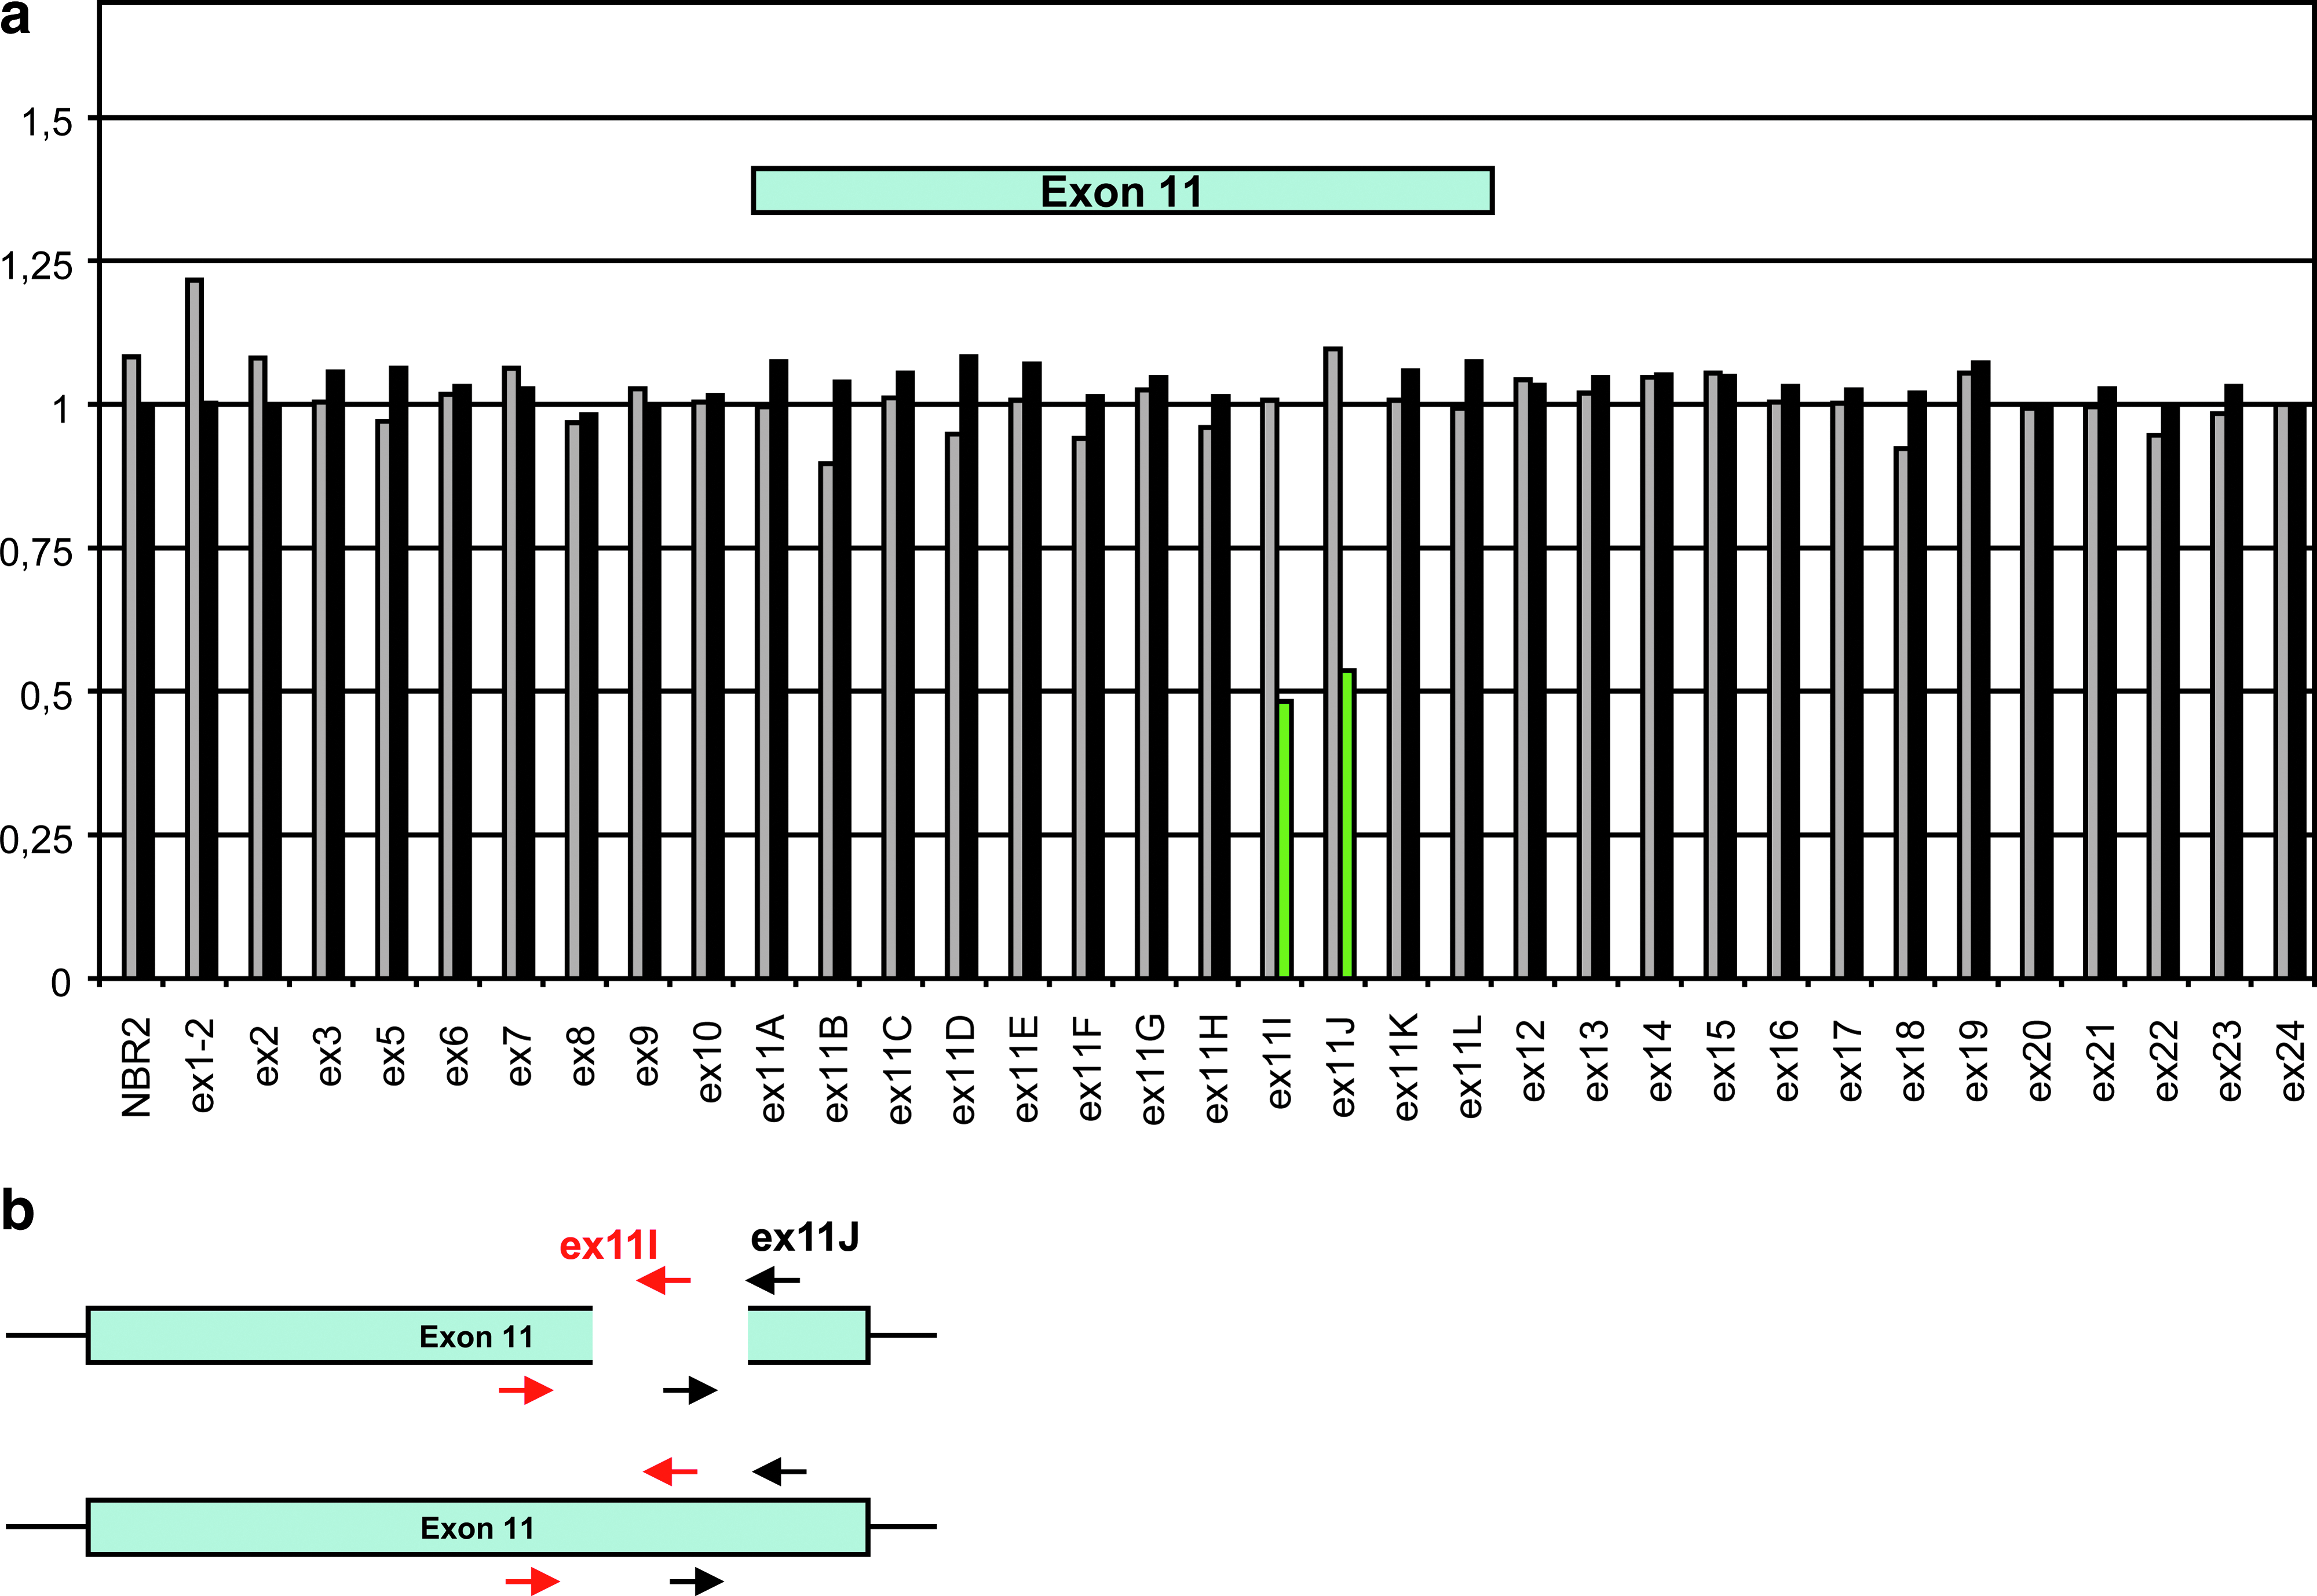
qPCR analysis of a partial deletion of exon 11 in the BRCA2 gene. BRCA2 amplicons were normalized to a reference gene (SMAD4). The 2−ΔΔcp ratios are reported in the y-axis for one wild-type individual (gray bars) and one patient with gene rearrangement (black bars). (
HRM assay optimization and HRM sensitivity testing
We evaluated the mutation detection capability of the HRM analysis using the LightCycler 480 System in testing a panel of 201 heterozygous variants previously detected by DHPLC and spread over all amplicons (98 variants in the BRCA1 gene [Table 1] and 103 in the BRCA2 gene [Table 2]). All gene variants tested correspond to 75 pathogenic mutations, 61 unclassified variants, and 65 polymorphisms. The melting curves of positive controls were compared with those of 10 control individuals without any mutation or polymorphism. With the primer sequences previously used in our laboratory for DHPLC screening of mutation in BRCA1 and BRCA2 genes (Wagner et al., 1999), we detected 99% of variants for BRCA1 and 90% of variants for BRCA2. Using primers reported in Tables 1 and 2, 100% of variants for BRCA1 and BRCA2 were detected, and two additional homozygous variants were detected in control individuals that were not detected by DHPLC analysis.
Figure 4a-d shows examples of accurate discrimination between fragments containing one nucleotide variant and one or two polymorphisms, and discrimination between homozygous and heterozygous. All samples of known genotypes were properly clustered by LightCycler 480 Gene Scanning Software. The increase of sensitivity setting to 0.5 allows grouping with better discrimination of different genotypes (especially when polymorphisms).

High-resolution melting difference plots for amplicons with polymorphisms. (
We show the added value of performing multiple analyses that take into account two different segments of the curve for the normalization of the 100% fluorescence before the melting inflexion point: we reported one example of the c.818C>G (p.Ser273X) mutation in exon 10 (amplicon 10A) of BRCA2 (Fig. 5); the melting curve shift was observed three degrees before the inflexion point. Replicates for amplicon 10A, containing the c.818C>G (p.Ser273X) mutation, have a similar pattern differing from the wild-type samples (Fig. 5a, b), and are out of the −2 to 2 relative signal difference only with the second analysis (Fig. 5c, d).
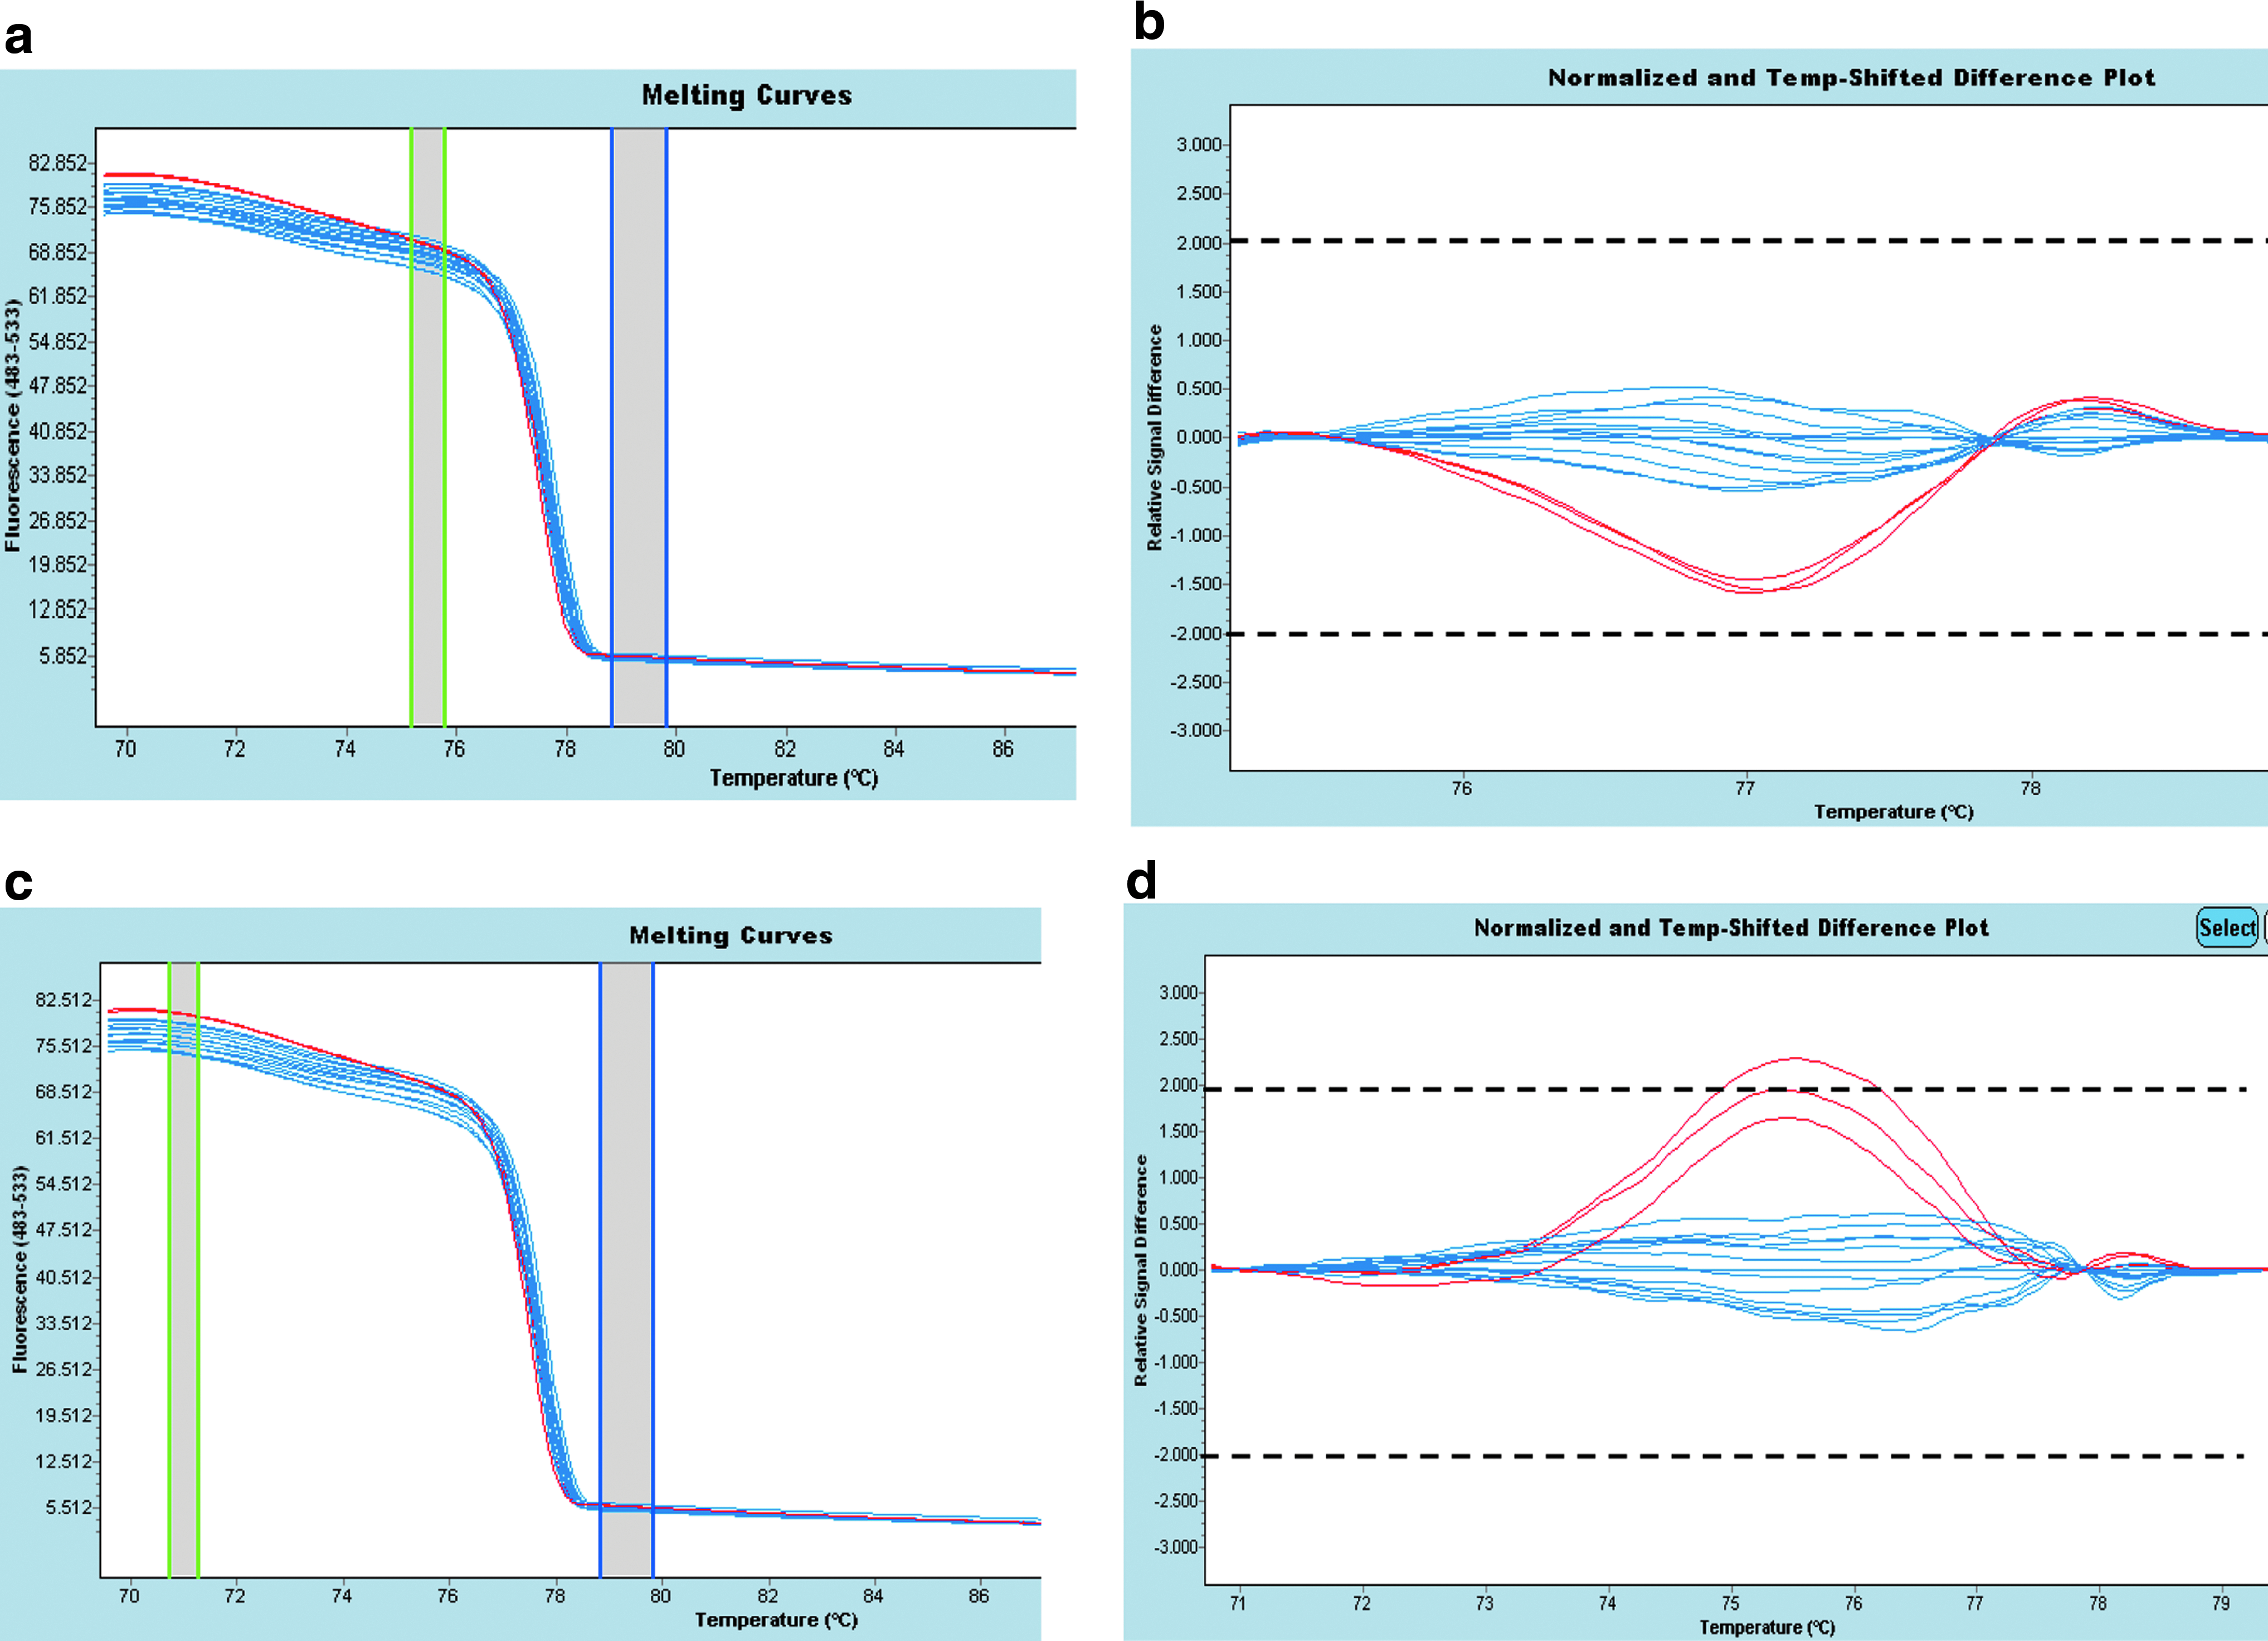
High-resolution melting curve of BRCA2 ex 10A. Red lines correspond to c.818C>G (p.Ser273X) mutation performed in triplicates; blue lines correspond to 15 wild-type samples. (
Further, a retrospective study was done with 45 patients previously tested by DHPLC. All the variants previously identified by DHPLC were detected by HRM analysis. We identified one more variant and also homozygous polymorphisms that were previously not detected by DHPLC.
BRCA1 and BRCA2 mutation screening (point mutation and gene rearrangement) in 165 patients by qPCR-HRM analysis
A prospective screening for mutations of BRCA1 and BRCA2 genes was performed on 165 patients by HRM analysis associated with qPCR analysis (qPCR-HRM). This study involves the scanning of 13,035 fragments. We sequenced fragments with multiple polymorphisms in the same amplicon, and all variant profiles (including polymorphisms) leading to the sequence analysis of 13% of BRCA1 fragments and 17% of BRCA2 fragments. Among the 165 patients, the HRM analysis allowed the identification of 22 deleterious mutations and 16 unclassified variants reported in (Table 3). The qPCR analysis identified two BRCA1 gene rearrangements corresponding to an exon 2 deletion and a deletion involving exons 17 to 24 (data not shown). These gene rearrangements were confirmed by MLPA analysis. A total of 24 deleterious mutations were identified corresponding to a detection level of 14%.
HGVS: Human Genome Variation Society.
Discussion
This study is the first report of a one-step technique (qPCR-HRM) for the screening of the BRCA1/2 genes, allowing the detection of point mutations and gene rearrangements in a single experiment. Enhanced mismatch mutation analysis is another technique described for the BRCA1 gene with simultaneous detection of the two types of mutations (Weber et al., 2007). In our case, since DNA amplification was performed on a real-time PCR thermocycler, it allows two different analyses on the same run: both the HRM analysis and qPCR analysis. So far, few studies have described the use of the HRM analysis for point mutation screening of BRCA gene segments (Takano et al., 2008; De Juan et al., 2009) or complete BRCA genes (Cvok et al., 2008; De Leeneer et al., 2008). None of these studies integrated qPCR data for both gene rearrangement detection and quality assessment as described in our report. qPCR HRM was previously reported for MLH1 gene screening in Lynch Syndrome (Rouleau et al., 2009).
qPCR-HRM is the first technique that allows a one-step detection of both point mutations and gene rearrangements together with an ability for pointing out primer mismatch. The rearrangement suspected by qPCR can be confirmed by another technique, such as MLPA. If not, additional investigations are required that can lead to the identification of either a large insertion or a primer mismatch.
The HRM method is easy to adapt from previous prescreening techniques based on heteroduplex detection, since, in our experience, in the majority of cases, DHPLC primer pairs can be used directly. The screening of new genes by HRM should be helped by prediction using Melt87 and SQHTX software (Desbois et al., 1993), which must be evaluated in this application. If compared to the DHPLC prescreening reference technique (Gerhardus et al., 2007), the same amplification conditions can be used for BRCA1 and BRCA2 screening by HRM, without any post-PCR step, allowing automation and high-throughput analysis. The sensitivity of the HRM method was analyzed with 201 known heterozygous sequence variants previously identified by DHPLC or DNA sequencing. All variants were detected by HRM. HRM sensitivity is comparable to DHPLC and even higher because we detected by HRM in our retrospective study a heterozygous mutation and additional homozygous variants that have been previously missed by DHPLC. HRM analysis often detects homozygous changes as well (Fig. 4a, b, d) although some homozygous mutations might still be missed (Reed et al., 2007; Gundry et al., 2008). The false-negative rate should therefore be considered as relative to the reference techniques (DHPLC and DNA sequencing). HRM is still considered as a prescreening method and the quality of heterozygous mutation detection depends on the amplicon design, which should be done carefully.
The proportion of resequencing depends on the frequency of polymorphisms in the gene sequence. In our prospective screening of 165 patients, sequencing all variant profiles (even if they correspond to a known profile of heterozygous or homozygous polymorphism) associated to the sequencing of uncertain cases corresponds to the sequencing of 13% of BRCA1 amplicons (compared to 14% in DHPLC estimation on 45 patients) and 17% of BRCA2 amplicons (compared to 9% in DHPLC estimation on 45 patients). The number of fragments to be sequenced can be decreased with increasing experience and with a replicate analysis that can eliminate doubts. The number of fragments to be sequenced can also decreased by the use of unlabeled probes for polymorphism genotyping (De Leeneer et al., 2009). In our prospective screening of 165 patients, there was no example of a mutation masked by a polymorphism.
Our data lead us to conclude that qPCR HRM is a sensitive, simple, rapid, and cost-effective method for the screening of BRCA1 and BRCA2 gene mutations. The major advantages of this method are the simultaneous detection of point mutations, large-scale gene rearrangement, and absence of amplification of one allele, a combined approach that is critical in genetic diagnosis.
Footnotes
Disclosure Statement
No competing financial interests exist.