




Abstract
Introduction: In association with candidate genes, the observed trait may be due to either one of the variant alleles or the interaction of variant alleles at different loci, which are in linkage disequilibrium. Aim: The objective of this study was to investigate the baseline allele and genotype frequencies, linkage disequilibrium (LD) patterns, and haplotype structures of common variants of the CYP2C8, CYP2C9, and ADRB1 genes located on chromosome 10. Methods: Two hundred and forty-five healthy subjects were recruited from South India and were compared with the HapMap Project's population for LD pattern, allele and genotype frequencies, and haplotype structures. Genotyping was done using polymerase chain reaction-restriction fragment length polymorphism and TaqMan assay on real-time polymerase chain reaction. Results: A significant ethnic difference was found in the LD patterns among the variant alleles between the South Indian population and other major ethnic groups, namely African, European, Chinese, and Japanese. Conclusion: This study established the normative allele and genotype frequencies, haplotype structure, and LD patterns of common variants of the CYP2C8, CYP2C9, and ADRB1 genes in a South Indian population (Tamilian). The data may be helpful to plan candidate gene-trait association studies in this population.
Introduction
T
Among the CYP2C9 variants, CYP2C9*2 and CYP2C9*3 are the most common variants (Sullivan-Klose et al., 1996; Bhasker et al., 1997) associated with decreased metabolism of CYP2C9 substrates (Aithal et al., 1999). CYP2C9*3 (0.067) is the most frequent variant allele reported in South Indian Tamilian, whose frequency was 0.09 in Caucasians and 0.017 in Chinese, suggesting that there exists interethnic variation in the distribution of these alleles (Adithan et al., 2003). The β1-adrenergic receptor (ADRB1) is a member of a G-protein-coupled receptor found mainly in the cardiac tissue and is involved in regulating the heart rate and increased atrial cardiac muscle contractility. The ADRB1 gene is located on chromosome 10q25.3 and the most common polymorphisms studied include 145A>G and 1165C>G, which are reported to have ethnic differences in their genotype and allele frequency distribution (Ellsworth et al., 2005; Mahesh Kumar et al., 2008). All these three genes (CYP2C8, CYP2C9, and ADRB1) were identified as candidate genes for complex traits such as cardiovascular diseases (Iwai et al., 2002; Yasar et al., 2003).
In the post-HapMap project era, identification of specific genetic markers for diseases continues to face a challenge despite the availability of extensive data on linkage disequilibrium (LD) pattern and haplotype structures of all the chromosomes in the human genome. The mode of inheritance of variations in a particular population and interaction among the multiple genes are the confounding factors in association studies of complex traits involving multiple genes. The frequencies of genetic variations used in genetic association studies may vary between populations as has been demonstrated by several reports from different populations and from the HapMap project (Altshuler et al., 2005; Sawyer et al., 2005). So, it is essential to have the normative data on allele, genotype, and haplotype frequencies and LD pattern in the study population prior to association studies. This information can be used to identify a set of redundant single-nucleotide polymorphisms (SNPs) that can be used in an association study. Genetic diversity is seen to a greater extent in the Indian population when compared with most of the geographical territories across the world. Endogamy observed in the South Indian population has been probably a major reason for genetic diversity (Gadgil et al., 1998). It is of interest to study the genetic structure for the existence of novel variations, the allele and genotype frequencies, LD pattern, and haplotype structures in the South Indian population.
The present study was aimed at establishing the allele and genotype frequencies, LD pattern, and haplotype structure of common variant alleles of CYP2C9, CYP2C8, and ADRB1 spanning the “q” arm of chromosome 10. We have also compared the HapMap data from four different populations (Africans [YRI], Chinese [CHB], Japanese [JPT], and European [CEU]) with the present study.
Materials and Methods
Subjects
Two hundred and forty-five unrelated healthy volunteers (88 men and 157 women) between 18 and 45 years of age were selected for the study. They were selected from families who have been residing in South India for at least three generations and speak any one of the four South Indian languages. None of them had diabetes, hypertension, or any other chronic illness. The Institute of Human Ethics Committee approved the study. The volunteers had the study procedure explained in detail and written informed consent was obtained from all the volunteers.
DNA extraction and genotyping
Five milliliters of blood was collected from antecubital vein of the volunteers in polypropylene tubes containing 100 μL of 10% ethylene diamine tetraacetic acid (EDTA) as anticoagulant. Genomic DNA was extracted from the peripheral leukocytes using standard phenol-chloroform method. The DNA extracted was diluted to 50 ng/μL concentration and was stored at −20°C. All the subjects were genotyped for CYP2C8*2 (805A>T, rs11572103) and CYP2C9*2 and *3 (430C>T, rs1799853 and 1075A>C, rs1057910) alleles using a polymerase chain reaction (PCR)-restriction fragment length polymorphism method as described earlier with minor modifications (Sullivan-Klose et al., 1996; Nakajima et al., 2003). The details of the markers/SNPs genotyped and their location are given in Table 1. The PCR-amplified products were checked for amplification in 1% agarose gel and enzyme-digested products were electrophoresed and visualized on 8% and 12% polyacrylamide gels. The details of the primers used for amplification and enzymes used for RFLP analysis are given in Table 2. The volunteers were also genotyped for CYP2C8*3 (1196A>G, rs10509681) and the two common variant alleles of ADRB1 (145A>G, rs1801252 and 1165C>G, rs1801253) by real-time PCR allelic discrimination method. We have used a real-time thermocycler (Applied Biosystems, Foster City, CA) for genotyping. The kits for amplification and allele discrimination were obtained from Applied Biosystems (Assay IDs: C__25625782_20 for 1196 A>G, C__8898494_10 for 145A>G and C__8898508_10 for 1165C>G). Genotype details of the SNPs/markers from the HapMap project, which includes four major populations, that is, CEU, CHB, JPT, and YRI, were obtained from the HapMap project website (www.hapmap.org).
The reference sequence ID: NT_030059.12.
SNP, single-nucleotide polymorphism.
CYP2C9*3 is one of the most important polymorphisms that reduces the enzyme activity by 93%. Here, two primers and their respective restriction enzymes are used to cross-check the genotyping results. Most commonly, two restriction enzymes which cleave the fragments in a different manner. will not be available for the same loci. NsiI enzyme will cut in the presence of the wild-type allele, whereas KpnI enzyme will cut in the presence of mutant allele.
Band patterns observed under ultraviolet light in the presence of wild-type allele.
Band pattern observed under ultraviolet light in the presence of variant allele.
F, forward; R, reverse; bp, base pairs.
Statistical analysis
The genotype frequencies of all SNPs were checked for Hardy-Weinberg equilibrium using Fisher's exact test. The differences in the allelic frequencies among the populations were compared using Fisher's exact test. Pairwise LD pattern and haplotype frequency were estimated using HAPLOVIEW software version 4.1 (Barrett et al., 2005). All the SNPs with minor allele frequencies of < 0.01% were excluded and minimum haplotype frequency was set at 1%. Haplotype blocks were defined using four gametes rule incorporated in Haploview program. Haplotypes were estimated using an accelerated EM algorithm in Haploview. The confidence interval minimum for strong LD was set between 0.7 and 0.98. D′ values from 0.7 to 1 indicate strong LD between a pair of markers, whereas D′ values of < 0.7 indicate moderate LD and D′ values of 0-0.2 indicate no LD.
Results
All the six SNPs selected in three genes (CYP2C8, CYP2C9, and ADRB1) were found to be polymorphic in the study population. Genotype frequencies of all the markers were found to be in Hardy-Weinberg equilibrium. The minor allele frequencies in the South Indian Tamilian population were not similar to population frequencies of the HapMap project. rs1799853, rs1057910, and rs10509681 in the African YRI population; rs1799853, rs10509681, rs11572103, and r1801252 in the Japanese JPT and Chinese CHB populations; and rs11572103 in the CEU population were found to be monomorphic. Interethnic differences in allele frequencies were observed for some of these markers. A significant difference in allele frequencies was observed between the study population and CEU population for rs1799853 and rs10509681 and between the study population and African population for rs11572103, rs1801252, and rs1801253. The detailed allele and genotype frequencies for all the markers in the South Indian population and HapMap populations are given in Table 3. The minor allele frequency of rs1057910 (13.3%) for the GIH population was higher when compared with that of SI, CEU, CHB, JPT, and YRI. On the other hand, the minor allele frequency of rs10509681 (4.8%) for the GIH population was higher than that for SI, but was lower than that for CEU. Further, the construction and comparison of the haplotype structure of the GIH population with the study population was not carried out because the genotype details were available only for rs1057910 and rs10509681 from the HapMap project.
In the CEU population, 13 subjects' genotype details for rs1799853 were not known. In the CHB population, 3 subjects' genotype details for rs1801253 were not known. In the JPT population, 1 and 2 subjects' genotype details for rs1801252 and rs1801253, respectively, were not known. In the YRI population, 3 and 1 subject's genotype details for rs11572103 and rs1801252, respectively, were not known.
Some of the subject's genotype details were not known.
The values are significant (p < 0.05) when compared with that of South Indian population.
CEU, CEPH (Utah residents with ancestry from northern and western Europe); CHB, Han Chinese in Beijing, China; JPT, Japanese in Tokyo, Japan; YRI, Yoruba in Ibadan, Nigeria.
In the South Indian population, a strong LD pattern (D′>0.8) was observed between rs1799853 and rs1057910, rs11572103, and rs1801253 (D′ = 1); rs1057910 and rs10509681 (D′ = 1); rs10509681 and rs11572103 (D′ = 1); and rs1801252 and rs1801253 (D′ = 0.9). In contrast, a moderate to low LD pattern (D′>0.2 to < 0.8) was observed between rs10509681 and rs1801253 (D′ = 0.7), rs1799853 and rs1801252 (D′ = 0.7), rs11572103 and rs1801253 (D′ = 0.6), rs1057910 and rs1801253 (D′ = 0.5), and rs1799853 and rs10509681 (D′ = 0.4). The details of the location of markers on chromosome 10 and their LD pattern in South Indian population are given in Figure 1. In the CHB and JPT populations, the LD pattern observed was contradictory to the LD pattern of the study population. A strong LD (D′ = 1) was observed between rs1057910 and rs1801253 in both CHB and JPT populations, which was found to be low (D′ = 0.5) in the study population. This may be attributed to the absence of variant alleles for rs10509681, rs11572103, and rs1801252 in the CHB and JPT populations and their presence in the South Indian population. The arising of newer variations (rs10509681, rs11572103, and rs1801252)) between rs1057910 and rs1801253 might have affected the LD between them in the South Indian population, as recurrent variations may result in decline of LD. Another reason for decline in LD could be recombination (Daly et al., 2001; Altshuler et al., 2005). In the YRI population, the LD between rs11572103 and rs1801253 was observed to be low (D′ = 0.2). There was a strong LD pattern between rs11572103 and rs1801252 (D′ = 1) and between rs1801252 and rs1801253. The strong LD between rs1799853 and rs1801253 observed in the South Indian population indicates the extension of LD for long distances between the genes, which may be due to low rates of recombination or natural selection (Altshuler et al., 2005). The markers rs11572103 and rs1801252 are polymorphic in the South Indian and YRI populations, but there is a difference in the percentage of the minor allele frequencies between the two populations. In the CHB and JPT populations, both the markers are monomorphic. This variation in frequencies may be due to the restricted cross mating between the populations. In the CEU population, the genotype detail for rs1801252 was not available from the HapMap database. The LD pattern observed among the markers was strong to moderate. The D′ value between rs1799853 and rs10509681 was 0.9, rs1799853 and rs1057910 was 0.8, rs10509681 and rs1801253 was 0.7, and rs1057910 and rs1801253 was 0.4.
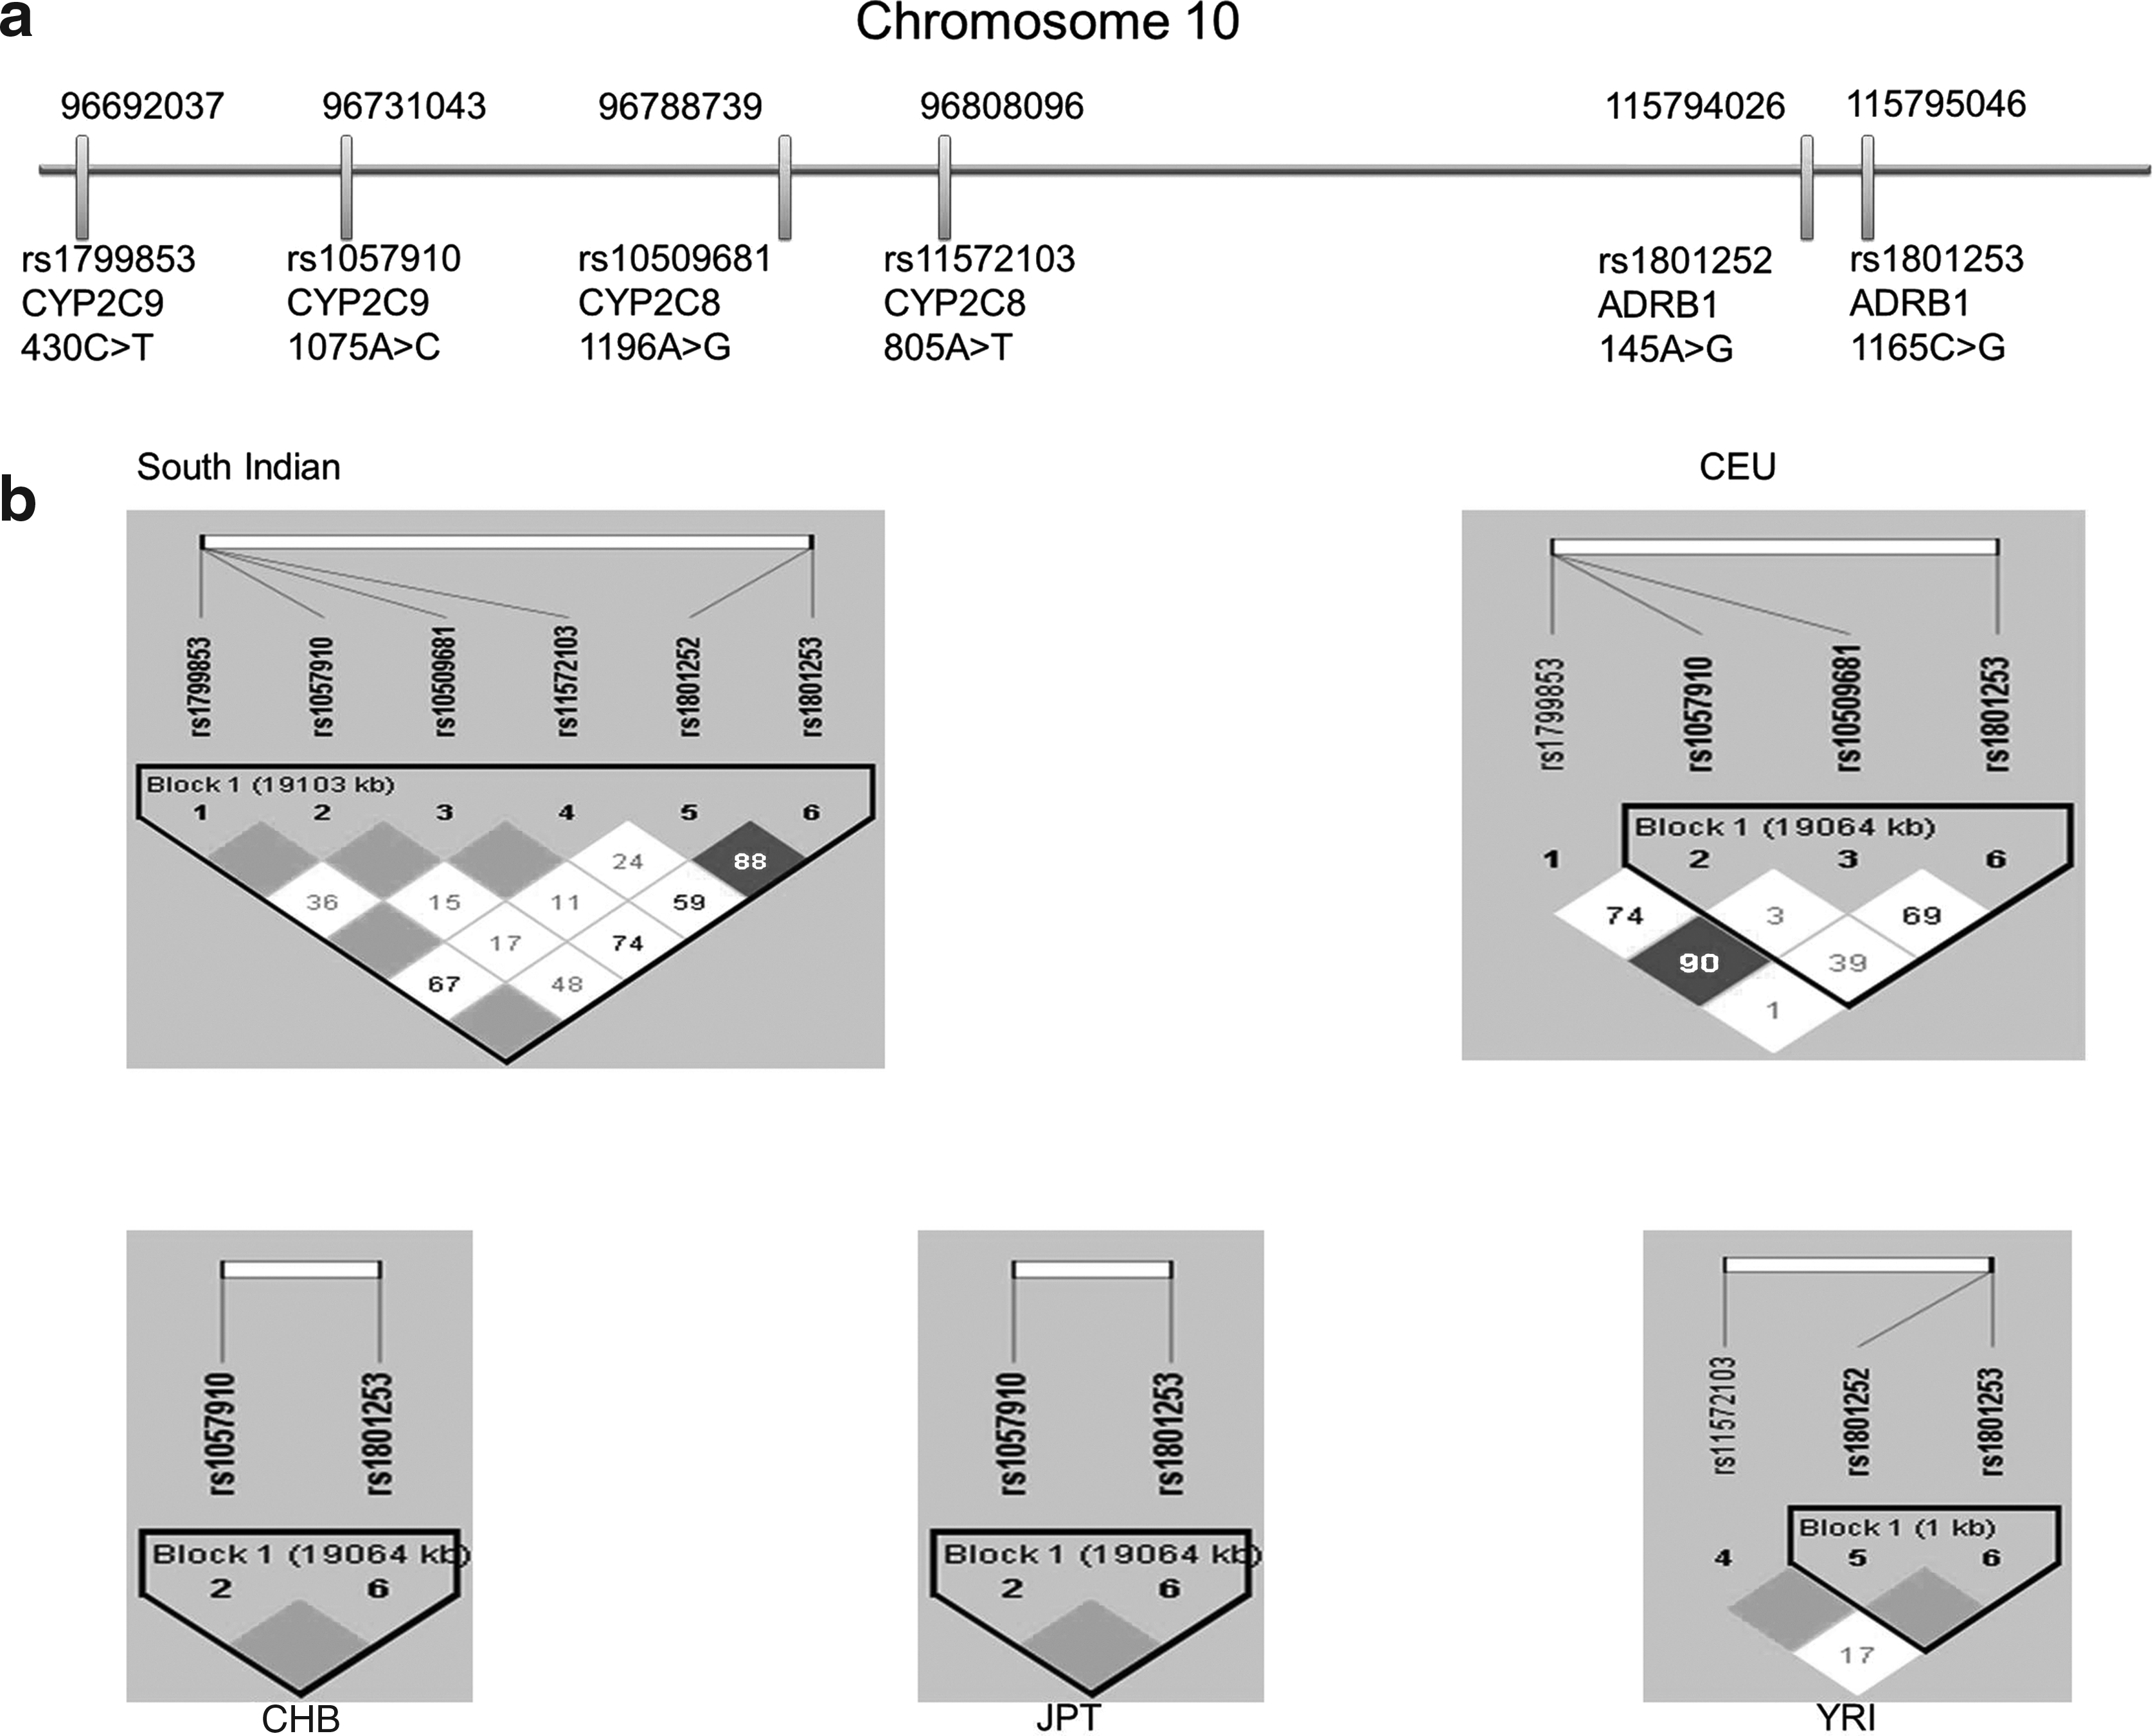
Locations and linkage disequilibrium (LD) patterns of the six markers in a South Indian Tamilian population.
The haplotype structure varied among the populations because of the presence or absence of some variations and the altered allele frequencies. Five different haplotypes (frequency >1%) have been inferred using six markers for the South Indian population. The haplotypes differ from each other at one marker location. The haplotype structures and their frequency in populations are given in Table 4. Interestingly, the haplotype structure HS3 is unique to SI, with a frequency of greater than 12.1% (rs1801252 carrying the variant allele). The rs1801252 minor allele was more common in SI, with a frequency of about 13.9%, whereas it was absent in CHB and JPT and very rare in the YRI population. Therefore, individuals with HS3 haplotype structure in the South Indian population are likely to be more susceptible to risk of cardiovascular diseases compared with other populations (CHB, JPT, YRI).
Variant allele in each haplotype structure.
HS, haplotype structure.
Discussion
As a part of association studies of candidate genes for hypertension and cardiovascular diseases, we have investigated baseline allele frequencies, LD pattern, Hardy-Weinberg equilibrium, and haplotype structures of rs1799853, rs1057910, rs10509681, rs11572103, rs1801252, and rs1801253 on chromosome 10 in a South Indian population. The observed LD pattern, allele and genotype frequencies, and haplotype structures of these common variants in the genes CYP2C8, CYP2C9, and ADRB1 suggest that there exists a significant ethnic difference between the South Indian population and other major ethnic groups, namely African, European, Chinese, and Japanese. This difference reflects the variability in evolution process, time of origin of variations in each population, age of population, extent of admixture, and role of selection pressure on genetic variation. The range of LD in the study population is likely to be due to sampling of gametes to form successive generations (Weir and Hill, 1980). There could have been ancestral recombination between the markers in close proximity. The LD between markers at greater distance may signify a recent positive selection or population bottlenecks. Thus, LD maps may be considered as an important tool for geneticists looking to confirm or exclude candidate SNPs as causative variations (Altshuler et al., 2005).
Studies support the presence of LD between the common polymorphic loci in CYP2C9 and CYP2C8 genes (Yasar et al., 2002; Speed et al., 2009). This may influence the metabolism of common substrates for enzymes such as arachidonic acid (Dai et al., 2001). A Swedish cohort study reported a significant association between CYP2C8*3 and myocardial infarction (Yasar et al., 2003) and the biosynthesis of epoxyeicosatrienoic acid (EET) was found to be significantly reduced in the presence of this polymorphism (Dai et al., 2001). A study conducted in a cohort from Vanderbilt University has suggested that this polymorphism is not associated with the prevalence of hypertension (King et al., 2005). Studies have reported that the important risk factors for the development of coronary heart disease (CHD) clinical events may be influenced by the presence of CYP2C8 variant alleles (Lee et al., 2007). A study conducted in the female Swedish descents has shown association of CYP2C8 and CYP2C9 variants with a modest increase in risk of acute myocardial infarction (AMI) (Yasar et al., 2003). In contrast, the male subjects with CYP2C9 variant alleles were protected against the development of MI in Caucasian population (Funk et al., 2004).
Interethnic differences in response to beta blocker therapy have also been reported. Good response for the beta blockers among the Chinese patients and poor response among the African Americans have been reported (Zhou et al., 1989). There are reports for an internal beta-blocking effect in the subjects carrying a variant allele (G) at the 145th position in ADRB1 gene, who exhibited lower resting heart rates (Beitelshees et al., 2006; Mahesh Kumar et al., 2008). Similarly, subjects with no variation at 1165C>G in ADRB1 have shown increased blood pressure, heart rate, and sensitivity to agonist and antagonist compared with homozygous variant subjects (GG genotype) (Bruck et al., 2005). A positive association of 145A>G and 1165C>G polymorphisms with hypertension, heart and renal failure, and cardiomyopathy was evident from linkage studies (Iwai et al., 2002). In contrast, in the Japanese population, no association has been reported between the polymorphisms and risk of chronic heart failure (Nonen et al., 2005).
These nonreplicable results can be attributed to the genetic heterogeneity in a particular population and historic origin of a population. So, baseline data on genetic variations of functionally important candidate genes is required to initiate genetic studies, especially candidate gene association studies. In a complex disorder, the observed trait may be due to either one of the variant allele or the interaction of variant alleles at all the loci. Predicting disease association is difficult unless the haplotype structures are constructed for all the candidate genes associated with the disease. Identification of haplotype blocks can be useful in planning association studies. This in turn decreases the cost associated with genotyping, without affecting the precision in association studies.
To conclude, the LD pattern and haplotype structures of the studied SNPs on chromosome 10 vary in a South Indian population compared with HapMap populations. The results presented here can be applied in future for SNP or haplotype association analysis in a South Indian population. The results may aid in confirming or excluding potential polymorphisms as causative variants for candidate gene association studies, especially for coronary artery diseases. In addition, knowledge of specific LD information among markers will help to understand evolution and population history.
Footnotes
Acknowledgments
This study was financially supported by Department of Science and Technology, Government of India. The authors thank M. Aarthi (Ph.D. research scholar) and Drs. S. Jayanthi and Shahid Akhtar (senior residents), Department of Pharmacology, JIPMER, for proofreading the manuscript.
Disclosure Statement
No competing financial interests exist.