
Abstract
Aim: Although much of Jordan is covered by desert, its north-western region forms part of the Fertile Crescent region that had given a rich past to Jordanians. This past, scarcely described by historians, is not yet clarified by sufficient genetic data. Thus in this paper we aim to determine the genetic differentiation of the Jordanian population and to discuss its origin. Methods: A total of 150 unrelated healthy Jordanians were investigated for ten Alu insertion polymorphisms. Genetic relationships among populations were estimated by a principal component (PC) plot based on the analyses of the R-matrix software. Results: Statistical analysis showed that the Jordanian population is not significantly different from the United Arab Emirates population or the North Africans. This observation, well represented in PC plot, suggests a common origin of these populations belonging respectively to ancient Mesopotamia, Arabia, and North Africa. Conclusion: Our results are compatible with ancient peoples' movements from Arabia to ancient Mesopotamia and North Africa as proposed by historians and supported by previous genetic results. The original genetic profile of the Jordanian population, very likely Arabian Semitic, has not been subject to significant change despite the succession of several civilizations.
Introduction
J
From all these successions and crossroads of multiple civilizations, a native Nabatean civilization emerged. The capital of the kingdom of this civilization, now known as Petra in Jordan reached its peak of resplendence between 400 BC and 160 AD. In fact, in this capital, Nabateans left rich archaeological remains and some inventions, the most important of which are the current Arabic alphabets. Nabateans (Arabic: Al-Anbāṭ) are considered to be an ancient Semitic Arab people who occupied southern Jordan, Canaan, and the northern part of Arabia. After this native Nabatean civilization, the population composition of Jordan could have received a slight Western contribution during the Macedonian, Roman, Byzantine, and Ottoman Turkish empires. However, since the seventh century, the population was relatively stabilized and the area has been under Muslim and Arab culture (for review see Schmid, 2001).
The rich archaeological and historical past of Jordan has led us to consider an anthropological study based on genetic data to determine the genetic position of the Jordanian population and to discuss its origin. To do this we have selected Alu insertion markers because they have low mutation rate and known ancestral state, they are apparently selectively neutral, and do not appear to be subject to loss or rearrangement (Batzer et al., 1994; Lander et al., 2001; Batzer and Deininger, 2002). The potential usefulness of specific Alu loci as ancestry informative markers has been explored for detecting differences between populations and to estimate biogeographical ancestry (Luizon et al., 2008; Terreros et al., 2009). For these reasons, polymorphic Alu insertions were used in several studies tackling many historical and demographical questions (e.g., Terreros et al., 2009; El Moncer et al., 2010; González-Pérez et al., 2010).
Materials and Methods
A total of 150 Jordanian samples were collected from different regions of the North-Center of Jordan, particularly from Irbid located in the north. All sampled individuals were unrelated healthy donors who signed an informed consent approved by the ethical committees of the universities involved in the study.
Genomic DNA was extracted from blood cells by standard phenol-chloroform techniques. Ten Alu insertions (ACE, TPA25, APO-AI, PV92, D1, FXIIIB, A25, B65, HS4.32, and Yb8NBC120) located on eight different chromosomes (n° 1, 3, 8, 11, 12, 16, 17, and 22) were typed by PCR amplification. The primers and amplification conditions were previously described (Batzer and Deininger, 1991; Stoneking et al., 1997; González-Pérez et al., 2010). Positive and negative controls for the polymorphisms examined were included in all PCR runs.
Allele frequencies were estimated by direct counting. Hardy-Weinberg equilibrium was assessed by an exact test (Guo and Thompson, 1992). Heterozygosity values by locus and population were calculated according to M. Nei's formula (Saitou and Nei, 1987). Population comparisons (exact test of population differentiation) and hierarchical analyses of molecular variance (AMOVA) were estimated using the Arlequin v 3.0 package (Schneider et al., 2000).
As for the AMOVA analyses, the FCT and FST values obtained for each locus and for the different geographical partitions were averaged to obtain a global value. The resulting average probability was calculated by combining probabilities from independent tests of significance (Sokal and Rohlf, 1997). Genetic relationships among populations were estimated by a principal component (PC) plot based on the analyses of the R-matrix software (Harpending and Jenkins, 1973). Levels of genetic admixture were evaluated by means of different estimators implemented in the LEADMIX program (Wang, 2003).
Fourteen populations were considered for comparative analyses. They are presented according to their geographic location in Figure 1. Their corresponding Alu insertion frequencies were obtained from studies already published (Stoneking et al., 1997; Bahri et al., 2008; El Moncer et al., 2010; González-Pérez et al., 2010).
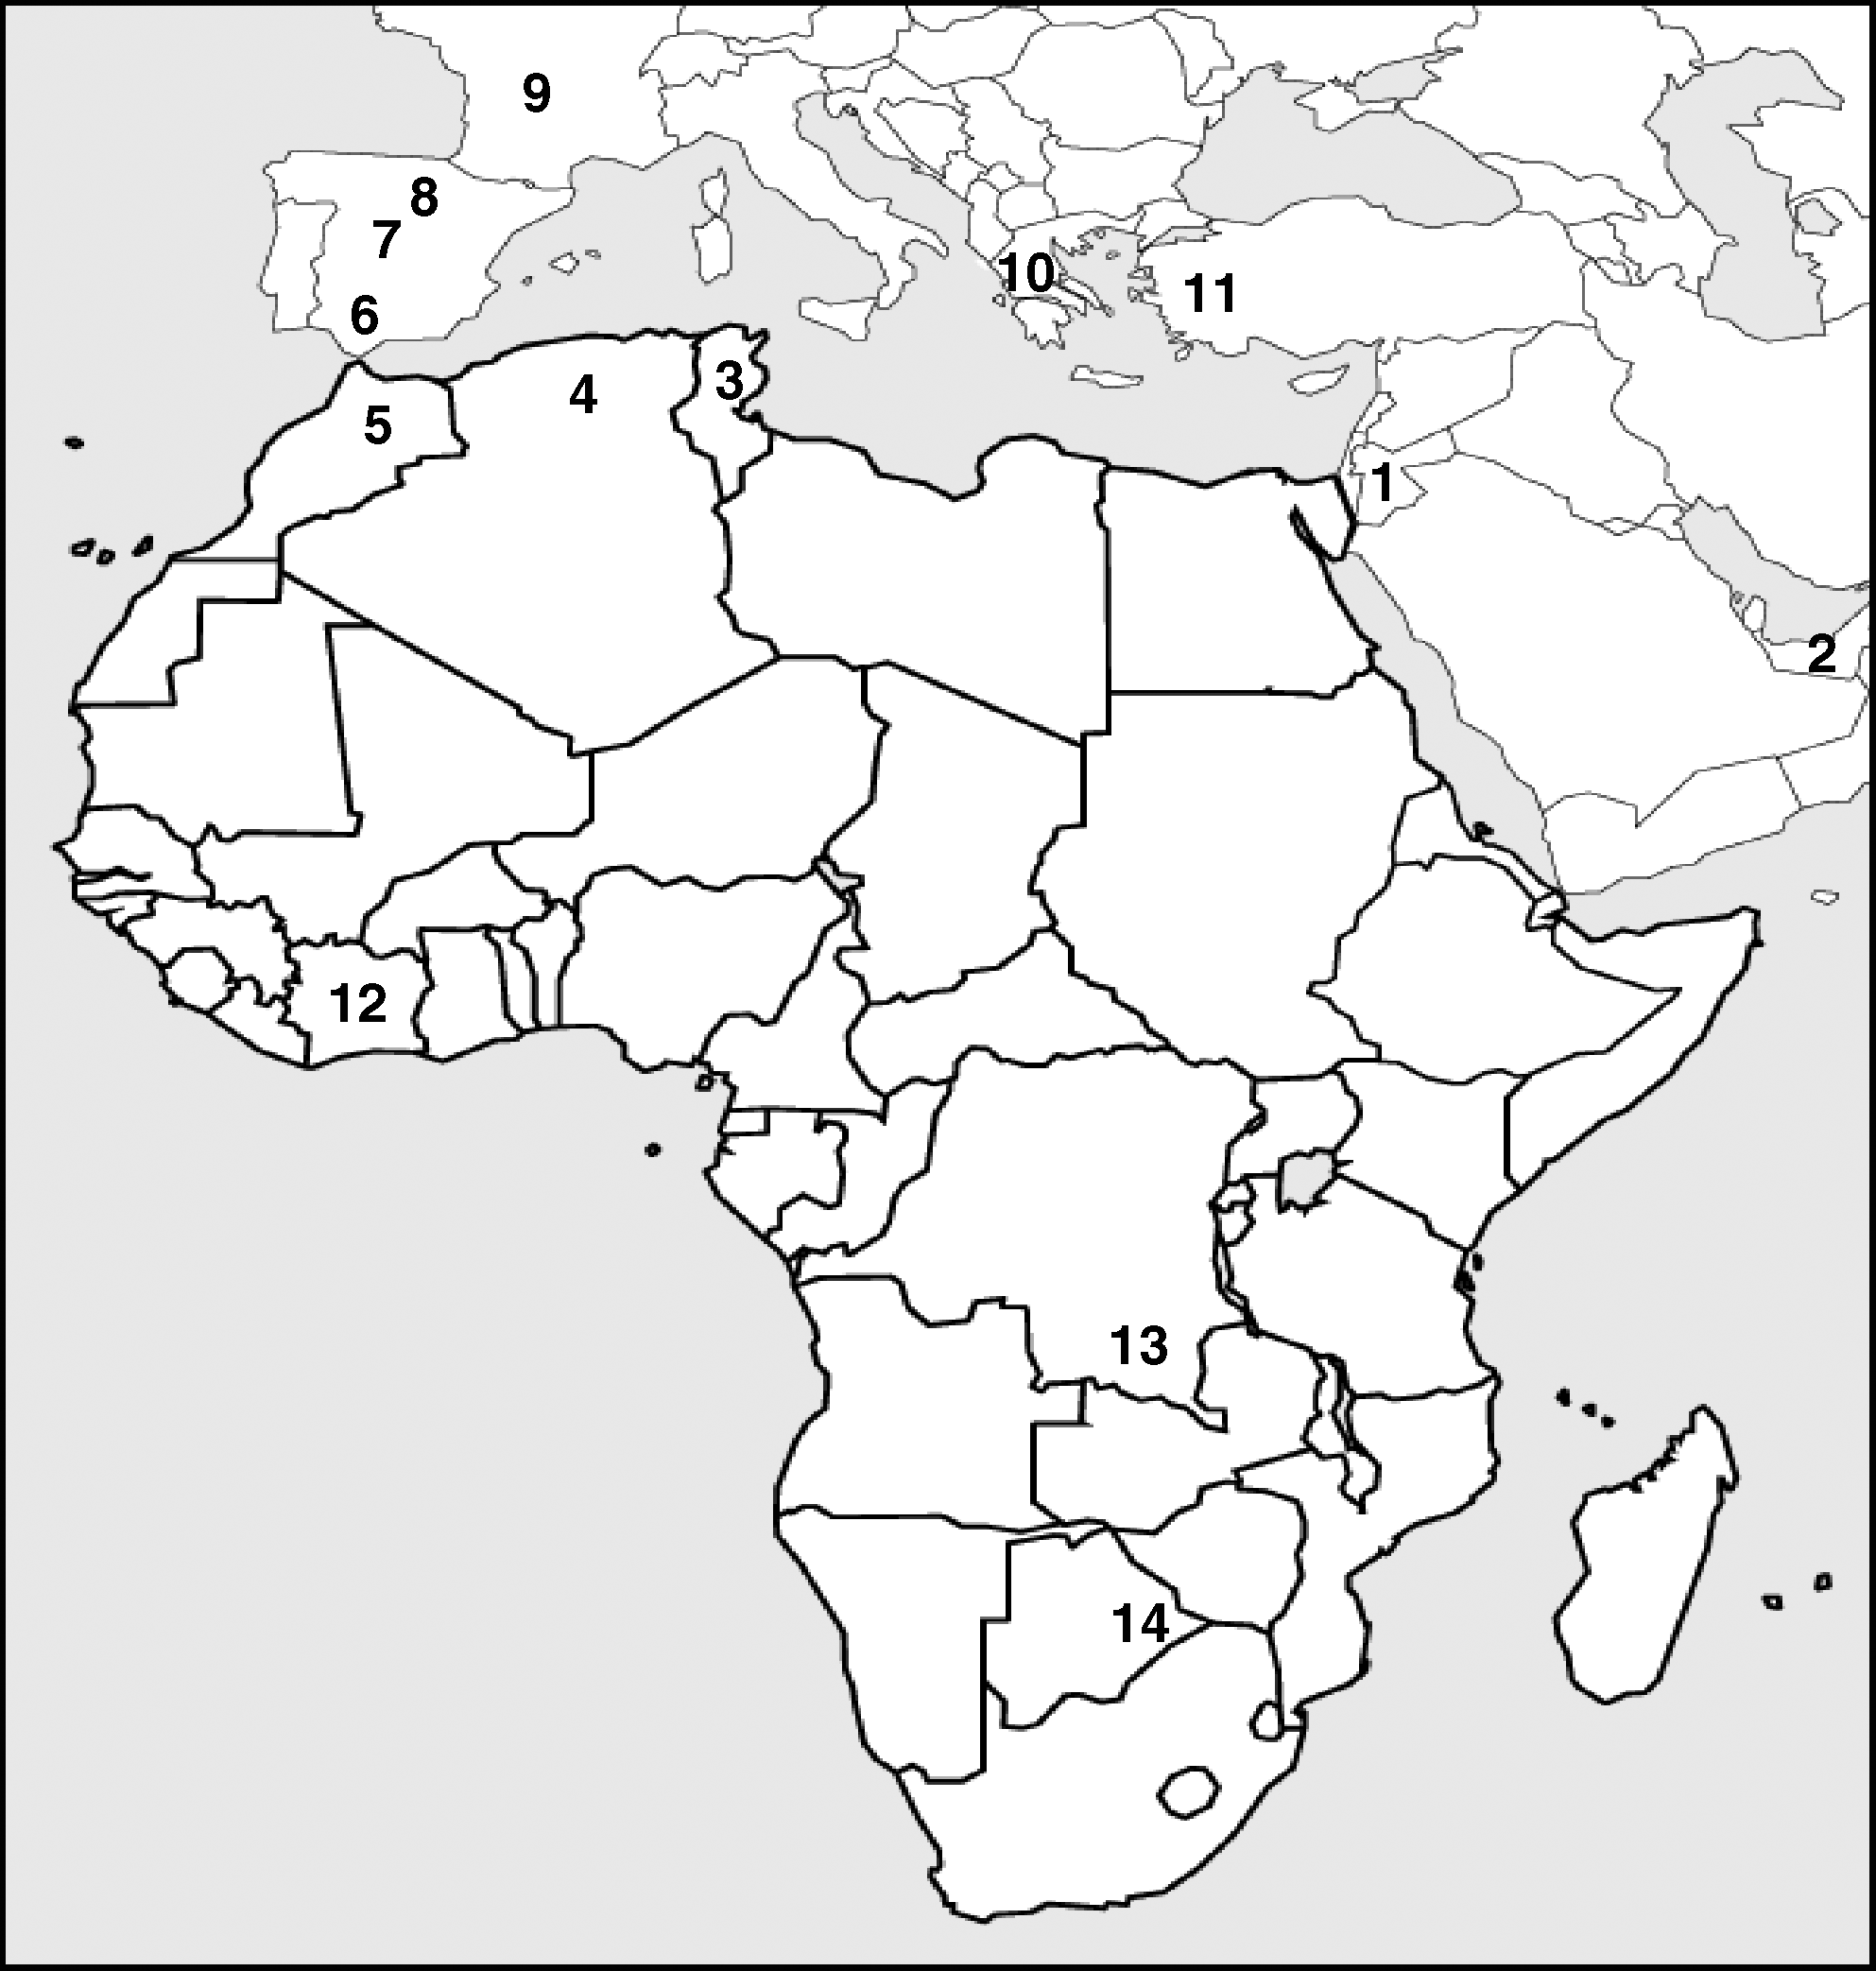
Geographical location of the Jordanian population and populations included in comparison analyses. 1, Jordan (present study); 2, United Arab Emirates; 13, Kung and; 14, Sotho (Stoneking et al., 1997); 3, Tunisia (Bahri et al., 2008; El Moncer et al., 2010); 4, Algeria; 5, Morocco, samples from Middle and North-East Atlas Berbers; 6, South Spain; 7, Center Spain; 8, North Spain; 9, France; 10, Greece; 11, Turkey and; 12, Ivory Coast (González-Pérez et al., 2010).
Results
Alu insertion frequencies and gene diversities of the ten loci determined in the Jordanian sample are shown in Table 1. Variation ranges obtained using previously published data on other populations are also shown in the table. No significant deviations from Hardy-Weinberg equilibrium have been found after Bonferroni correction. The highest allele frequency corresponds to the APO-AI locus (0.935) whereas the lowest frequency has been observed for the A25 locus (0.096).
As expected, the lowest gene diversity values correspond to loci with frequencies close to 0 and 1, such as the case of A25 (H=0.174) and APO-AI (H=0.121) respectively. The highest values correspond to loci having frequencies close to 0.5, such as the case of Yb8NBC120 (H=0.501), B65 (H=0.501), and TPA25 (H=0.499). Average genetic diversity has a value of 0.400±0.137. In general, our frequencies and gene diversities have intermediate values within the variation ranges of other Mediterranean populations except for the frequency of Yb8NBC120 and the gene diversities of PV92 and Yb8NBC120 that show the highest values (Table 1).
No significant differences (p=0.562) were detected among our Jordanian sample and North Africans (from Tunisia, Algeria, and Morocco). No significant differences (p=0.294) were detected between North African populations either. A slightly significant difference (p=0.021) has been noted between Jordanian and the southern European populations (7 significant cases out of a total of 60 tests). We have also included in our comparisons the United Arab Emirates population from Arabia and 3 sub-Saharan populations studied for only 8 of the 10 loci analyzed in the present study. In this case, the exact test showed that the difference between the UAE and Jordanian populations is not significant (p=0.482) (only the D1 Alu locus was significant). No significant difference (p=0.104) was observed between the UAE and North African populations either. However, a remarkably significant difference has been noted between Jordanian populations and sub-Saharan Africans (p<0.0001).
In order to estimate the genetic position of the Jordanian population within 9 Mediterranean populations (6 Europeans and 3 North Africans), a PC analysis was conducted (Fig. 2). The two first axes accounted for 71.07% of the total genetic variance. Generally these populations clustered according to the principal large geographic areas. The first axis (with a 37.81% of the total variance), clearly separates the European populations from North Africans and Jordanians. The second axis which explains 33.26% of the total variance separates Jordanians from North Africans: although Algerians seems clustered with Jordanians, they are closer to the other North Africans.
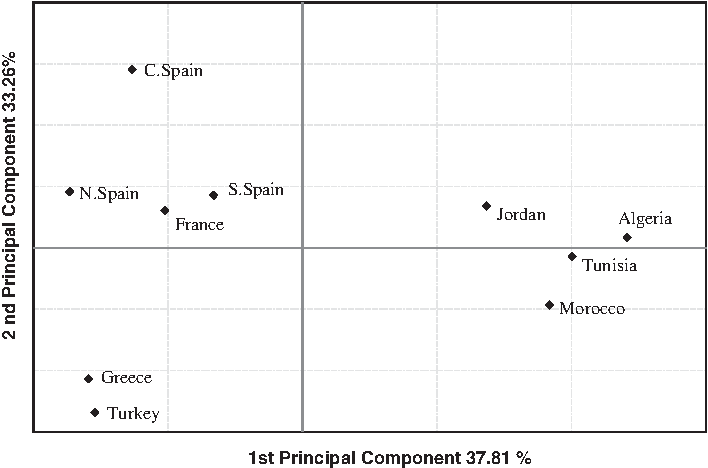
PC plot based on the variation of ten Alu insertions polymorphisms. PC, principal component.
In order to add UAE population from Arabia in the analysis, only eight Alu loci were considered in a second PC plot (Fig. 3). The population distribution along axes matches up with the relationship suggested by the first PC plot (Fig. 2). European populations and the rest of populations are clearly separated along the first axis (with a 45.25% of total variance). North Africans on the one hand and Middle Eastern populations on the other hand are spread along the second axis, which explains 22.77% of the total variance. In a third PC plot (Fig. 4) we add three populations from sub-Saharan Africa. This wider analysis agrees with the precedents, and strongly reflects the population comparison tests indicated above: Sub-Saharan African populations and the rest of populations are clearly separated along the first axis (with a 60.07% of total variance). European populations on the one hand and North Africans and Middle Eastern populations on the other hand are spread along the second axis which explains 22.60% of the total variance.
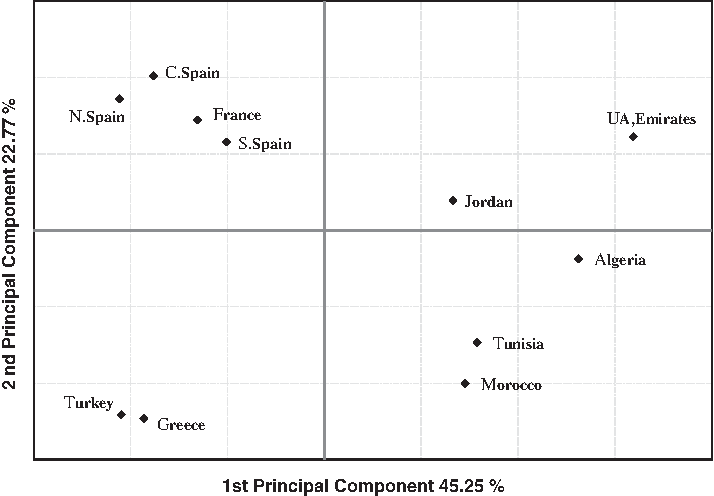
PC plot based on the variation of eight Alu insertions polymorphisms in populations from the Mediterranean and the Middle East.

PC plot based on the variation of eight Alu insertions polymorphisms in populations from the Mediterranean, the Middle East and sub-Saharan Africa.
To evaluate the genetic differentiation attributable to the European population group (6 samples) and that of North Africans and Middle-East populations (5 samples) we conducted a set of hierarchical AMOVA. The overall genetic heterogeneity among these two groups is statistically significant (FCT=1.45%, p<0.001; FST=1.78%, p<0.001). This genetic heterogeneity, although it remains statistically significant, becomes less important (FCT=0.94, p=0.026 and FST=1.47, p<0.001) when the Middle-Eastern and European populations are grouped together and compared with North Africans.
Discussion
This study provides for the first time a genetic analysis of a representative population sample (n=150) from the North-Center of Jordan using 10 Alu insertions. The genetic position of the Jordanian population is recapitulated in the third PC plot (Fig. 4) which strongly reflects the population comparison tests. The sub-Saharan African populations, showing a remarkably significant difference from the Jordanian population, are the most differentiated from all other populations included in this PC plot. Similar observations were noted in several studies using different genetic markers (e.g., Hammer et al., 1998; Chaabani et al., 2000; Terreros et al., 2009). The difference between southern Europeans and Jordanians is slightly significant (p=0.021), reflecting a geographic and genetic continuum for Alu markers of Jordanian population and populations of southern Europe. Similar results were found using mitochondrial DNA and Y-chromosome markers, the analyses of which showed that the general Jordanian population is not significantly different from their Levantine neighbors and fit consistently into a Middle East-Anatolia-Balkan-Caucasus geographic and genetic continuum (Flores et al., 2005; Gonzalez et al., 2008).
No significant difference was obtained between North African populations. This genetic homogeneity among North Africans was provided in previous studies showing that no significant genetic differences were found among them when samples representative of wide areas were considered, regardless of their current linguistic status (Bahri et al., 2008; El Moncer et al., 2010). Besides, no significant difference was noted between the Jordanian population, that from UAE (p=0.341) and those from North Africa (p=0.604). This evident genetic closeness, well represented in the third PC plot (Fig. 4), suggests a common genetic background among populations from Arabia such as UAE, those from ancient Mesopotamia such as Jordan, and those from North Africa. In this way, we have tested the contribution of “Arabian” genes in the genetic background of the current Jordanian population, taking as parental populations the samples from UAE and Morocco, and considering information from 8 Alu loci. As expected from the genetic similarity between parental samples, only the Long and Chakraborty estimator gave a statistically consistent result: the genetic contribution of the Arabian sample in Jordan was 36.5% (95% CI: 0.193-0.780). These results could be in accordance with the seventh century historic event of the Arab expansion from Arabia toward ancient Mesopotamia and North Africa and particularly with more ancient people movements that took place in the same two major directions. In fact, many historians and scholars (Barrou, 1982; Goodspeed, 2007) propose ancient movement of populations out of Arabia toward the north and derive the entire populations of the ancient Mesopotamia from those of Arabia; although others proposed, in addition, other movements from Yemen to North Africa (Nadhouri, 1981).
That these ancient people movements happened in these two major directions were supported by genetic data. They were first proposed in an evolutionary analysis of GM and immunoglobulin Cγ gene haplotypes (Chaabani, 2002). They are consistent with more recent genetic results such as (1) the distribution of the Y-chromosome J1-M267 haplogroup that reveals a decreasing frequency moving from southern Arabia (72.6%) to the north toward ancient Mesopotamia (58.3% in Qatar and 34.8% in UAE), and to North Africa (35.0% in Algeria and 30.1% in Tunisia) (Cadenas et al., 2007); (2) the distribution of the Y-chromosome haplogroup JIc3 (P58), formerly J1e, which is most frequent in Yemen-Saudi (65%) and less frequent toward the north in ancient Mesopotamian countries such as Syria (30%), Lebanon (25%), or in a second direction toward sub-Saharan Africa such as Ethiopia (33.3%) for spreading later to North Africa (as identified by the motif YCAIIa22-YCAIIb22; Algerians 35.0%, Tunisians 31%) (Semino et al., 2004; Chiaroni et al., 2010); and (3) mitochondrial DNA analysis that showed a highest frequency of the haplogroup R0a on Yemen to decrease in all directions, particularly in the two major directions toward the north of the Arabian peninsula and toward Africa via Bab el-Mandab (Cerny et al., 2011). Additionally in this latest study, the date of these ancient people movements is estimated with the involvement of archaeological and paleoclimatic data from about 20,000 years ago. Thus these population movements, accomplished in two major directions, very likely preceded the Neolithic that became the corridor for migrations from the Fertile Crescent in the Middle East (ancient Mesopotamia) to Europe and North Africa (Cavalli-Sforza, 1997; Arredi et al., 2004; El-Sibai et al., 2009). The highest degree of homogeneity noted between the current Jordanian population and North Africans could reflect this additional Neolithic gene flow from ancient Mesopotamia to North Africa.
In conclusion, we note that the ancient people movements from Arabia to ancient Mesopotamia and North Africa proposed by many historians and supported by concordant and complementary results of different nuclear and mitochondrial DNA are also compatible with our results suggesting a common genetic background between populations from Arabia, from ancient Mesopotamia, and from North Africa. Besides, our results showed a highest degree of genetic homogeneity between the current Jordanian population and North Africans which is in accordance with an additional Neolithic gene flow from ancient Mesopotamia to North Africa. On the basis of all historic data, our results and other genetic data quoted above, it seems that ancestors of Jordanians represented a Semitic composition founded from early Semitic peoples such as the Semitic Amorites and Canaanites. This composition was probably influenced by civilizations possessing political sovereignty in Jordan during later periods. But the evident genetic closeness between current Jordanian population and that of the UAE from Arabia suggests that this influence, coming mainly from neighboring populations often having Semitic similar genetic profiles, was very likely insignificant.
Footnotes
Acknowledgment
We gratefully acknowledge blood donors. This research has been supported by the Tunisian Ministry of Higher Education within the research unity 05/UR/09-04.
Disclosure Statement
No authors have any conflicts of interest.