




Abstract
Background: Balancing the subject composition of case and control groups to create homogenous ancestries between each group is essential for medical association studies. Methods: We explored the applicability of single-tube 34-plex ancestry informative markers (AIM) single nucleotide polymorphisms (SNPs) to estimate the African Component of Ancestry (ACA) to design a future case-control association study of a Brazilian urban sample. Results: One hundred eighty individuals (107 case group; 73 control group) self-described as white, brown-intermediate or black were selected. The proportions of the relative contribution of a variable number of ancestral population components were similar between case and control groups. Moreover, the case and control groups demonstrated similar distributions for ACA <0.25 and >0.50 categories. Notably a high number of outlier values (23 samples) were observed among individuals with ACA <0.25. These individuals presented a high probability of Native American and East Asian ancestral components; however, no individuals originally giving these self-described ancestries were observed in this study. Conclusions: The strategy proposed for the assessment of ancestry and adjustment of case and control groups for an association study is an important step for the proper construction of the study, particularly when subjects are taken from a complex urban population. This can be achieved using a straight forward multiplexed AIM-SNPs assay of highly discriminatory ancestry markers.
Introduction
B
Nowadays according to the last IBGE census database (IBGE Web site; www.ibge.gov.br/home/estatistica/populacao/censo2006), 49.8% of Brazilians described themselves by a simple skin color designation as white; 43.2% as brown-intermediate; 6.3% as black; and 0.7% as other categories, such as Amerindian/Native American or East Asian origin. However as a consequence of extensive admixture over the last five centuries ethnic/racial/color categories are poor descriptors of the genetic diversity among modern Brazilian populations (Suarez-Kurtz et al., 2007a). Therefore ancestral origin represents a major potential confounding factor in population-based (e.g., case-control)genetic association studies. The problem arises if case and control groups have different proportions of ancestry in addition to the phenotypes of interest such as disease risk, drug response, or drug metabolism, especially when the phenotypes themselves differ markedly in frequency among populations from diverse ancestral origins (Pritchard and Rosenberg, 1999; Enoch et al., 2006).
A Brazilian pharmacogenomics study showed that the CYP3A5*3A allele is associated with reduced cholesterol-lowering response to atorvastatin in non-African individuals from the most populous city in Brazil, Sao Paulo (South-Eastern region) (Willrich et al., 2008). Another study suggested that the ACE indel polymorphism is associated with hypertension, and the APOB EcoRI single nucleotide polymorphism (SNP) is associated with low-density lipoprotein cholesterol level in Afro-Brazilians (Sakuma et al., 2004). However, these studies classified the ancestral origin of individuals by self-description of skin color, and are likely to lack precise estimates of the ancestral composition of the case and control groups in each study.
Autosomal polymorphisms have emerged as valuable ancestry-informative markers (Price et al., 2007) due to their stability, density of distribution, and full range of allele frequency patterns among populations (Phillips et al., 2007). This approach was recently used to evaluate the ancestral components related with SLCO1B1 c.463C>A variants in a Brazilian sample using a single-tube 34-plex assay of ancestry informative markers (AIM), SNPs, to obtain estimates of the African Component of Ancestry (ACA) and then classify the population sample into quartiles. Consequently c.463C>A SNP showed a trend for decreasing the frequency of c.463A variant from low ACA values (<25%) to high ACA values (<75%) (Rodrigues et al., 2011). Estimation of the ACA is especially important in case-control association studies of subjects from heterogeneous populations where it may be necessary to correct for stratification within one or both study groups by removing some outliers or creating subgroups with equivalent ancestry component frequencies (Zembrzuski et al., 2006).
Phillips and colleagues developed an efficient and practical single-tube 34-plex AIM-SNPs assay for the assignment of ancestral origin by selecting markers with highly contrasting allele frequency distributions among the major population groups: European, African, East Asian, and native Amerindian (Phillips et al., 2007). We have explored the ancestral origin and ACA classification of individuals self-declared from Sao Paulo City using the 34-plex AIM-SNPs assay to evaluate the relative contribution of ancestral origin in a typical case-control association study.
Materials and Methods
Population samples
Peripheral blood samples of 180 Brazilian volunteers who are permanent inhabitants in Sao Paulo city, Brazil (BRA) were randomly selected at the University Hospital, University of Sao Paulo. These individuals were grouped as hypercholesterolemic (case group, n=107) and normolipidemic (control group, n=73), as previously reported (Genvigir et al., 2008). In all cases informed consent was obtained. The ancestry of individuals was attributed according to the self-description of skin color, as reported by the most recent Brazilian IBGE consensus (IBGE Web site). Anthropometric, demographic, and clinical results of the studied group are shown in Supplementary Table S1 in online Supplementary Data; Supplementary Data are available online at www.liebertonline.com/gtmb. As expected, concentrations of serum lipids were higher in case than in control patients (p<0.001), with the exception of high-density lipoprotein cholesterol and apoAI that were not significantly different between these two groups (Supplementary Table S1). The apoB/apoAI in the control group was lower than in case patients (p<0.001).
We used genotype data from the H971 CEPH Human Genome Diversity Panel (HGDP-CEPH) comprising 1265 individuals from 51 geographically diverse populations using the SPSmart SNP browser (http://spsmart.cesga.es) to test the ancestral classification performance of the BRA sample. This panel represents African (AFR), East Asian (E ASN), European (EUR), and American populations (AME). There are also individuals from the Middle East and Central South Asia (mainly N Pakistan) who are usually included with Europeans in a transcontinental Eurasian meta-population (Cann et al., 2002).
SNPs genotyping assay
The DNA was isolated from peripheral blood leukocytes by a salting-out method (Salazar et al., 1998). SNPs were genotyped by multiplex-PCR followed by 34-plex SNaPshot® primer extension reactions (Applied Biosystems, Foster City, CA). Extension products were separated by capillary electrophoresis (3130 Analyzer; Applied Biosystems) and POP6™ polymer. Details of the SNPlex (primers, reactions, cycling, and extension product sizes) were described elsewhere (Phillips et al., 2007).
Data and statistical analyses
BRA and CEPH-HGDP AIM-SNPs were simultaneously analyzed using the estimated relative contribution of a variable number of ancestral population STRUCTURE v.2.2 (Pritchard and Rosenberg, 1999) based on a maximum likelihood approach to assigning group membership of unknown samples together with reference samples of confirmed ancestry. The multi-local genotypes were used to allocate ancestry proportions of the sample populations in different clusters. Runs consisted of 200,000 Markov Chain Monte Carlo steps after a burn-in of length 200,000; analyses performed with K varying between 2 and 6. When all individuals of CEPH-HGDP panel were grouped together, the likelihood values demonstrated that the population structure of the group was explained by four distinct clusters (K=4; ln Prob=−38529.5). Therefore this structure was used to evaluate the ancestral component of BRA and its behavior according to the distribution of references populations from CEPH-HGDP.
The ACA of the BRA sample was estimated and categorized into four ancestral categories (<0.25; 0.25-0.50; 0.50-0.75;>0.75) according to the relative contribution of a variable number of African ancestral population and compared with the self-description of skin color (Suarez-Kurtz et al., 2007b).
Principal components analysis (PCA) was performed using Partek Genomics Suite software v.6.3 (Partek, St. Louis, MO) after data transformation by SNPassoc software v.1.5-3 (Gonzalez et al., 2007). Statistical analyses were carried out using SPSS v.15.0 software (SPSS Inc., Madrid, Spain). The distribution of ancestral components of the contributing population groups was evaluated by χ2 and t-tests. The outlier individuals were detected by the Tukey test with the criterion for significance set at p<0.05 throughout to ensure homogeneity between case and control group according to the ancestral population.
Results
Population-clustering classification
Table 1 shows the membership of Brazilian and reference populations to the distinct clusters estimated by STRUCTURE analysis. The highest membership values were as follows: cluster 1—EUR (0.95±0.07); cluster 2—AFR (0.90±0.11); cluster 3—AME (0.73±0.33); and cluster 4—E ASN (0.91±0.12). The BRA sample was predominantly grouped in clusters 1 (EUR: 0.58±0.32) and 2 (AFR: 0.29±0.29). Much lower membership values for clusters 3 (AME: 0.07±0.10) and 4 (E ASN: 0.05±0.09) strongly suggest that these two ancestral components are minor contributions of the BRA sample used in this study.
Values are presented as mean±SD. In bold the high value of distribution observed in each four-cluster grouping.
p<0.001 comparing BRA with each reference population using t-test.
AFR, African; AME, Amerindian; E ASN, East Asian; BRA, Brazilian; EUR, European.
The triangle plot representations of the ancestry assignment probability from the 34 SNPs in the reference and study populations are shown in Figure 1A. Brazilian ancestry assignment data are dispersed between African and European extremities, with Europe the dominant ancestry component. The PCA results shown in Supplementary Figure S1 confirmed that this Brazilian sample is dispersedly plotted between EUR and AFR populations demonstrating recent active population admixture.
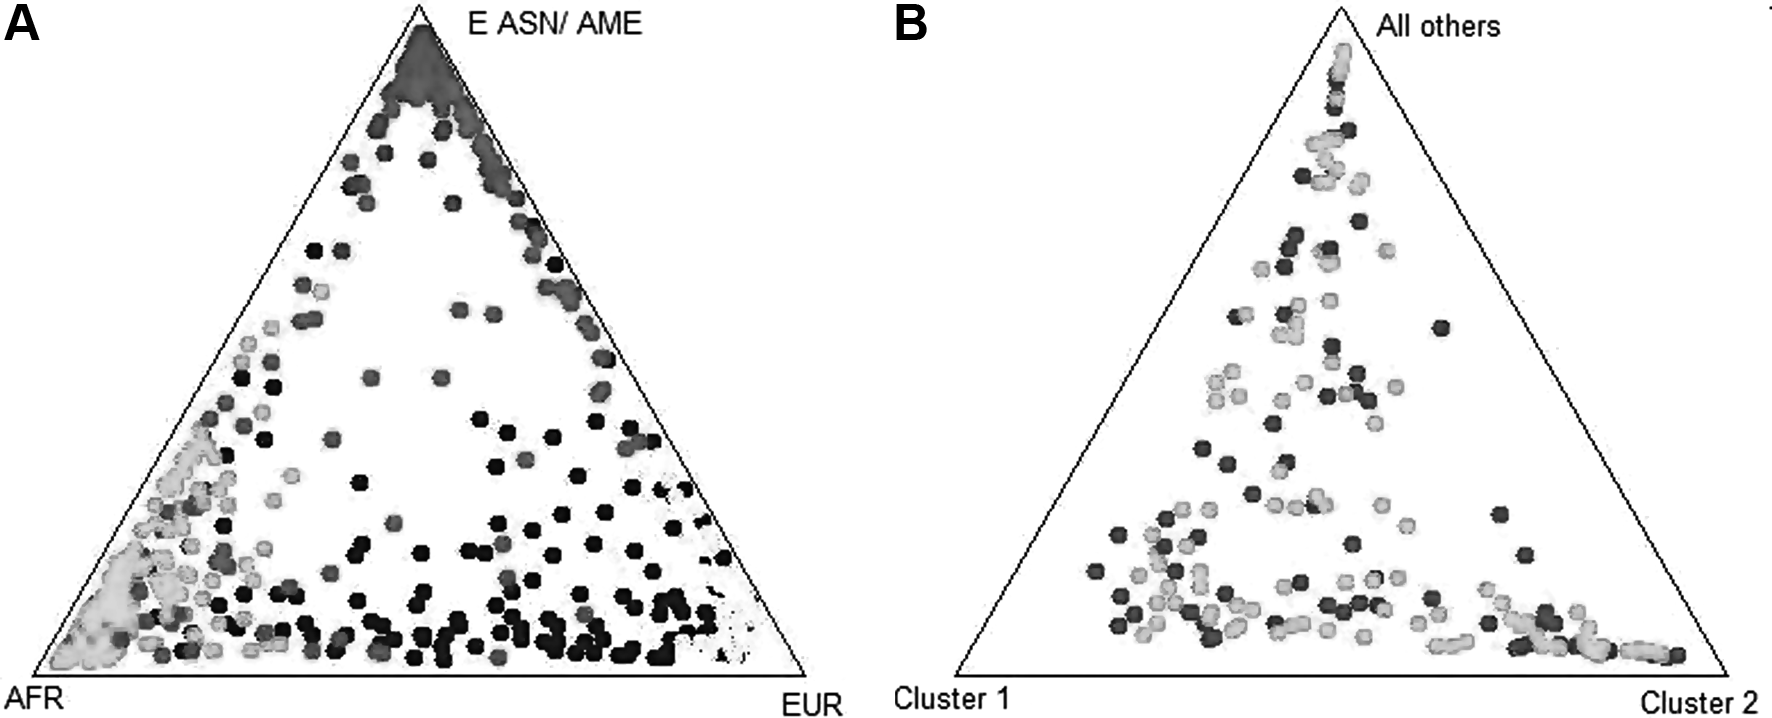
Case and controls groups presented similar distributions in EUR (cases: 0.59±0.33; controls: 0.58±0.32), AFR (cases: 0.28±0.29; controls: 0.31±0.29), AME (cases: 0.09±0.13; controls: 0.06±0.08) and E ASN (cases: 0.05±0.09; controls: 0.05±0.09) ancestral clusters (Table 1). The triangular plot representations of identified population stratification in this case-control study are outlined in Figure 1B.
Self-categorization and ACA
In this study 62.8% of the BRA individuals self-declared as white (n=113), 13.9% as brown-intermediate (n=25), and 18.9% as black (n=34). Eight individuals declined to describe their skin color (4.4%), and individuals self-declared as Asian or Amerindian/native American was not observed.
The individual ACA values across the study population ranged from 0.003 to 0.99. ACA mean values in self-reported white, brown-intermediate, and black subjects were, respectively, 0.15±0.19, 0.40±0.15 and 0.69±0.24. The distributions of ACA categories indicate that ACA <0.25 was found in 0.81 of white BRA individuals, ACA of 0.25-0.50 was found in 0.82 brown-intermediate individuals, and ACA >0.50 was present in 0.82 of black individuals (Table 2). The frequencies of individuals in ACA categories were similar between case and control groups (χ2=4.712, 3 degrees of freedom, p=0.19) (Table 2).
Number of individuals in parenthesis.
Frequencies of ACA categories between case and control groups were similar (χ2=4.712, 3 degrees of freedom, p=0.19).
ACA, African Component of Ancestry; W, White; BI, Brown-Intermediate; BL, Black; ND, no-declared.
The PCA plot also showed similar distribution of ancestral components between case and control groups, and inside of each ACA category was observed a homogenous distribution (Fig. 2).

Three-dimensional PCA plot of 34-plex single nucleotide polymorphisms from the BRA case group (n=107—octahedron) and BRA control group (n=73—sphere) according to the ACA categories. ACA estimated by a relative contribution of African ancestral component. ACA, African Component of Ancestry; PCA, Principal components analysis.
Outlier analysis
The Tukey box plot (Fig. 3) was applied to compare proportions of ancestral components in the BRA sample among the ACA categories to ensure homogeneity and detect individual outliers showing extreme values.
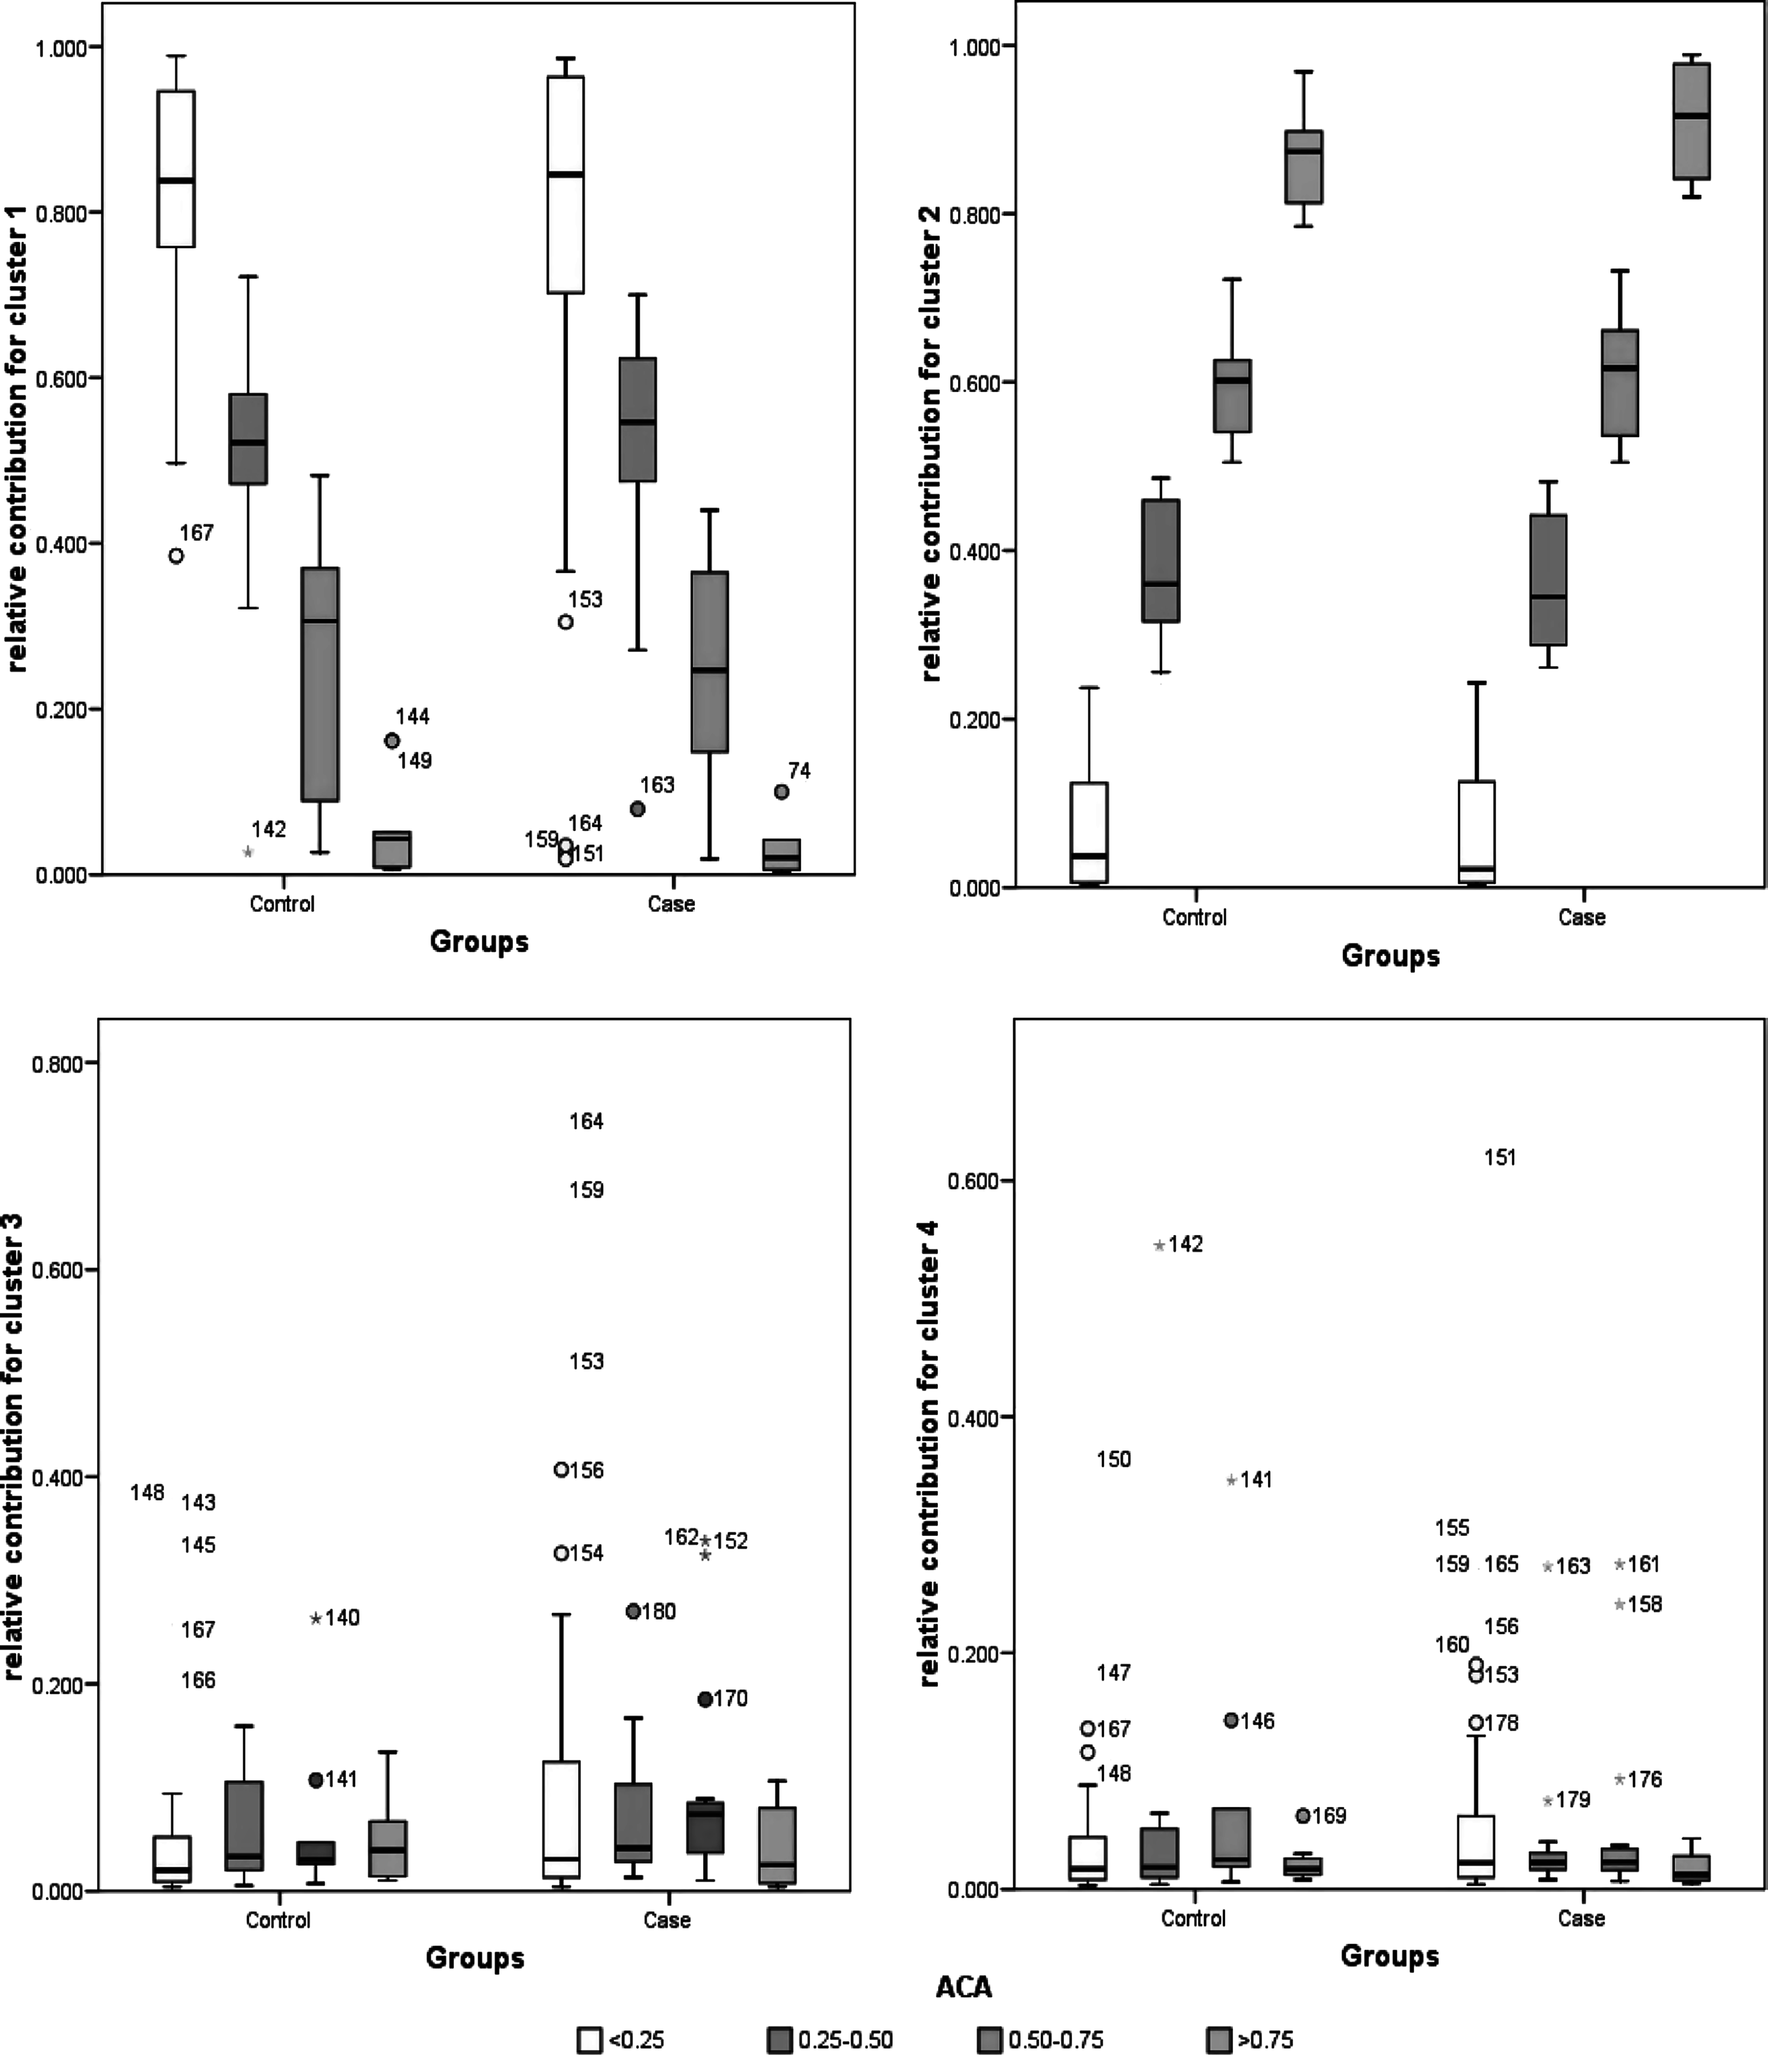
Box plot of ACA categories by relative contribution of ancestral references populations explained by four distinct cluster (K=4) for case and control Brazilian groups. Cluster 1, meanly proportion of European ancestral component; cluster 2, meanly proportion of African ancestral component; cluster 3, meanly proportion of American ancestral component; cluster 4, meanly proportion of East Asian ancestral components. The boundaries of the boxes are Tukey's hinges. The mean value is identified by the line inside the box. The length of the box is the inter-quartile range (IQR) computed from Tukey's hinges. Values higher than three IQR's are labeled as extreme, denoted with an asterisk (*). Values higher than 1.5 IQR's but <3 IQR's are labeled as outliers (○). The numbers indicate the individuals from each group.
Cluster 2, representing mainly proportions of African ancestral component, did not show clearly detectable outliers because the ACA categories were determinate for this cluster dispersion. On the other hand, clusters 3 and 4 showed high numbers of outlier data (18 and 24 samples, respectively) that may result from the lower relative contribution of AME or E ASN ancestral components when compared with those of Africa (cluster 2) and Europe (cluster 1) in the BRA study population. Mostly these outliers were observed in the group of individuals with less relative contribution of African ancestral component.
Discussion
The relative contribution of the European component found in our study group of 0.58 is greater than that based on mtDNA markers of 0.39 (Alves-Silva et al., 2000), but lower than estimates based on Y-chromosome markers of 0.97 (Carvalho-Silva et al., 2001) and autosomal short tandem repeats (STRs) of 0.79 (Ferreira et al., 2006) in the Brazilian population. The African component in our BRA sample of 0.29 is higher than the one based on STRs of 0.14 (Ferreira et al., 2006). However significantly the degree of admixture detected varied depending on the geographical region of Brazil analyzed and the genetic markers used. (Alves-Silva et al., 2000; Carvalho-Silva et al., 2001; Ferreira et al., 2006).
Our sample population revealed a small American contribution (0.07), which is similar to that observed in a white population from the State of Paraná (Southern region of Brazil) using human leucocyte antigen polymorphisms (0.07) (Probst et al., 2000) and in a sample population from the State of São Paulo using 10 STR AIMs (0.07) (Ferreira et al., 2006). A genome-wide study of admixed populations from different American countries showed that frequencies of the Native American component were significantly lower in Brazilians (0.18) and Colombians (0.19) compared with Latino Americans from Los Angeles (0.45) and Mexico City (0.44) (Price et al., 2007).
The Native American population in Brazil was significantly reduced from two million people present at the time of the arrival of the first European colonizers to ∼700,000 individuals, according to the IBGE census database. Further the distribution is uneven with the majority of Native American populations found in the Northern and Central-West regions of Brazil.
Our study is the first to evaluate the East Asian component in a Brazilian sample from Sao Paulo. The East Asian component, as Native American component, has lower relative contribution (0.05) than African (0.29) and European (0.58) components. However, a few samples presented a higher relative contribution of East Asian and American ancestry components than the mean of the BRA sample, even though no individuals self-described as East Asian were observed alongside Native Americans.
It may be critical to exclude possible outliers or to create a new subgroup of individuals with a predominant relative contribution of East Asian and Native American ancestry living in Sao Paulo, even though these two ancestral components had similar relative frequencies between case and control groups in this study. It is also important to consider that it is difficult to distinguish the ancestral origin between the East Asian and Native American populations by 34-plex AIM-SNP, because of their close genetic affinities (Phillips et al., 2007).
The ACA categorization of our samples a better strategy to evaluate African ancestral than self-identified color categories. This is particularly evident in the brown-intermediate group (ACA 0.25-0.50), which presented a high relative contribution of ACA (0.65), an observation previously reported by other studies (Sakuma et al., 2004; Suarez-Kurtz et al., 2007a; Willrich et al., 2008) of Brazilians. The 34-plex AIM-SNPs used provide a simple but effective means to determine the proportion of ACA in our sample population in a statistically secure way. It is also possible to apply the ACA values as a continuous variable in the genetic associated study analysis, and this would still allow the identification of outliers.
The PCA results based on ACA categories underline the need to stratify the sample population in case-control studies based on complex populations such as the study population of Sao Paulo used here. Although the distribution of individuals in each ACA category was homogeneous in the case and control groups, it is possible to segregate the data in subgroups by ACA. Even though the proportions of ancestral components and ACA categories were similar between case and control groups, the outlier analysis showed a different distribution of proportion values among ACA categories. This strategy allowed the investigation of relative component proportions, that is, whether individuals with low African component (ACA <0.25) showed a high proportion of the other three ancestral components. The Tukey Box Plot successfully detected outliers that could be used to stratify the sample population; however our sample size is limited for subgrouping studies.
Conclusion
The strategy of using a highly discriminatory 34-plex AIM-SNP panel to construct ACA categories and perform Tukey Box plot analyses is a simple but effective approach to evaluate the ancestral origin and stratify case and control groups accordingly. Although an urban population sample from Sao Paulo city represents a challenge in terms of likely patterns of admixture, these were efficiently analyzed to allow rebalancing of the study groups when necessary.
Footnotes
Acknowledgments
This study was financially supported by grants from FAPESP (Projects 2000/12224-0 and 2003/02086-8). We thank Claudia Villazon and Raquel de Oliveira for the excellent support during patient selection. V.N. Silbiger, M.A.V. Willrich, F.D.V. Genvigir, S.S. Arazi, and A.C. Rodrigues are recipients of fellowships from FAPESP, São Paulo, SP, Brazil. A. Cerda is a recipient of fellowship from CONECYT, Chile. M.H. Hirata, R.D.C. Hirata, and A.D. Luchessi are recipients of fellowships from CNPq, Brasilia, DF, Brazil.
Disclosure Statement
No competing financial interests exist.
References
Supplementary Material
Please find the following supplemental material available below.
For Open Access articles published under a Creative Commons License, all supplemental material carries the same license as the article it is associated with.
For non-Open Access articles published, all supplemental material carries a non-exclusive license, and permission requests for re-use of supplemental material or any part of supplemental material shall be sent directly to the copyright owner as specified in the copyright notice associated with the article.
