
Abstract
Purpose: We describe a real-time polymerase chain reaction (PCR) protocol based on the fluorescent molecule SYBR Green chemistry, for a low- to medium-throughput analysis of Y-chromosome microdeletions, optimized according to the European guidelines and aimed at making the protocol faster, avoiding post-PCR processing, and simplifying the results interpretation. Methods: We screened 156 men from the Assisted Reproduction Unit, Department of Obstetrics and Gynecology, Institute for Maternal and Child Health IRCCS Burlo Garofolo (Trieste, Italy), 150 not presenting Y-chromosome microdeletion, and 6 with microdeletions in different azoospermic factor (AZF) regions. For each sample, the Zinc finger Y-chromosomal protein (ZFY), sex-determining region Y (SRY), sY84, sY86, sY127, sY134, sY254, and sY255 loci were analyzed by performing one reaction for each locus. Results: AZF microdeletions were successfully detected in six individuals, confirming the results obtained with commercial kits. Conclusion: Our real-time PCR protocol proved to be a rapid, safe, and relatively cheap method that was suitable for a low- to medium-throughput diagnosis of Y-chromosome microdeletion, which allows an analysis of approximately 10 samples (with the addition of positive and negative controls) in a 96-well plate format, or approximately 46 samples in a 384-well plate for all markers simultaneously, in less than 2 h without the need of post-PCR manipulation.
Introduction
Other studies, performed to determine which regions were specifically involved in spermatogenesis, revealed that azoospermia and spermatogenic arrest were the most severe phenotypes that were associated with microdeletions in the AZF region (Vogt et al., 1996); normospermic men never present deletions in this region (Krausz et al., 2006).
The AZF region is classically subdivided into three nonoverlapping regions of Yq, called AZFa, AZFb, and AZFc, whose deletions are associated with spermatogenic failure (Vogt et al., 1996). Deletions of the three AZF regions occur at different frequencies: Deletion of the AZFc region represents 79% of AZF deletions, followed by deletion of the AZFb (9%) and AZFa (3%) regions; a combination of AZFb and AZFc deletions (6%); and deletion of all the three regions (AZFa/b/c 3%) at the same time (Simoni, 2001).
An analysis of the state of art of Y-microdeletions' diagnosis performed in 1999 revealed that several groups optimized different protocols for the screening of various AZF loci, sometimes at the risk of inaccurate or wrong diagnoses (Simoni et al., 1999; Foresta et al., 2001). Thus, the necessity of common guidelines aimed at standardizing the method and allowing quality control of the protocol as well as the diagnosis of Y-microdeletion emerged. The European Accademy of Andrology (EAA) and the European Molecular Genetics Quality Network (EMQN) supported the publication of the “Laboratory guidelines for molecular diagnosis of Y-chromosomal microdeletions” (Simoni et al., 1999; Simoni et al., 2004).
The guidelines established that among all the AZF loci, the six ones required for the analysis are sY84 and sY86 in AZFa, sY127 and sY134 in AZFb, sY254 and sY255 in AZFc, and the two control fragments SRY and Zinc finger Y-chromosomal protein (ZFY) (Simoni et al., 2004). The guidelines suggest the preparation of two multiplex reactions, both containing five fragments (three AZF loci and the two control fragments SRY and ZFY. The polymerase chain reaction (PCR) method permits an end-point detection of the amplification products through the preparation of the agarose gel and the staining with ethidium bromide or other fluorescent dyes. The diagnosis is performed by interpreting the bands of the amplification products on the gel. However, this diagnostic method, although robust, presents some limits, the biggest one being that traditional PCR needs post-PCR processing which cannot be automated (Simoni et al., 2004).
In order to make the protocol faster, avoid post-PCR processing, and simplify results interpretation, we optimized a “real-time” PCR method for Y-chromosome microdeletion detection according to the European guidelines, using the fluorescent molecule SYBR Green.
Materials and Methods
Patients
In this study, we included 156 men who attended the Assisted Reproduction Unit, Department of Obstetrics and Gynecology, IRCCS Burlo Garofolo (Trieste, Italy), who were characterized by azoospermia or severe nonobstructive oligozoospermia, as diagnosed following the WHO guidelines (WHO Laboratory Manual for the Examination and Processing of Human Semen. 5th edn. Geneva, CH: World Health Organization; 2010). Of these 156 men, 150 did not present any Y-chromosome microdeletion, while 6 men were diagnosed with Y microdeletion, by using a commercially available kit (AZF-MX; AB Analitica) based on PCR and gel electrophoresis. Table 1 shows the information regarding the extension of the Y-chromosome microdeletion of the six positive patients.
STS, sequence tagged sites; AZF, azoospermic factor.
In addition, 20 women were included in the study with the aim of evaluating the specificity of the amplification protocol.
DNA extraction
DNA was extracted from peripheral whole blood according to standard procedures using the automated extractor Bio-Robot EZ1 (Qiagen).
Sequence tagged sites and primer selection
The sequence tagged sites (STS) and the primers for the PCR reaction have been chosen according to the European Guidelines (see Table 2).
SRY, sex-determining region Y; ZFY, zinc finger Y-chromosomal protein; Fw, forward; Rev, reverse.
Real-time PCR
A single protocol that amplifies all the STS was developed. The real-time PCR was performed on the 7900HT and 7500 real-time PCR System (Applied Biosystem) and was subsequently replicated on the Smart-Cycler System (Cepheid, Euroclone).
Each STS was amplified using 20 ng of DNA, 12.5 μL 2× FluoCycle™ SYBR Green Mix for real-time PCR (Euroclone S.P.A.) and distilled water to a final volume of 25 μL; a primer optimization matrix was initially performed in order to avoid nonspecific primer binding, and primer forward and reverse final concentrations are reported in Table 3. Each run included a negative (no template) control.
The optimized PCR conditions were as follows: an initial denaturation step of 95°C for 10 min, followed by 38 cycles of 95°C for 30 s, 60°C for 30 s, and 72°C for 30 s. Finally, a melting temperature assay was performed.
Melting analysis
The Melting Temperature Assay (MTA) was performed to obtain a melting profile (dissociation curve) that was characterized by a Tm (melting temperature) which was specific for each amplified target, according to the protocols of the instrument used. The reactions were performed on the ABI 7500 and 7900HT real-time PCR System (Applied Biosystems) and on the SmartCycler System (Cepheid). At the end of amplification (38th cycle), the melting profile of each amplicon was analyzed on a 7500 and 7900HT real-time PCR System with the Sequence Detection System SDS Software (v 2.4), or similarly with the SmartCycler 2.0 Software, in order to identify the point at which the re-association occurred (flexion point).
Samples were analyzed in duplicate and in different PCR runs to test the reproducibility of this technique.
In order to further confirm the specificity of the protocol for each STS locus analyzed, the amplification products obtained in the time PCR were separated on a 2% agarose gel stained with ethidium bromide, to check the expected molecular weights of the amplicons; moreover, a subset of the amplified samples were also randomly sequenced in order to assure the specificity of the protocol.
Results
All DNA samples, of both the 156 men and the 20 women, were analyzed in parallel with the commercial AZF-MX kit and our real-time PCR protocol for the following loci: ZFY, SRY, sY84, sY86, sY127, sY134, sY254, and sY255. Details of the results for each locus are provided next.
ZFY locus
In all the samples analyzed, men, women, and male carriers of AZF microdeletions, the ZFY/ZFX locus was successfully amplified as expected. In fact, the used primers (Table 2) are designed in order to amplify both the ZFX gene (in female) and its homologous ZFY (in male). The ZFX/ZFY region analysis is done in order to verify and ensure that the samples are amplifiable, and to exclude the presence of possible PCR inhibitor or problems with DNA extraction that could bias the results of the AZF analysis.
The mean Tm value obtained with the ABI 7900HT instrument for the ZFY locus was 86.4±0.4. Figure 1 illustrates that the MTA curves for the ZFY/ZFX locus obtained on the ABI 7900 HT instrument for a Y-microdeleted man (YCM), a male sample (M), and female (F) DNA: The plots of all three samples present a dissociation curve at the expected Tm.

Example of a dissociation curve obtained by the analysis of a noninfertile man (M), a female (F), and a male carrier of a microdeletion in the azoospermic factor (AZF) region (YCM) for the ZFX/ZFY locus with the ABI 7900HT real-time machine.
Sex-determining region Y
SRY is a male-specific STS; so, only male samples, comprehensive of male-deleted (YCM) in any other AZF STS, (Fig. 2) will amplify this locus, while no fluorescence signal will be registered in female (F) samples. The mean Tm of the amplification product was 87.8±0.2.
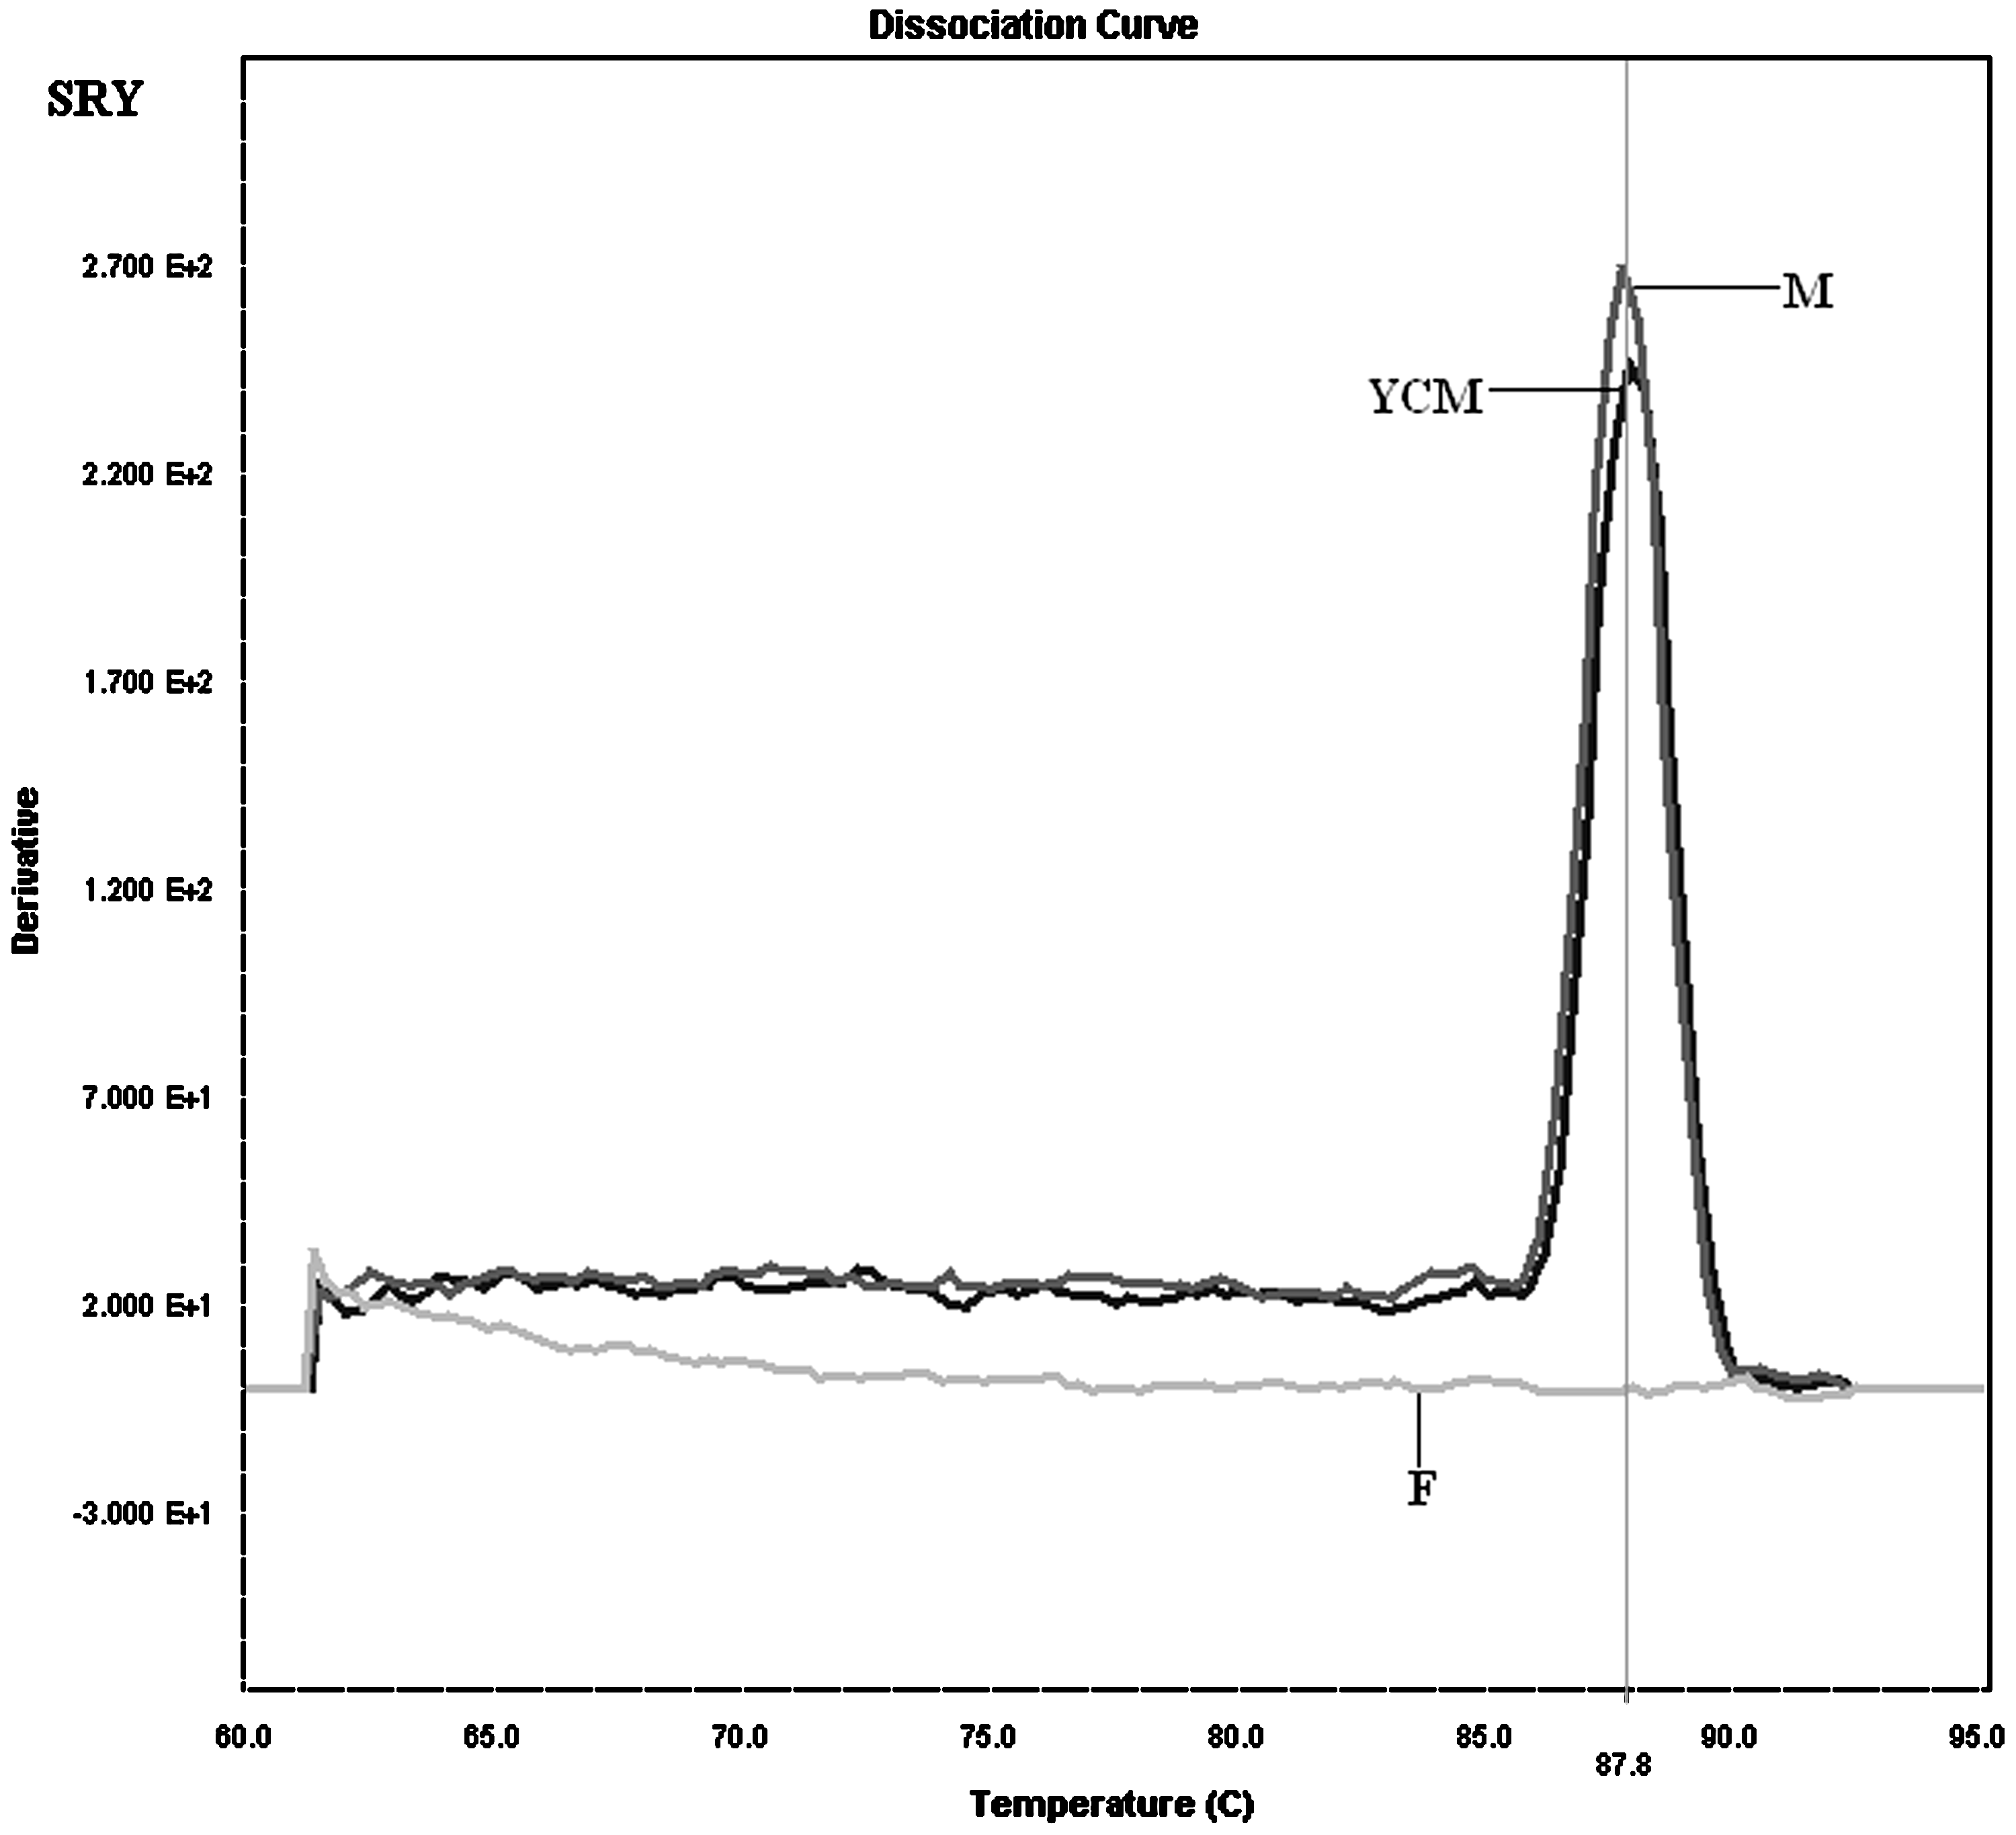
Example of a dissociation curve obtained by the analysis of a noninfertile man (M), a female (F), and a male carrier of a microdeletion in the AZF region (YCM) for the sex-determining region Y (SRY) locus with the ABI 7900HT real-time machine.
It should be noted that the differences in peak heights (as, for example, between M and YCM samples in Fig. 2) are only dependent on the amount of the DNA used for the amplification, which was ∼20 ng but not exactly the same for all samples.
AZFa region
The molecular analysis of the AZFa region involved the two STS markers sY84 and sY86.
sY84
An amplification plot and a dissociation curve (with a mean Tm=88.38±0.19) were obtained for all the noninfertile male samples, and for all the male samples deleted in any other locus that was different from sY84. No dissociation curve has been registered for the samples in which the locus sY84 is deleted (patient #3). In Figure 3 (left panel), the dissociation curve obtained by the amplification of sY84 in a noninfertile man (M), the sample #3 (YCM3) carriers of microdeletion in sY84, and a female sample (F) are reported. As expected, no dissociation curve is obtained when the amplification reaction is performed on a female sample (in which this locus is not present) and on the male sample deleted for the sY84 locus.
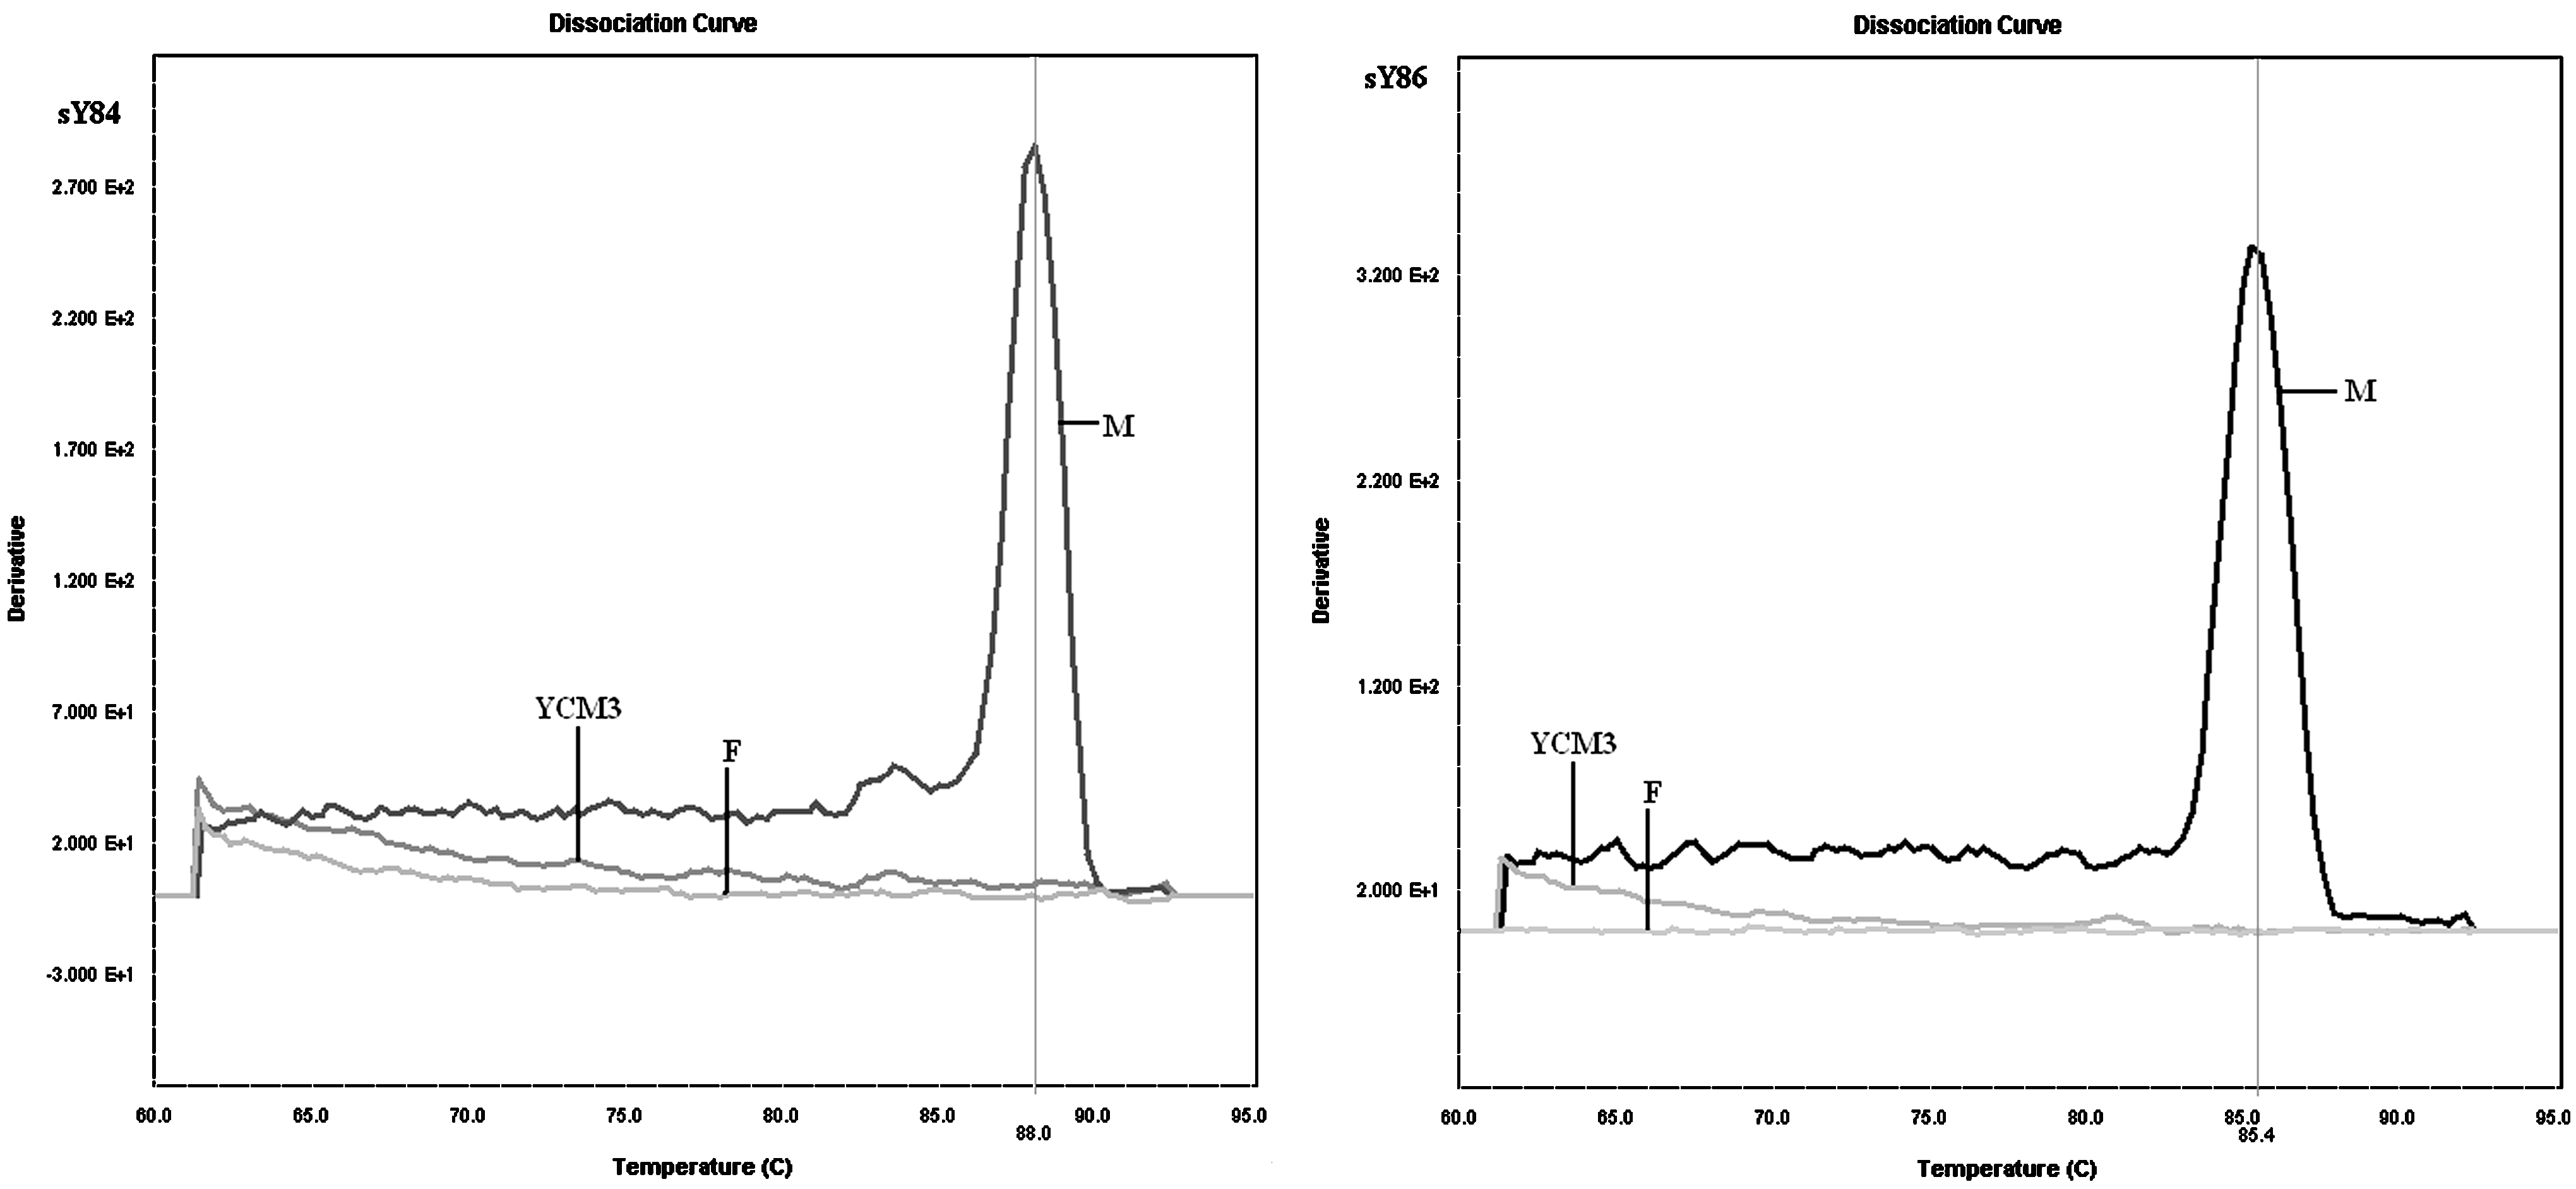
Example of a dissociation curve obtained by the analysis of a noninfertile man (M), a female (F), and a male carrier of a microdeletion in the AZFa region (YCM3), in particular for the deletion of the sY84 locus (left panel) and the sY86 locus (right panel) with the ABI 7900HT real-time machine.
sY86
An amplification plot and a dissociation curve (with a mean Tm=85.45±3.42) were obtained for all the noninfertile male samples analyzed, and for all the male samples deleted in any other locus that was different from sY86. No dissociation curve has been detected for the samples in which the locus sY86 is not present: sample YCM3 (Fig. 3, right panel) and the female (F) samples.
AZFb region
The molecular analysis of the AZFb region involved the two STS markers sY127 and sY134.
sY127
An amplification plot and a dissociation curve (with a mean Tm=84.7±0.6) were obtained for all the noninfertile male samples analyzed, and for all the male samples deleted in any other locus that was different from sY127. No dissociation curve has been registered for the samples in which the locus sY127 is deleted (YCM patients #1, #2, #4, #5, and #6). In Figure 4 (left panel), the dissociation curve obtained by the amplification of sY127 in a noninfertile man (M), the sample #1 (YCM1) carriers of microdeletion in sY127, and a female sample (F) are reported. As expected, no dissociation curve is obtained when the amplification reaction is performed on a female sample and on the male sample(s) deleted for the sY127 locus.
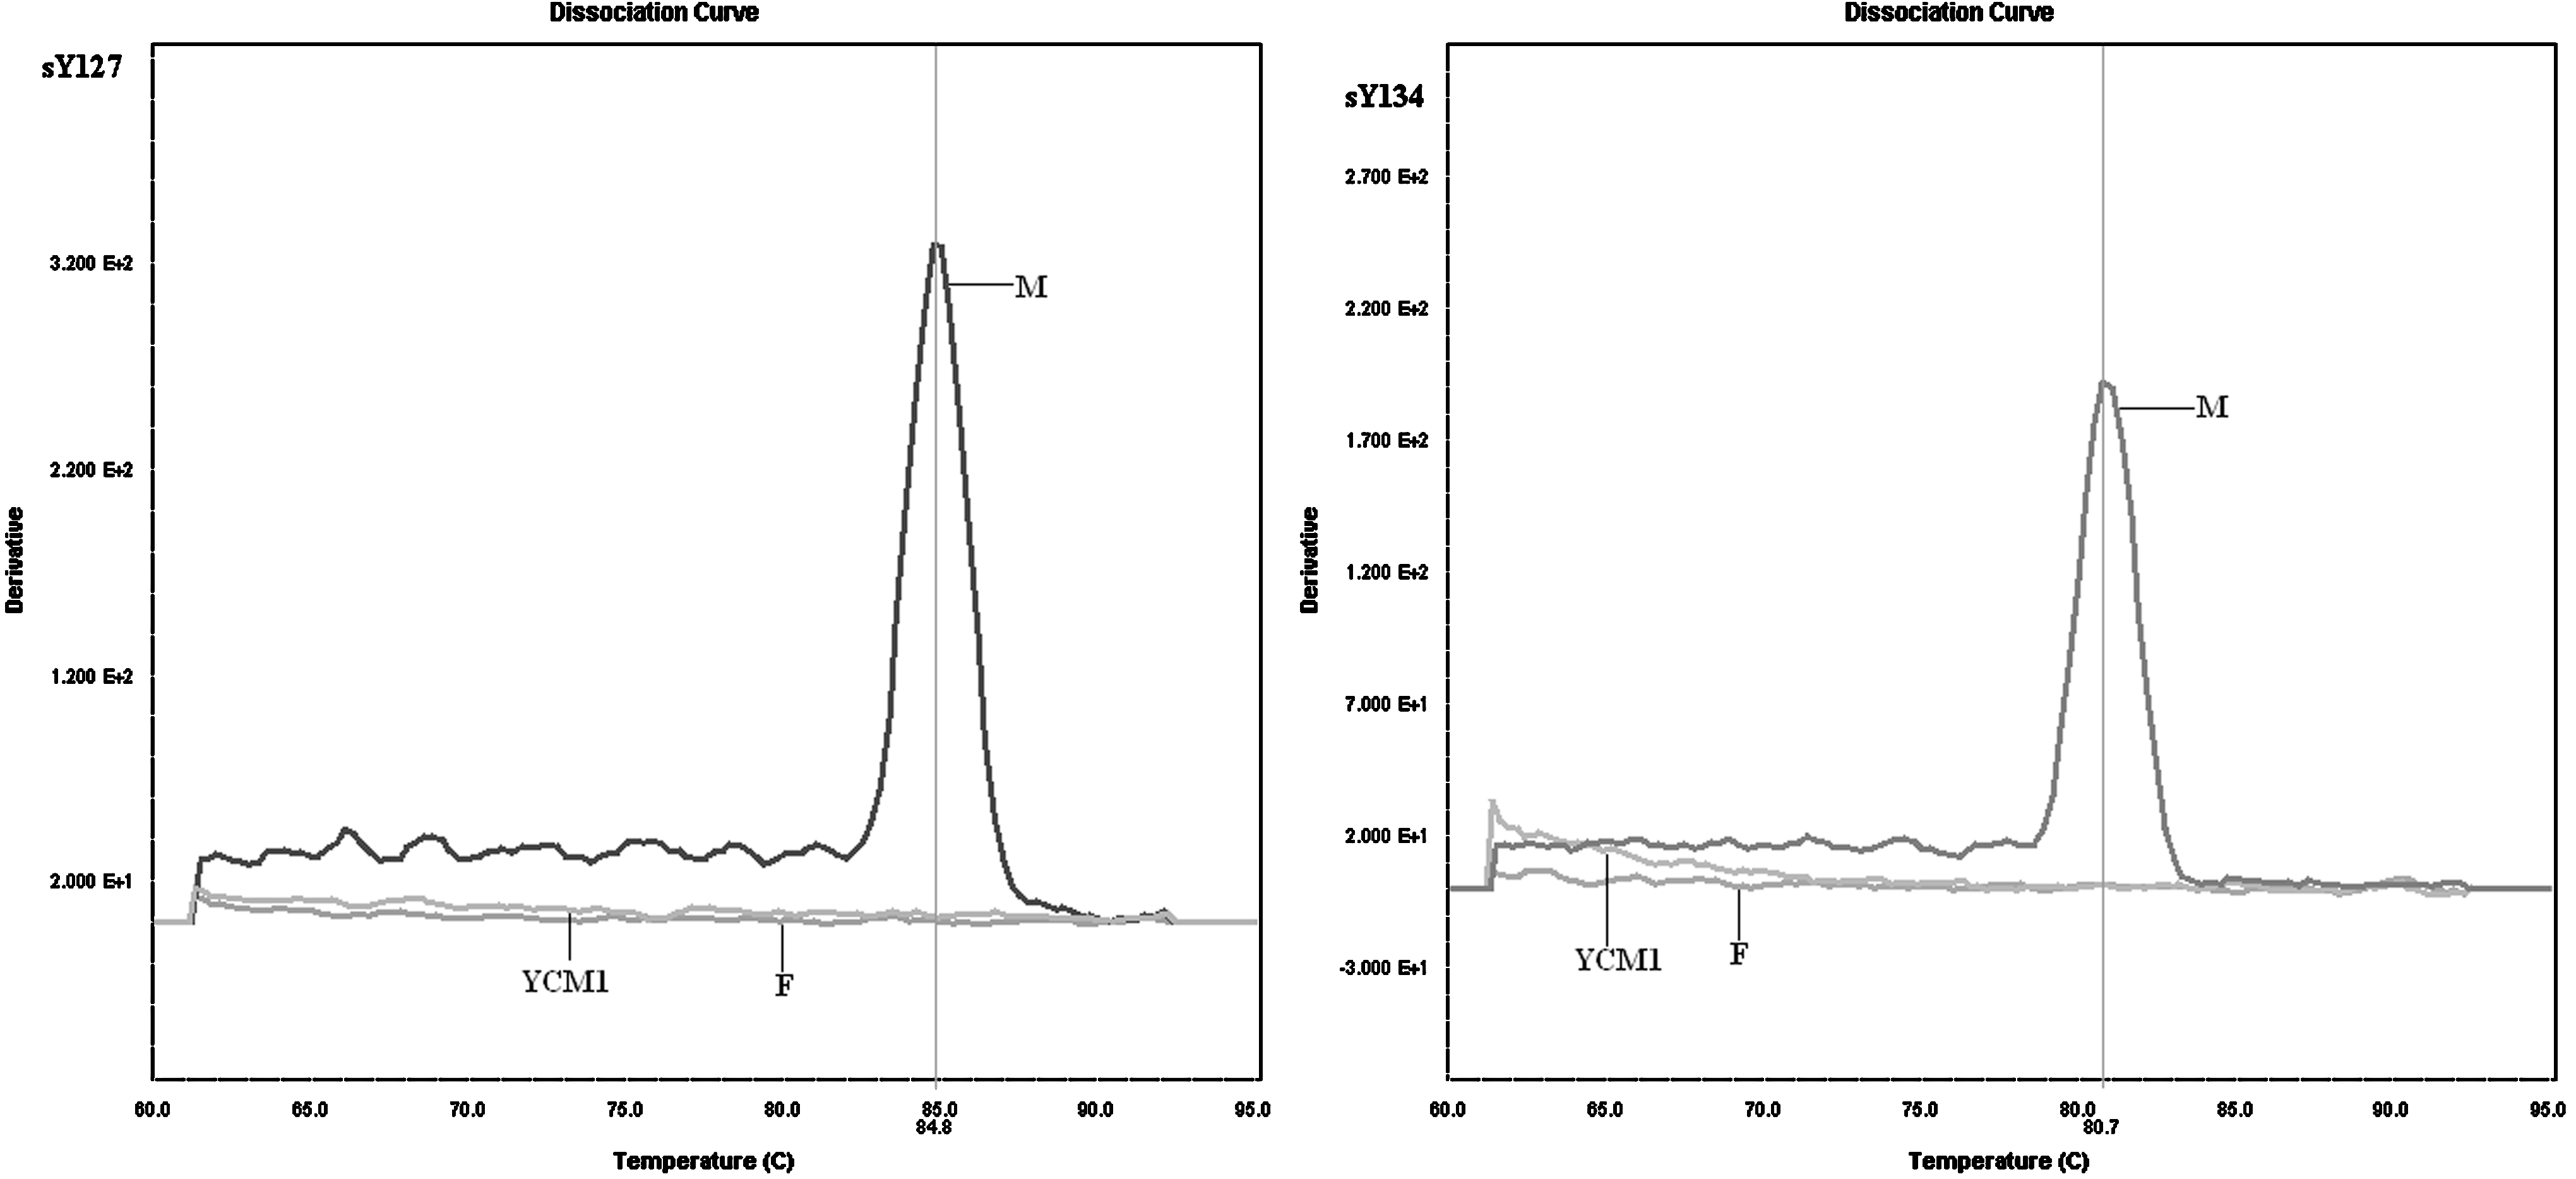
Example of a dissociation curve obtained by the analysis of a noninfertile man (M), a female (F), and a male carrier of a microdeletion in the AZFb region (YCM1), in particular for the deletion of the sY127 locus (left panel) and the sY134 locus (right panel) with the ABI 7900HT real-time machine.
sY134
An amplification plot and a dissociation curve (with a mean Tm=80.5±0.2) were obtained for all the noninfertile male samples analyzed, and for all the male samples deleted in any other locus that was different from sY134. No dissociation curve has been registered for the samples in which the locus sY134 is deleted (patients #1, #2, #4, #5, and #6, the same that also presented the sY127 deletion). In Figure 4 (right panel), the dissociation curve obtained by the amplification of sY134 in a noninfertile man (M), the sample #1 (YCM1) carriers of microdeletion in sY134, and a female sample (F) are reported. As expected, no dissociation curve is obtained when the amplification reaction is performed on a female sample and on the male sample deleted for the sY134 locus.
AZFc region
The molecular analysis of the AZFc region involved the two STS markers sY254 and sY255.
sY254
An amplification plot and a dissociation curve (with a mean Tm=82.1±0.2) were obtained for all the noninfertile male samples analyzed, and for all the male samples deleted in any other locus that was different from sY254. No dissociation curve has been registered for the samples in which the locus sY254 is deleted (patients #1, #2, #5, and #6). In Figure 5 (left panel), the dissociation curves obtained by the amplification of sY254 in a noninfertile man (M), the sample #2 (YCM2) carriers of microdeletion in sY254, and a female sample (F) are reported. As expected, no dissociation curve is obtained when the amplification reaction is performed on a female sample and on the male sample(s) deleted for the sY254 locus.
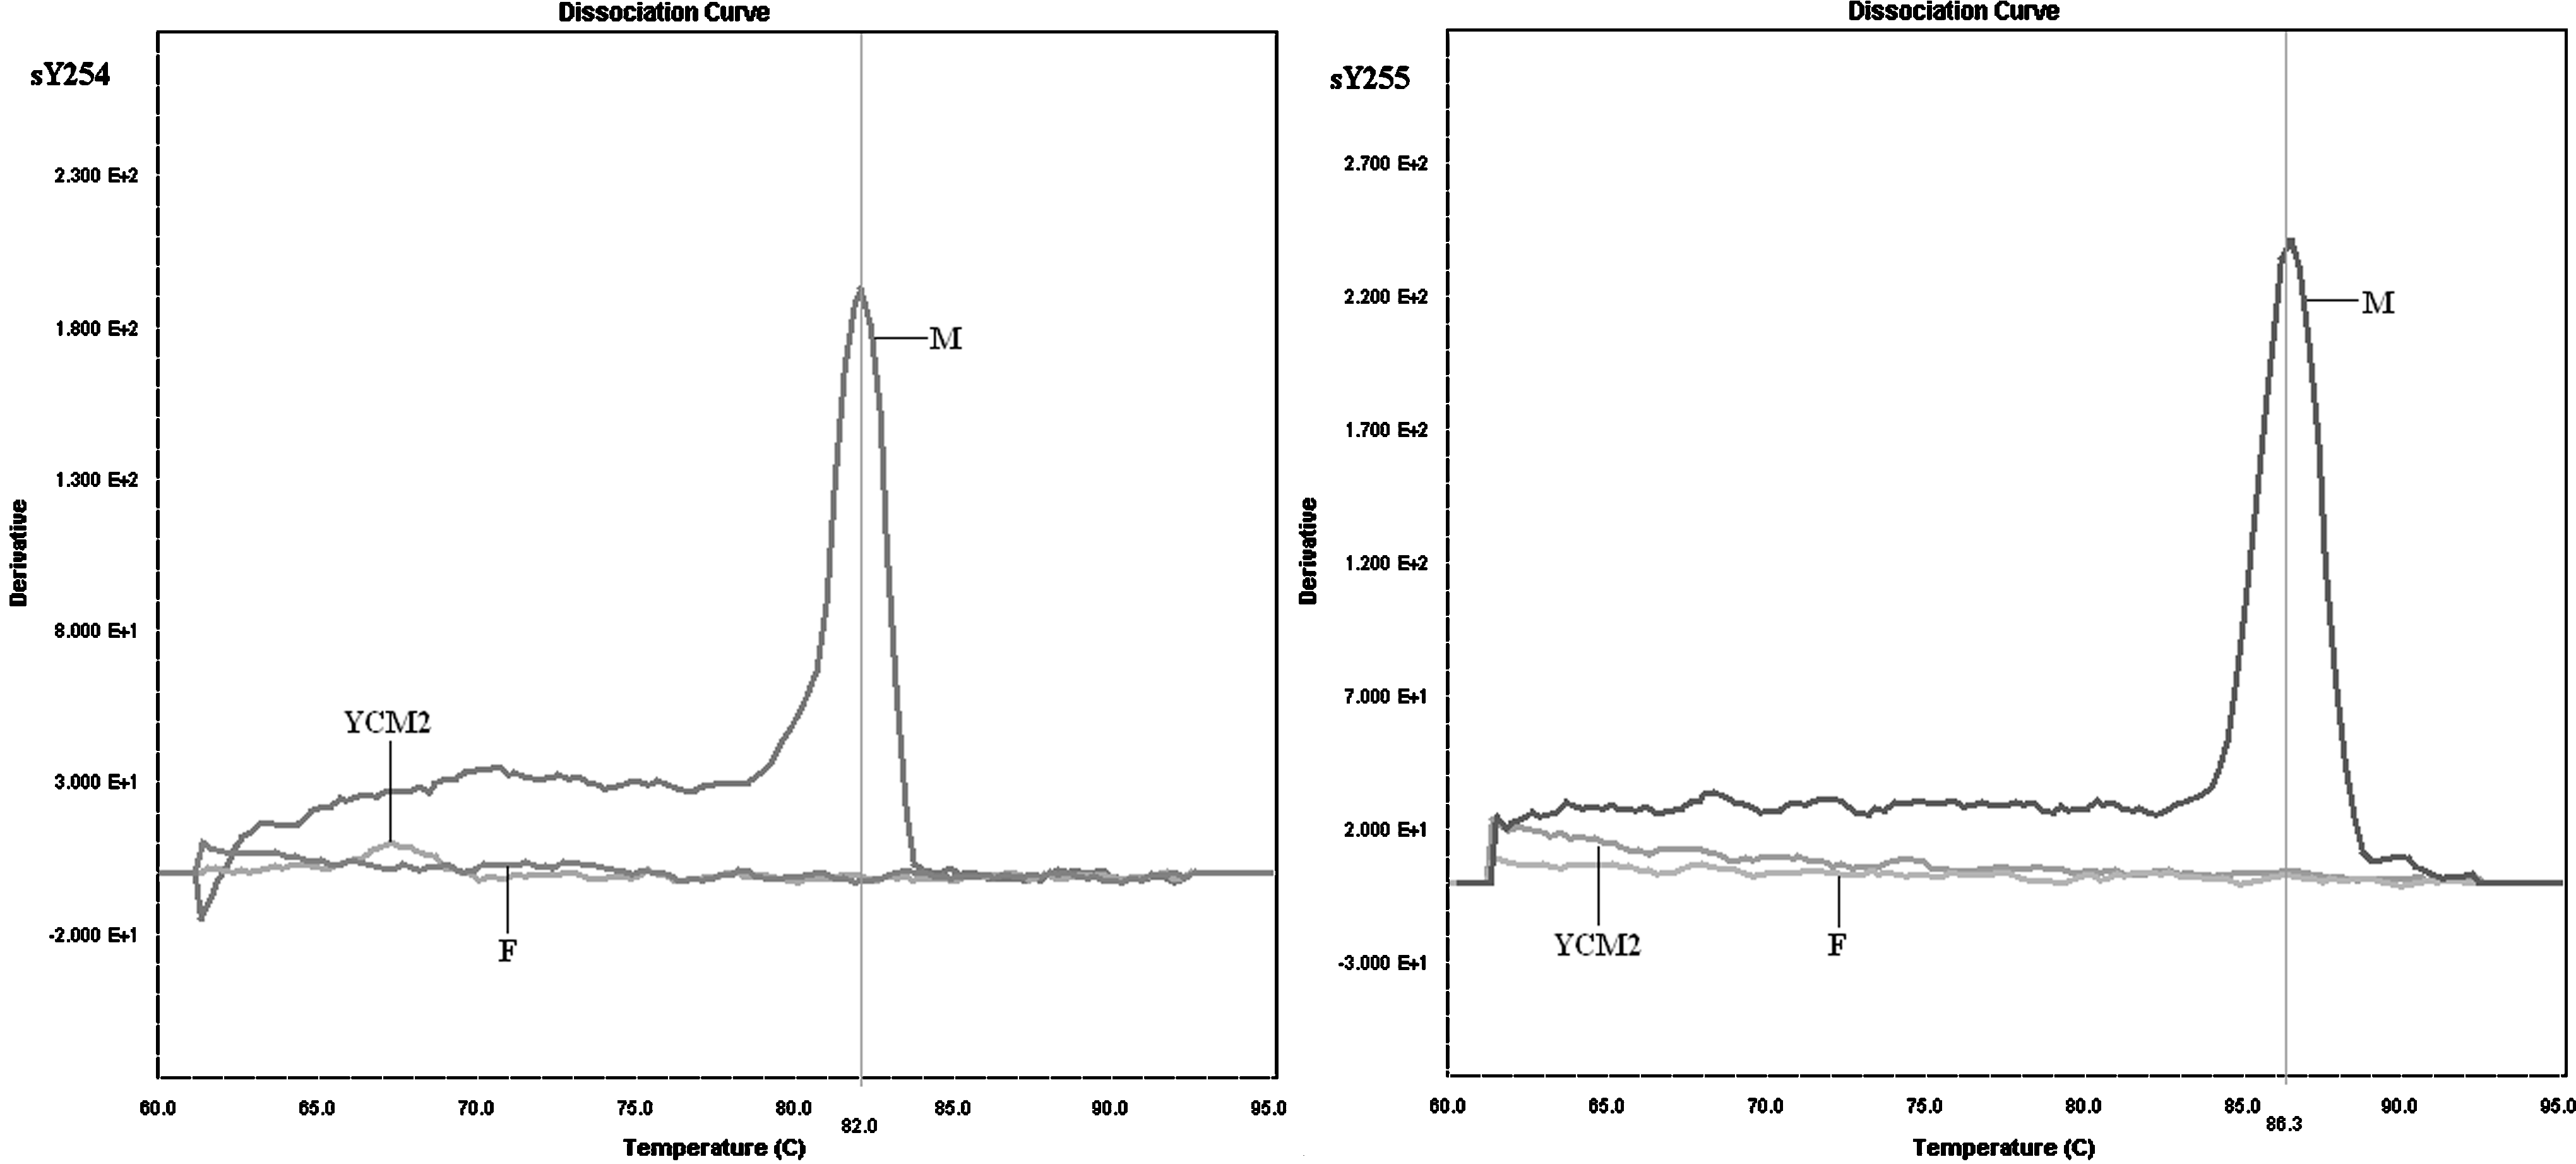
Example of a dissociation curve obtained by the analysis of a noninfertile man (M), a female (F), and a male carrier of a microdeletion in the AZFc region (YCM2), in particular for the deletion of the sY254 locus (left panel) and the sY255 locus (right panel).
sY255
An amplification plot and a dissociation curve (with a mean Tm=86.3±0.7) were obtained for all the noninfertile male samples analyzed, and for all the male samples deleted in any other locus that was different from sY255. No dissociation curve has been registered for the samples in which the locus sY255 is deleted (patients #1, #2, #5, and #6, the same that also presented the sY254 deletion). In Figure 5 (right panel), the dissociation curve obtained by the amplification of sY255 in a noninfertile man (M), the sample #2 (YCM2) carriers of microdeletion in sY255, and a female sample (F) are reported. As expected, no dissociation curve is obtained when the amplification reaction is performed on a female sample and on the male sample deleted for the sY255 locus.
For all loci, the negative (no template) control does not produce the dissociation curve, as expected.
When analyzing the result, only the presence (or absence) of a dissociation curve and its Tm should be considered, not the threshold cycle (Ct), as the Ct values may not be reproducible among different samples and different instruments.
Discussion
The number of heterogeneous methods used in different laboratories to diagnose Y microdeletions determined the necessity to standardize the protocols in order to prevent nonhomogeneous, inaccurate, or wrong diagnoses. For these reasons, EAA/AMQN best practice guidelines for molecular diagnosis of Y-chromosomal microdeletion were published in 2004 (Simoni et al., 2004). The guidelines suggest the method, (PCR), the reagents, and the protocols in order to make an accurate diagnosis of Y microdeletion.
Several protocols based on multiplex PCR and post-PCR amplicon separation by either agarose gel or capillary electrophoresis have been described (see Kozina et al. 2011 for a review), but to our knowledge, only Buch et al. (2003) and Kozina et al. (2011) proposed real-time PCR protocols. Buch et al. analyzed 16 loci in singleplex reactions by real-time amplification and melting temperature curve analyses, using the Light Cycler technology; in their approach; similar to ours, the presence/absence of Y-chromosome microdeletion can be checked by the absence/presence of the corresponding amplicon, and the quality and correct size of the amplicons is quickly verified by the typical melting point of the PCR product, so any supplementary identification of the amplicons by electrophoretic size separation is not required. However, in the study conducted by Buch et al., only 3 out of the 16 markers (namely sY127, sY254, and sY255) were the ones that were also suggested by the guidelines, while sY84, sY86, and sY134, which were considered necessary for Y-microdeletions' accurate diagnosis according to the guidelines, were not considered in their study.
Our protocol, based on real-time PCR protocol with SYBR Green chemistry, was designed in order to avoid the post-PCR manipulation and to reduce reaction times and costs, using the primers described in the EAA/AMQN guidelines (Simoni et al., 2004).
It includes the amplification of a control, consisting of the ZFY/ZFX locus, the SRY locus, and other six loci in the AZFa, AZFb, and AZFc regions, as required by the EAA/AMQN guidelines. For the AZF loci analyzed (sY84, sY86, sY127, sY134, sY254, and sY255), the presence of the amplification product (as indicated by the presence of an appropriate MTA profile) indicated the integrity of the specific locus analyzed in the patient sample; conversely, the absence of the amplification product (absence of the MTA dissociation curve) was indicative of a microdeletion in the specific locus. Thus, the interpretation of the results is extremely simple, and does not require a specific expertise in real-time PCR, as in order to discriminate the presence of a specific locus (or its microdeletion), only the presence (or absence) of a dissociation curve and its Tm should be considered.
The results obtained with this real-time optimized protocol always confirmed the results obtained with the commercial diagnostic kits based on multiplex PCR and gel electrophoresis, indicating that the specificity and sensibility of our methods is comparable to the gold standard.
When compared with the gold standard (two multiplex PCR followed by gel electrophoresis, as indicated by the European guidelines), our real-time PCR permits making a diagnosis, reducing the reaction time, and avoiding the post-PCR manipulation of the products (not requiring gel electrophoresis), even if for each sample to test, eight single reactions should be performed. Although the operator initially requires more pipetting steps in the preparation of the reactions, in less than 2 h, after charging the real-time PCR platform, 10 samples (plus positive and negative controls) in a 96-well plate format or 46 samples in a 384-well plate can be simultaneously analyzed.
Moreover, the preparation of the reaction mix in the initial phase of the protocol can be automated with a simple liquid handler.
A “platform-dependent” limitation of our approach, compared with conventional PCR and gel electrophoresis, may be that the method requires a real-time PCR instrument, possibly not available in every laboratory. Nonetheless, several routinely used diagnostic kits for other diseases have been developed based on real-time detection; so, an increasing number of laboratories have a real-time PCR machine.
Recently, Kozina et al. (2011) described a real-time multiplex PCR for the Y-chromosome microdeletion. The authors analyzed eight markers in two separate multiplex real-time PCR, substituting the SybrGreen I dye by the DNA-binding dye EvaGreen. It is true that this approach requires less effort for the mix preparation, being a multiplex protocol; nonetheless, our method, which was different from the one by Kozina et al., proved to be robust even with the SybrGreen dye, without the need of a better performing dye such as EvaGreen. Moreover, all the primers as well as the internal amplification control we used were the ones suggested by the EAA guidelines, while the Kozina et al. ones were not.
The cost of our “home made” method is around six Euros per diagnosis (including DNA extraction with commercial kits), being cheaper than any of the currently used commercial kits.
In conclusion, we propose a new protocol, optimized according to European guidelines (Simoni et al., 2004), for the analysis of Y-chromosome microdeletions. Unlike the PCR protocols previously described and used in the commonly available commercial kits, our real-time PCR protocol permits making a diagnosis of Y microdeletion with a specificity and sensitivity that was comparable to that of the gold standard but cheaper, more rapid, and more automatable.
Authors' Contributions
L.S. participated in data interpretation and drafted the article: L.P. carried out the experimental real-time protocol optimization; D.D. participated in real-time protocol optimization; V.P. participated in DNA extraction and sequencing; M.M. contributed to samples and data acquisition and performed the validation of the commercial kit used; S.C. conceived the study and analyzed the data; and G.R. performed a medical evaluation of the study participants and critically revised the article.
All the authors have read and approved the final version of the article.
Footnotes
Acknowledgments
SC is the recipient of a grant from the TALENTS Program (7th R&D Framework Program, Specific Program: PEOPLE-Marie Curie Actions-COFUND).
Author Disclosure Statement
No competing financial interests exist.