
Abstract
Aims: Drug-metabolizing enzymes play a major role in determining the outcome of drug therapy. N-acetyltransferase-2 (NAT2) is one of the main enzymes involved in metabolism of isoniazid used in treatment of tuberculosis (TB). Several variations in the NAT2 gene give rise to multiple haplotypes that phenotypically code for different acetylator status. The objective was to generate a more unambiguous picture of the NAT2 scenario in India as compared to that obtained from polymerase chain reaction-restriction fragment length polymorphism methods. Methods: Full-gene-sequencing analysis of NAT2 was carried out in 181 healthy Indian subjects from different regional groups. Results: A total of 33 diplotypes were recorded from six known single-nucleotide polymorphisms. The overall frequency of the slow acetylator haplotypes detected in this study was 65%, followed by 26% and 9% intermediate and rapid acetylators, respectively. Of the slow acetylator alleles, the NAT2*5B/*6A occurred in 25% of the study subjects. Conclusions: The study indicates that the frequency of slow acetylator alleles is high in the adult Indian population. Since the prevalence of TB is high in this population, pharmacogenetic testing for NAT2 alleles may be advisable before start of therapy with isoniazid to prevent drug toxicity.
Introduction
The earliest case of detection of inherited variation in drug metabolism is N-acetylation of isoniazid. The presence of two homologous N-acetyltransferase genes, NAT1 and NAT2, was elucidated by molecular cloning (Blum et al., 1990). In humans, biotransformation of arylamines and hydrazine drugs occurs by acetylation carried out by the N-acetyltransferase-2 (NAT2; E.C 2.3.1.5) present in the liver (Hein et al., 1993). NAT2 is an important enzyme involved in the phase-II biotransformation of many carcinogenic and therapeutic compounds such as isoniazid, nitrozepam, and dapsone. The presence of a cysteine residue (Cys68) in the catalytic site is mainly responsible for the acetyl transfer between the acetyl CoA cofactor and the substrate (Dupert and Grant, 1992). Activation (O-acetylation) of the substrates is catalyzed by NAT1, while deactivation is catalyzed by NAT2. The presence of genetic polymorphisms in the NAT2 gene was first discovered in patients with tuberculosis (TB) treated with isoniazid (Butcher et al., 2002). Genetic polymorphisms in the NAT2 gene that lead to a slow acetylator phenotype have been reported to increase susceptibility to gallbladder cancer (Pandey et al., 2007).
TB is endemic in a tropical country like India. A recent survey indicated 3 lakh fatalities in India every year due to TB. According to the Bombay Municipal Corporation (BMC), Mumbai alone registered 29,528 cases in the year 2010. This is attributed to the congested lifestyle and ignorance on the part of the infected person leading of spreading of disease in the community. A combination therapy involving the use of isoniazid, rifampicin, and ethambutol is widely used for treatment of TB in India (Times of India March 24th, 2011, http://timesofindia.indiatimes.com/city/mumbai/Multi-drug-resistance-multiplies-TB-killereffect/articleshow/7776007.cms). Hence, a pharmacogenomic study of the NAT2 gene in the Indian population is warranted. The rate of N-acetylation of isoniazid divides the human population into rapid-, intermediate-, and slow-acetylator phenotypes.
NAT2 is an intron-less gene, located on chromosome 8p22 and is highly polymorphic. It has an 870-bp coding exon that codes for a protein of 290 amino acids (Blum et al., 1991; Vatsis et al., 1991). Apart from NAT1 and NAT2, a third pseudogene named NATP has also been localized to 8p22 (Blum et al., 1990; Hickman et al., 1994). Variations in the activity of NAT2 is attributed to the presence of single-nucleotide polymorphisms (SNPs) in the gene, different combinations of which give rise to different NAT2 alleles or haplotypes. Till date, ∼66 alleles have been registered with the arylamine N-acetyltransferase nomenclature committee (http://louisville.edu/medschool/pharmacology/consensus-human-arylamine-n-acetyltransferase-gene-nomenclature/). The NAT2*4 allele is considered to be the wild-type allele, as it most commonly occurs in some ethnic groups and phenotypically designated as a fast acetylator due to absence of any SNPs. Also, NAT2*11A, NAT2*12, and NAT2*13 are fast haplotypes (Parkin et al., 1997). NAT2*5 and NAT2*6 are responsible for the slow acetylator status. Presence of two slow alleles leads to slow acetylator status, while two fast alleles lead to fast acetylator status. Intermediate acetylation is caused by the presence of one fast and one slow allele. Out of the 66 alleles recorded till date for the NAT2 gene, SNPs at positions 191, 282, 341, 481, 590, and 803 have been extensively studied in other populations (Patin et al., 2006a). Each haplotype in NAT2 is defined by a signature polymorphism specific to that group. The haplotypes are hence assigned according to functionality of the SNPs recorded in the NAT2 gene (Hein et al., 2000b).
The Indian population is very diverse, due to the presence of different regional groups. The frequency of NAT2 slow acetylator alleles varies considerably in different populations worldwide (Evans, 1989). In Caucasians, the slow acetylator genotype frequency is 66.1% (Loktionov et al., 2002), in Americans 55.9% (Morton et al., 2006), and 5.9% in Japanese (Hiratsuka et al., 2002). Even within India, the frequency widely varies for the NAT2 slow acetylator allele, for instance, 74% in South Indians (Anitha and Banerjee, 2003) and 55% in Western Indians (Singh et al., 2009). Although many studies have been carried out previously to ascertain the frequency of SNPs in positions 191, 282, 341, 434, 481, 590, 803, 845, and 857 of the NAT2 gene, complete sequencing of the coding region is important to determine if any novel polymorphism is present in the Indian population. Recently, in a study carried out in an ethnic population from South India, a novel SNP was detected that was not observed in other studies carried out in different parts of India (Anitha and Banerjee, 2003). The present study was undertaken to determine the frequency of NAT2 slow-acetylator alleles in a cohort of 181 healthy volunteers by full-gene sequencing.
Materials and Methods
Enrollment of healthy subjects
This study was approved by the Institutional Ethics Committee of Cumballa Hill Hospital and Heart Institute, Mumbai. Genomic DNA of 225 healthy volunteers from our DNA bank was used in this study. The cohort consisted of samples from a mixed variety of regional background (Fig. 1).
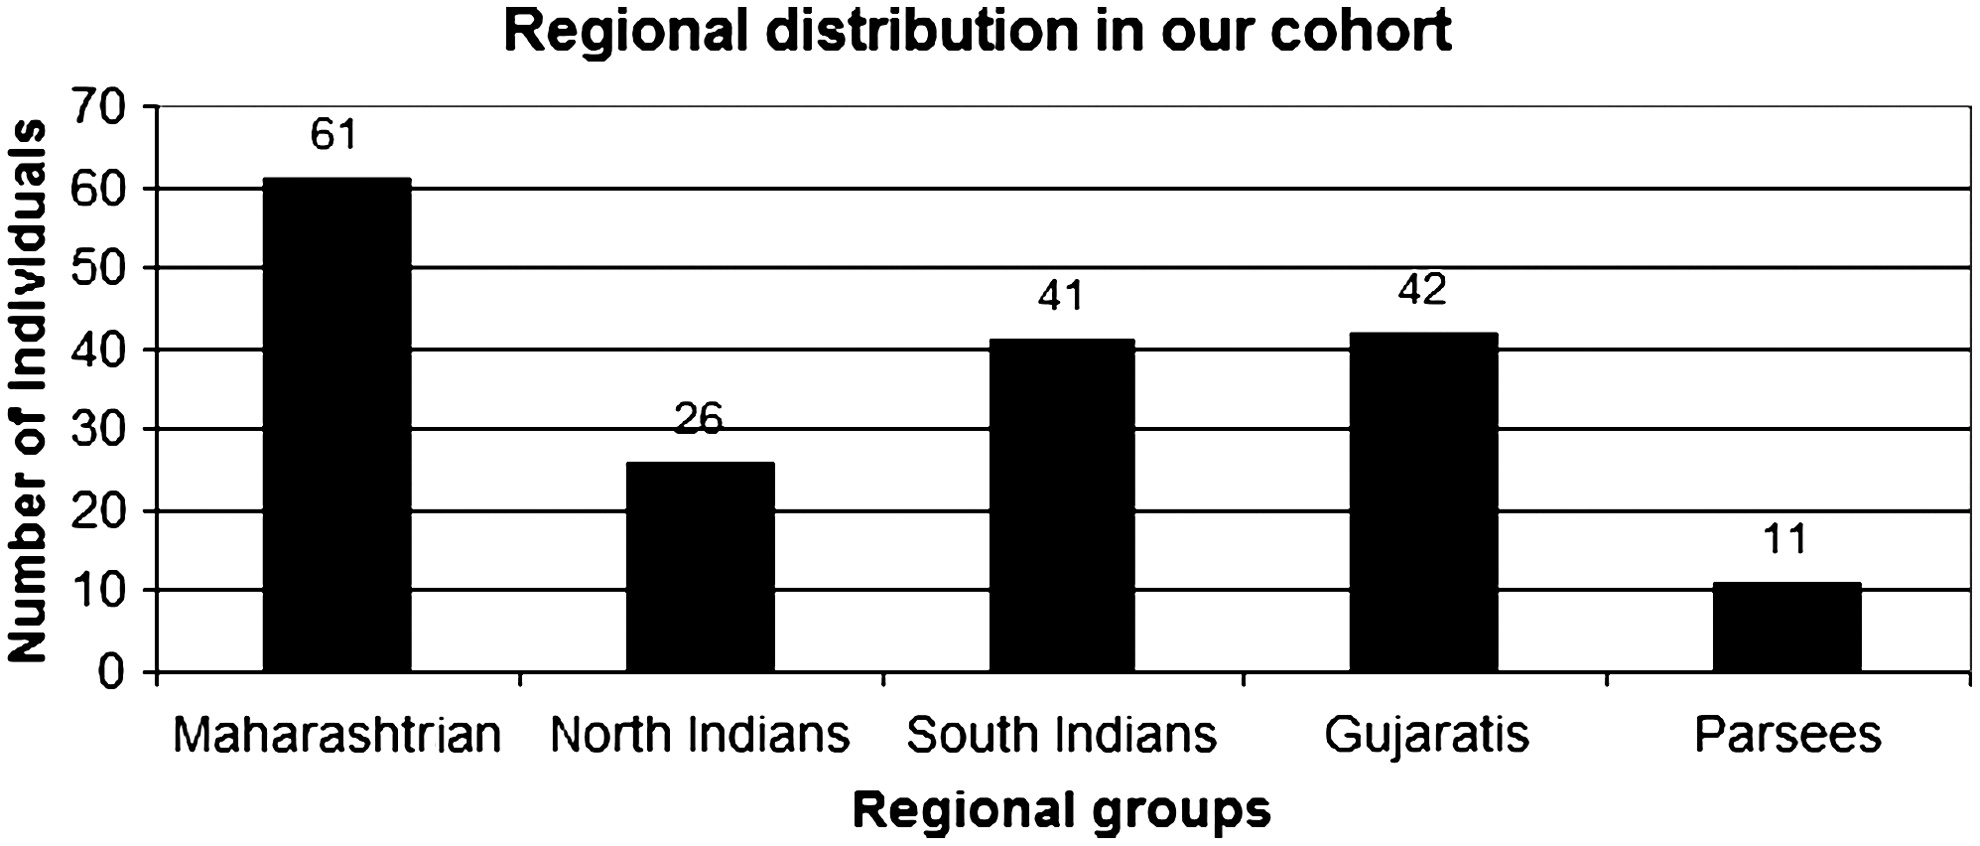
Regional group distribution in our cohort.
Genotyping of NAT2
The SNPs at positions 282, 481, 590, and 803 were genotyped by using the polymerase chain reaction (PCR)-restriction fragment length polymorphism (RFLP) methodology using primers and PCR conditions as described earlier (Doll et al., 1995; Singh et al., 2009). The 341T>C SNP was detected using allele-specific PCR using primers as described previously (Doll et al., 1995). The thermal profile used for the allele-specific PCR amplification was as follows: initial denaturation at 94°C for 5 min followed by 30 cycles of 94°C for 1 min, 58°C for 30 s, 72°C for 1 min, followed by final extension at 72°C for 5 min. The PCR products were visualized, and the 341T>C SNP was genotyped in 2% agarose stained with ethidium bromide.
The data generated by the PCR-RFLP methodology were analyzed for the genotype frequency. While haplotype assignment of samples was being carried out, it was observed that many samples showed more than one haplotype combination; that is, all the known SNPs typed for were not in complete linkage disequilibrium. To validate new combinations of SNPs found and to avoid misclassification of genotypes, full-gene-sequencing analysis of the NAT2 gene for 181 samples out of 225 was carried out.
Sequencing of the NAT2 gene
Complete gene sequencing of the 896-bp PCR product was carried out for 181 in our cohort using a Beckman Coulter DNA Sequencer (Beckman Coulter, Inc.). The genomic DNA was amplified using primer pairs used for PCR-RFLP detection. The PCR reaction was set up in a total of a 20 μL of reaction mixture containing the PCR products, which were purified using a QIAmp PCR purification kit (Qiagen). The purified PCR products were subjected to unidirectional sequencing using reverse primer by the Dye Terminator Cycle Sequencing method using the Beckman Coulter DNA Sequencer as per the manufacturer's instructions. The analysis was carried out using Beckman Coulter CEQ 8000 series genetic analysis system software and Seq Scanner V1.0 software (Applied Biosystems). All the samples showing unique mutations or singletons and new haplotype were reamplified and resequenced and checked for confirmation.
Statistical analysis
Genotypes at loci 838G>A, 803A>G, 766A>G, 759C>T, 683C>T, 638C>T, 622T>C, 609G>T, 590G>A, 578C>T, 518A>G, 499G>A, 481C>T, 434A>C, 411A>T, 403C>G, 364G>A, 345C>T, 341T>C, 282C>T, 191G>A, 190C>T, 111T>C, and 70T>A were recorded for all the 181 samples. Haplotype analysis was performed using PHASE v2.1.1, which uses the Bayesian method for reconstruction developed by Stephens and associates (Stephens et al., 2001; Stephens and Donnelly, 2003; Stephens and Scheet, 2005). It is freely available via the World Wide Web (www.stat.washington.edu/stephens/). The entire set of 181 samples was subjected to PHASE analysis six times at 1000 iterations, burn in 1, and thinning interval of 500. Consistency of the results was observed in all the runs, and hence the predicted phase alleles were further used for assignment of haplotypes. The data generated by PCR-RFLP account for only a subset of variant alleles found in the human population, which can potentially lead to misclassification of genotype and deduced phenotypes. This shortcoming was overcome by full-gene sequencing. Hence, data generated by full-gene sequencing of 181 samples were used for further frequency calculations.
Linkage disequilibrium analysis
Linkage disequilibrium (LD) analysis was performed for all the NAT2 variations recorded at a frequency of ≥0.01 in our study using Haploview v. 4.2. Four blocks were detected in our study having weak LD as shown in Table 1. The LD plot is shown in Figure 2.
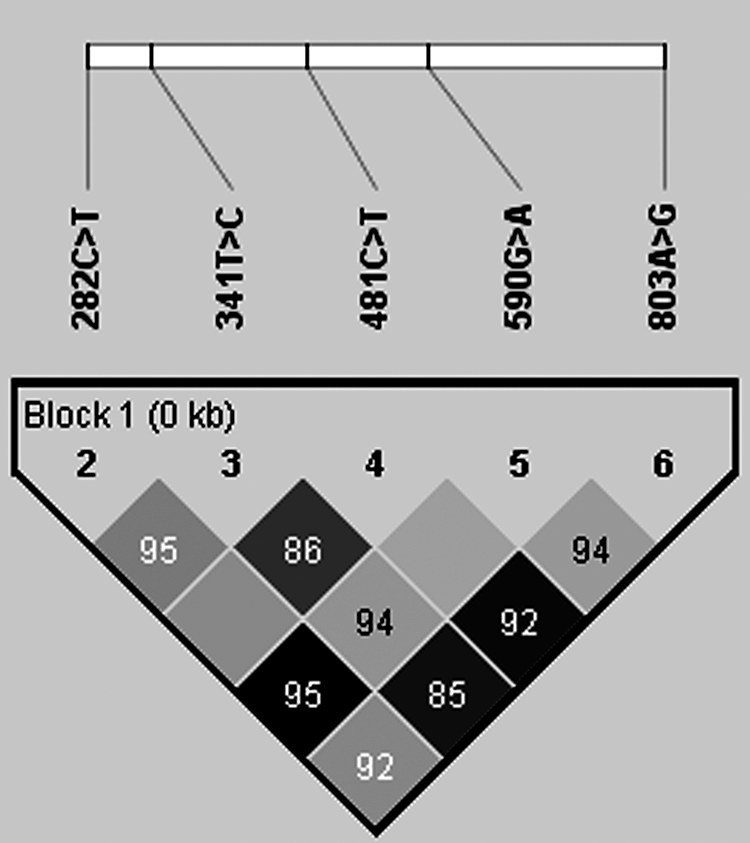
Linkage disequilibrium analysis plot.
SNPs, single-nucleotide polymorphisms.
Results
Full-gene-sequencing data generated for all the 181 samples were used to record SNPs in the NAT2 gene. The pherogram for the SNPs at positions 282, 341, 481, 590, and 803 is as shown in Figures 3 and 4. The haplotypes for all the samples were assigned using PHASE v2.1.1 software freely available online. The frequency of all the different haplotypes recorded in our cohort was calculated manually. A total of 33 different diplotypes were recorded in our study from six known SNPs viz. 803A>G, 590G>A, 481C>T, 341T>C, 282C>T, and 191G>A. Most of the haplotypes were recorded at a probability of>0.9 by PHASE v2.1.1 (Table 2). According to the trimodal distribution of NAT2 activity, the overall frequency of the slow-acetylator allele (64.64%) was calculated to be highest in our study, followed by intermediate acetylators (25.97%) and rapid acetylators (9.39%) (Table 3). The highest frequency of haplotype recorded in our study was the NAT2*5B/*6A of 24.86%, which is a slow acetylator allele, followed by the NAT2*4/*6A of 12.15%, which codes for intermediate-acetylator status (Table 2). The frequency of the wild-type NAT2*4/*4 was recorded to be 4.97% in our study, which was the highest followed by other fast acetylator haplotypes NAT2*4/*13A, NAT2*4/*12A, and NAT2*4/*12C (Table 2). SNPs 282C>T, 341T>C, 481C>T, 590G>A, and 803A>G were the most frequently recorded SNPs with frequencies of 0.73, 0.69, 0.60, 0.65, and 0.67, respectively. In addition to these, the SNPs 759C>T, 518A>G, 345C>T, 191G>A, and 190C>T were recorded as singletons at a frequency of <1%. No novel SNPs were detected in our study.
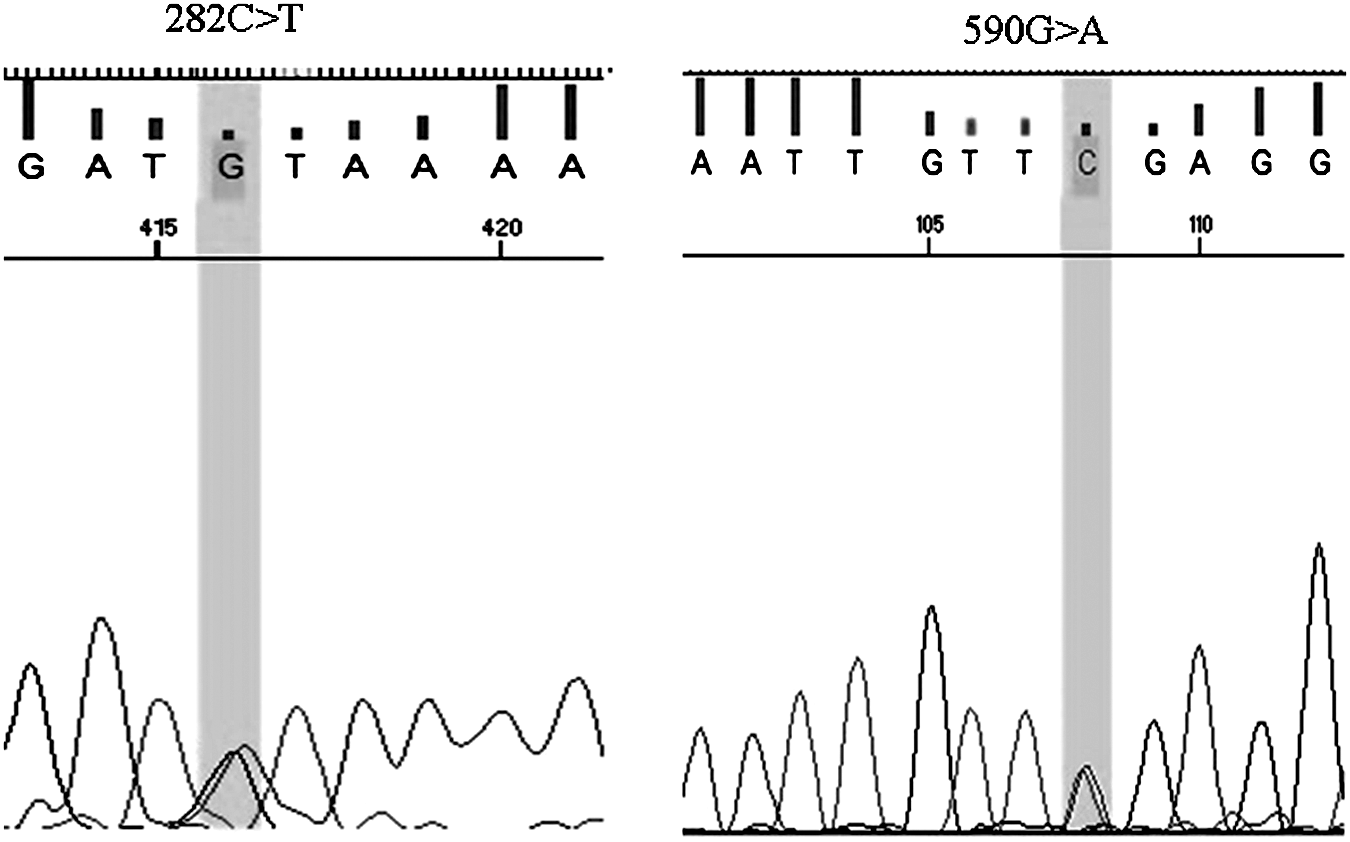
Pherograms for 282C>T and 590G>A.
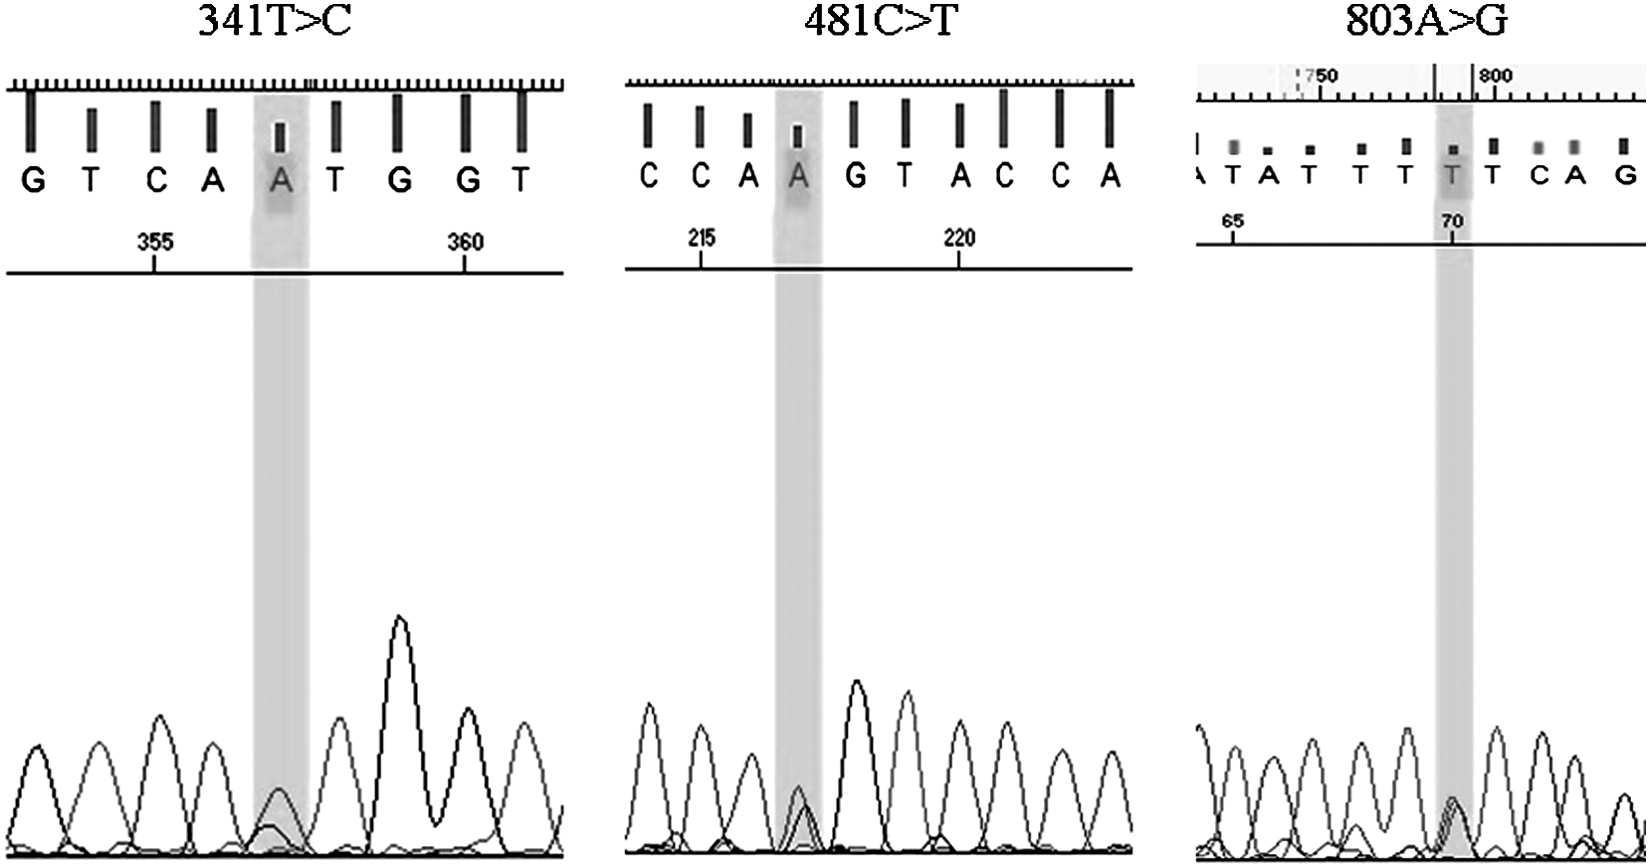
Pherograms for 341T>C, 481C>T and 803A>G.
Discussion
To the best of our knowledge, this is the first study on full-gene-sequencing analysis of the NAT2 gene in an adult Indian population originating in different regions of the country. The only other report on similar lines is on a very specific regional group of 50 individuals, from Maharashtra in western India (Singh et al., 2009). In the present study, we analyzed the entire coding region of the NAT2 gene in 181 adult Indians belonging to different regional groups by full-gene sequencing, and results were recorded.
The NAT2 acetylation polymorphism also known as the isoniazid acetylation polymorphism was discovered 40 years ago, when differences in toxicity were observed in patients treated with isoniazid (Hughes et al., 1954; Weber and Hein, 1985). The NAT2 acetylation polymorphism is very important, as it is involved in activation as well as metabolism of a wide variety of drugs and chemical carcinogens. Also, NAT2 association studies between slow acetylator phenotype and bladder cancer, as well as fast acetylator phenotype and colorectal cancer, are widely reported in different populations (Lower et al., 1979; Chen et al., 1998).
The NAT2*4, which is considered to be the wild-type allele, is the most common haplotype present in different ethnic groups such as Caucasians and Africans with exception of few. Other haplotypes of NAT2 such as the NAT2*12A (803G>A), NAT2*12B (282C>T, 803G>A), NAT2*12C (481C>T, 803G>A), NAT2*13A (282C>T), and NAT2*18 (845A>C) also code for fast-acetylator phenotypes. The overall frequency of fast acetylators recorded in our study was 9.39%, of which the *4/*4 diplotype accounted for 4.97% (Tables 1 and 2). In one of the recent studies carried out in an adult Maharashtrian Indian population, the frequency recorded for fast acetylators was 13%, of which 6.5% was the frequency of the *4/*4 diplotype along with which NAT2*4/*11A, *4/*12A, *4/*12C, and *4/*13 were recorded as fast acetylators in this study (Singh et al., 2009). In our study, the other fast alleles recorded were NAT2*4/*12A, *4/*12C, and *4/*13A at frequencies of 0.55%, 1.10%, and 2.76%, respectively.
The combination of slow and rapid acetylator haplotypes gives an intermediate phenotype. The overall frequency of intermediate acetylators recorded in our study was 25.97% of which highest frequency was recorded for NAT *4/6A as 12.15% as shown in Tables 1 and 2. Earlier studies report a frequency of 32% for intermediate acetylators, with highest recorded for the NAT2*4/*6A at 10.4%. In other studies carried out in North Indians, no intermediate acetylators were detected (Arif et al., 2007).
The NAT2 slow acetylators were detected at an overall frequency of 64.64% in this study (Table 2). The highest frequency recorded was for the NAT2*5B/*6A allele at 24.86%, followed by the NAT2*6A/*6A allele at 9.94%, NAT2*5B/*5B at 7.73%, and NAT2*5B/*5C at 3.31% (Table 1). The other slow-acetylator diplotypes recorded in this study had a frequency ∼1% as shown in Table 1.
NAT2 functional variation leads to a lot of diversity in the enzyme activity. The frequency of the different NAT2 haplotypes also varies in different populations. The frequency of different NAT2 acetylators worldwide is as shown in Table 4. Also, in recent years, full-gene-sequencing analysis, especially for the NAT2 gene, has been carried out extensively because of the large number of haplotypes possible due to different combination of SNPs present and also to present an unbiased description of the gene. A study carried out in 12 Sub-Saharan African populations of the NAT2 gene by full-gene-sequencing analysis identified seven new mutations (Patin et al., 2006b).
Variation is seen in the frequency of different NAT2 genotypes. In a study carried out in Maharashtrian Indians from the western part of the country; the frequency of the NAT2*6A was recorded to be highest at 28.4%, followed by the NAT2*4 and NAT2*5B at 23.4% and 23.1%, respectively (Singh et al., 2009). In another study carried out in the ethnic populations of South India, the slow acetylator genotype was found to be predominant at 74% (Anitha and Banerjee, 2003). In a case-control study carried out in the Northern part of India, the frequency of the NAT2*6 and NAT2*7 haplotype was found to be higher in patients with gall bladder cancer (Pandey et al., 2007). Although studies have been carried out in different parts of India, on the whole, the frequency of slow acetylators is as high as 60% in Indians (Pande et al., 1996). Also, the long-range haplotype test identified the NAT2*5B haplotype, which contains the 341T>C SNP, coding for the slow-acetylator allele under positive selection in western/central Eurasians (Patin et al., 2006a). Studies have identified that the 341T>C SNP alone is sufficient to cause slow acetylation, as the hydrophobicity at that position is very important for the enzyme activity, and presence of the SNP leads to enhanced protein degradation (Zang et al., 2004). Also, cancer risk with NAT2 is dependent on exposure to carcinogens. This fact was detected in a study in which it was found that smoking-related DNA adducts were found in large quantities in breast tissue of individuals who are slow acetylators, while rapid acetylators had higher levels of PhIP-DNA (2-amino-1-methyl-6-phenylimidazo [4,5-b] pyridine) (Zhu et al., 2003).
Although we analyzed the entire NAT2 gene to ascertain the frequency of different NAT2 haplotypes in a mixed regional cohort of 181 adult Indians, such studies are warranted for each regional group, as the Indian population is largely diverse and has different regional groups. Since no novel variation was detected in our study, we can conclude that for the Indian population, detection of the variations at the five loci studied worldwide is enough to generate data on the acetylator status of an individual. Caffeine is the most commonly used probe drug in healthy volunteers to ascertain NAT2 acetylation status phenotypically. However, this method is not very robust, as it requires quantitation of key intermediates and metabolites that are unknown (Grant et al., 1984). The susceptibility to different types of cancers with the acetylation status of NAT2 is being carried out worldwide. The NAT2 slow acetylators have been found to be higher in respiratory diseases such as asthma in India (Batra et al., 2006). The slow-acetylator status has also been mentioned as a factor responsible for individual susceptibility to immunoglobulin E-mediated food allergy in children (Gawronska et al., 2001). Due to multiethnicity of the Indian population, it will be interesting to note if there is any difference in susceptibility to different cancers, though general studies in the Indian population carried out in North India showed susceptibility to gall bladder cancer and the slow-acetylator genotype (Pandey et al., 2007).
In our study carried out in a mixed cohort of different regional groups, considerable prevalence of slow acetylators was detected, followed by intermediate and rapid. Although age, gender, and drug interactions can influence the drug response in an individual, genetic factors also affect the efficacy of the drug. Hence, determination of the acetylator status of an individual is very important for effective therapy and prevention of adverse drug reactions.
Although this study has been carried out in a small sample size, consisting of samples from different regional groups in the country, it throws light on the high frequency of slow acetylators in the Indian population and also stresses on the fact that pharmacogenetic testing is important and urgent, especially for patients undergoing isoniazid therapy for TB. Also, individual regional groups need to be studied in depth in a larger sample size to ascertain if difference in the region of origin influences the susceptibility to predisposition to certain cancers and adverse drug reactions.
Footnotes
Acknowledgments
The work was supported by the Baun Foundation Trust at the Cumballa Hill Hospital and Heart Institute, Mumbai, and consumable grants awarded to Sandhya Iyer and Ashwini Tilak by the Department of Biotechnology (DBT), Government of India. Sandhya Iyer and Ashwini Tilak were supported by DBT Fellowships. We thank Khalsa College of Arts and Science, Matunga, Mumbai authorities for allowing us access to their Beckman Coulter DNA sequencer. The authors would also like to thank Dr Etienne Patin (Centre National de la Recherche Scientifique (CNRS) FRE 2849, Unit of Molecular Prevention and Therapy of Human Diseases, for helping us with the interpretation of the PHASE analysis results.
Author Disclosure Statement
No competing financial interests exist.