
Abstract
Abstract
The generation of biological data on wide panels of tumor cell lines is recognized as a valid contribution to the cancer research community. However, research laboratories can benefit from this knowledge only after the identity of each individual cell line used in the experiments is verified and matched to external sources. Among the methods employed to assess cell line identity, DNA fingerprinting by profiling Short Tandem Repeat (STR) at variable loci has become the method of choice. However, the analysis of cancer cell lines is sometimes complicated by their intrinsic genetic instability, resulting in multiple allele calls per locus. In addition, comparison of data across different sources must deal with the heterogeneity of published profiles both in terms of number and type of loci used. The aim of this work is to provide the scientific community a homogeneous reference dataset for 300 widely used tumor cell lines, profiled in parallel on 16 loci. This large dataset is interfaced with an in-house developed software tool for Cell Line Identity Finding by Fingerprinting (CLIFF), featuring an original identity score calculation, which facilitates the comparison of STR profiles from different sources and enables accurate calls when multiple loci are present. CLIFF additionally allows import and query of proprietary STR profile datasets.
Introduction
Several methods may be applied to authenticate cell lines (O'Brien et al., 1980; Jeffreys et al., 1985; Masters et al., 2001; Liu et al., 2008; LaFramboise, 2009). Among these, profiling of Short Tandem Repeat (STR) has emerged as the method of choice due to limited cost, speed, high efficiency, and reproducibility (Masters et al., 2001). Following this, the recent work of an international workgroup organized by the ATCC Standards Development Organization (ATCC-SDO) has resulted in a set of general recommendations for a standardized methodology for authenticating human cell lines by STR analysis across laboratories (ATCC-SDO, 2010). This technique, originally developed for forensic applications, is based on the analysis of the length of highly polymorphic genetic loci represented by short DNA sequences showing a varying number of repeats in each human subject. Simultaneous amplification of multiple STR loci allows the discrimination of cell lines originated from different donors. In cancer, the determination of the alleles at each locus is complicated in some cases by the presence of more than two alleles per locus, as a result of genomic instability.
There are currently more than one thousand commercial cell lines available from different vendors. STR profiles for some of them can be retrieved from vendor databases (such as the American type Culture Collection (ATCC) or the German Collection of Microorganisms and Cell Cultures (DSMZ)) or from sparse literature reports (Lorenzi et al., 2009; Dirks et al., 2010; Dirks and Drexler, 2011; Bady et al., 2012). These profiles are mainly based on the analysis of 8 STR loci, except for the NCI-60 cancer cell line panel and a recently published glioma cell line panel, for which 15 STR loci were profiled (Lorenzi et al., 2009; Bady et al., 2012).
After generating STR profiles for each cell line, a fundamental part in the identity verification process is the comparison of results with public data. At present, this is a laborious process when applied to multiple cell lines, due to the need to query multiple sources of information.
A resource to facilitate STR interrogation is represented by the Cell Line Integrated Molecular Authentication database (CLIMA) (Romano et al., 2009), allowing the simultaneous interrogation of multiple publicly available sources starting from the input of an individual STR profile. However, the retrieved STR profiles for the same cell line may sometimes be heterogeneous due to the variability of allele calls in different databases, in particular when three or more alleles are present.
Here we report a large dataset comprising STR profiles for 300 commercially available broadly used cell lines, generated using 15 STR loci plus amelogenin to maximize the accuracy of the analysis. To our knowledge, this is the largest homogeneous 16 loci dataset available today. Access to this dataset is facilitated by the in-house developed software tool for Cell Line Identity Finding by Fingerprinting (CLIFF). CLIFF features an original algorithm for similarity score calculation that accounts for partial allele identity at each locus. Importantly, the score deals with the number of loci that are used in the comparison and with the number of alleles per locus, allowing a more precise definition of the level of similarity, which is particularly relevant when multiple alleles per locus are present. CLIFF is freely available at www.nervianoms.com/en/.
Materials and Methods
Cell cultures
Cell lines were maintained in an appropriate culture medium, supplemented with 10% heat-inactivated FCS, 2 mM L-glutamine without antibiotics; cultures were all routinely checked for mycoplasma contamination using the Mycoalert Assay (Lonza) and LookOut Mycoplasma PCR detection kit (Sigma).
Cell line tumor xenografts
Subcutaneous implantation of 5-106 A2780 or MX-1 cells was performed on CD1 nude mice. Tumor specimens obtained after sacrifice were fragmented and implanted subcutaneously into new animals, for three (A2780) or ten (MX-1) times. MX-1 tumor samples from the last implant passage and A2780 tumors from all three passages were snap-frozen in liquid nitrogen until DNA extraction for STR profile analysis.
DNA extraction
Genomic DNA was prepared starting from cryopreserved cell lines (about 3×10⁶ cells each, all prepared within 3-5 culture passages from the originally purchased stocks) or from about 25 mg of snap-frozen xenograft tumor tissue sections, using a NucleoSpin Tissue kit (Macherey-Nagel Düren), according to the manufacturer's protocol. DNA yield and purity was assessed by absorption measurement at 260 nm and by determination of the 260/280 ratio value using a Nanodrop 1000 Spectrophotometer (Thermo Scientific). Genomic DNA integrity was checked by gel electrophoresis on 0.8% agarose gels.
STR multiplex PCR
All cell lines were analyzed using the AmpFlSTR Identifiler Plus PCR Amplification kit (Applied Biosystems) allowing the simultaneous amplification of 15 tetranucleotide repeated loci, together with the amelogenin gender marker. Purified genomic DNA (1 ng) was amplified with the recommended standard 28-cycle PCR protocol, and PCR products were purified with Autoscreen 96A-well plates (GE Healthcare) as recommended, to remove contaminants and to reduce background noise.
Capillary electrophoresis
Capillary electrophoresis was performed using the 3100 Applied Biosystems DNA Sequencer instrumentation according to the AmpFlSTR Identifiler Plus PCR Amplification kit protocol.
Allele designation
Allele designation was derived by comparing sample peaks to allelic ladder peaks using the Gene Mapper 3.5 software (Applied Biosystems). Off-ladder alleles were compared to the variant allele report provided by the National Institute of Standards and Technology (NIST, 2012), which includes a list of new or previously unpublished variant alleles.
Comparative analysis
The custom-defined CLIFF Identity Score (CIS) was used to compute the degree of similarity between the two cell lines and is described by the following formula:
where X defines a query cell line as a vector of N loci, that is, X={x1,× 2 ,…xi,…xN}, and Y defines a target cell line as a vector of M loci, that is, Y={y1,y2,…yi,…yM}. Each locus is defined as a vector of alleles, that is, xi={a1, a2,…aK} and yi={b1, b2…, bZ}, for N,M,K,Z being integers.
The formula first computes a locus similarity value ranging from 0 to 1 between each locus pair, weighed for locus size, and then sums up the total number of loci of the query cell line (N) and finally normalizes by the total number of loci in common between the two cell lines; this value is then expressed as a percentage. The resulting CIS value can range from 0 (for totally different STR profiles) to 100% (complete allele identity).
Results
Generation of a database containing the STR profiles for a panel of 300 cell lines
We characterized a panel of 300 widely used cell lines, representative of diverse solid tumors and leukemias, purchased from different vendors over a long time span. We performed STR analysis of 15 highly polymorphic loci plus amelogenin for gender determination, to maximize cell line identification accuracy. To facilitate the interrogation of the resulting dataset, we developed a Java-based user-friendly software tool for CLIFF, easily portable on different platforms, provided with a graphical user interface (Fig. 1). Users can insert a cell line name to retrieve the corresponding STR profile, or input an STR profile using a variable number of loci (up to 16) to identify the corresponding cell line. A command feature activates the query and an identity score is calculated using a custom algorithm (see below). In the Result table, cell line matches with the corresponding similarity score are displayed, and cell lines defined as identical based on the proposed threshold (>80% identity, explained below) are highlighted. The modular feature of the CLIFF tool also allows users to upload and interrogate their own STR repository in addition to the built-in dataset.

Cell Line Identity Finding by Fingerprinting (CLIFF) user interface. The CLIFF Graphical User Interface is composed of four main sections.
Development of the CIS algorithm
When comparing STR profiles to assess the identity of the cell line of interest, it is crucial to accurately manage the similarity calculation, particularly when multiple alleles per locus are present. This is often the case in cancer cell lines (Parson et al., 2005; Lorenzi et al., 2009). In our 300 cell line collection, 52 cell lines (17%) had at least one locus with more than two alleles.
Several algorithms have been published for STR comparison and identity call. Some of these do not address the issue of multiallelic calls, while others suffer limitations that reduce their general applicability (Lorenzi et al., 2009; German Collection of Microorganisms and Cell Cultures; Bady et al., 2012; Eltonsy et al., 2012). Indeed, the algorithm supplied by DSMZ (Deutsche Sammlung von Mikroorganismen und Zellkulturen GmbH-DSMZ) considers multiallelic loci for the two cell lines under comparison, but produces a value (EV) that may exceed 1.0 since the number of alleles analyzed per single cell line can vary. The most recently reported score (Eltonsy et al., 2012) considers multiallelic loci, but it only takes into account the number of matching alleles between two cell lines, without balancing for the total number of alleles.
For a more accurate comparison of STR profiles in different cell lines, we introduced the CIS (details in Materials and Methods). The CIS value is an improved version of the method proposed by Lorenzi et al. and is designed to account for partial allele identity at each locus, to comprise the level of similarity in a 0% to 100% scale and to deal properly with possible missing values at some loci.
An 80% consensus similarity threshold is widely accepted to define two cell lines as identical (Masters et al., 2001; Lorenzi et al., 2009; Eltonsy et al., 2012). As recently reported (Bady et al., 2012), the stringency of a 80% similarity cutoff is sometimes insufficient to unambiguously discriminate two cell lines if based on a 8 STR plus amelogenin marker panel, while it is greatly improved using a higher number of markers, such as 15 STRs plus amelogenin. To test the robustness of our system, we used the highly unstable HCT-116 cell line as a model. The STR profiles of HCT-116 cells purchased from three different providers were compared to a publicly available reference profile and the minimum CIS score resulted to be 82%, further confirming the similarity threshold of 80% as a reasonable choice also in our settings.
The formulation of the CIS value remains indeed effective in identifying true similarities among cell lines (>80%) also in cases where Lorenzi's score failed and had to introduce an artificially relaxed definition of STR profile similarity.
Example for this are the U251 and SNB19 cell lines, known to be derived from the same tumor, but reported in Lorenzi et al. with a similarity of 78%; notably, with our method, we computed a CIS of 83% for the same cell lines, thus successfully recognizing their similarity without the need to introduce an approximation.
Characterization of the in-house STR profile panel based on CIS values
We first used CIS to compare the in-house generated STR profiles against public STR data sources (listed in Table 1), with a cutoff of 80%. For 9 of our cell lines, STR profiles are disclosed for the first time in this report, since we found no published data available.
STR, Short Tandem Repeat.
The analysis allowed us to highlight all cases of cell lines reported to share a common origin, such as AU565 and SK-BR-3, or SH-SY5Y and SK-N-SH (Table 2). We could also detect cases of known HeLa contamination, such as the well-characterized WRL-68 cell line (Capes-Davis and Freshney, 2012), and GLC-82, a cell line reported to originate from the same individual as the KB, Hep-2, and HeLaSF cell lines that in turn are derived from HeLa (SNP6.0 Affymetrix genotyping microarrays-Sanger Institute, 2012). For a global characterization of the dataset, we then used CIS to investigate the degree of similarity within the panel itself. A pairwise CIS similarity matrix was computed using all profiles. A good agreement in STR profiles was consistently observed for the same cell lines obtained from different cell line providers. Interestingly, also cell lines, such as MOLT-4 (Lorenzi et al., 2009), characterized by having more than two alleles at multiple loci, showed a good concordance in STR profile (CIS=88%) among different providers (DSMZ and NCI). On the other hand, an average CIS value of 30% revealed a generally low degree of similarity for all pairs of different tumor cell lines, which is expectedly well below the chosen 80% threshold. Data stratification effects were explored by multidimensional scale (MDS) analysis, a statistical technique used for exploring similarities or dissimilarities in data (Borg and Groenen, 2005). After mapping possible confounders on MSA (MDS Analysis) similarity network, such as tissue, source, or sex, we found no evidence of any grouping effects (data not shown).
STR profile stability after the implantation of cell lines in mouse models was also explored, by comparing CIS values for xenograft tumors obtained after several in vivo passages (Materials and Methods) against the respective in vitro cell line counterparts. Resulting STR profiles were superimposable for both A2780 and MX-1 cell lines, at least until the 10th vivo/vivo passage (MX-1). Manipulation of cell lines in vitro might also impact their genetic features; for four different cell lines transfected with a luciferase gene expression vector, we observed a CIS average value of 99% when compared to the parental clones, suggesting that the manipulation does not affect the STR comparison (data not shown).
Comparison of 15 versus 8 STR loci analysis approaches
To evaluate the effects of a 15 versus 8 STR loci analysis in our experimental settings, we compared the CIS score obtained on our panel using a different number of loci. Impressively, while highly similar cell line pairs (CIS>80%) were robustly detected in both settings (213 in the 8-loci analysis, 211 in the 15-loci analysis), the number of cell line pairs with borderline similarity values, ranging from 60% to 80%, was strikingly decreased from 852 to 9 using 15 loci (Fig. 2). These are examples where the similarity is neither a clear mismatch (<60%) nor a clear match (>80%) due to a lower discriminating power of the analysis performed using a limited number of markers. As shown by simulation studies conducted by Bady et al., (2012) when only 9 markers are used, values close to 80% are not always sufficiently reliable to recognize a common or different cell line origin. As an example, the known identity between U251 and its derivative U251 MG would have been missed with 8 loci (CIS=78% vs. CIS=81% with 15 loci). Also, the cell line pair SW1417 vs. U937 is correctly not identified as similar with a 15 loci analysis (CIS=52%), while it would have been incorrectly assigned (CIS=83%) using 8 STR markers (Fig. 3). These data suggest that the seven additional loci are crucial to avoid cell line misidentification in critical situations.
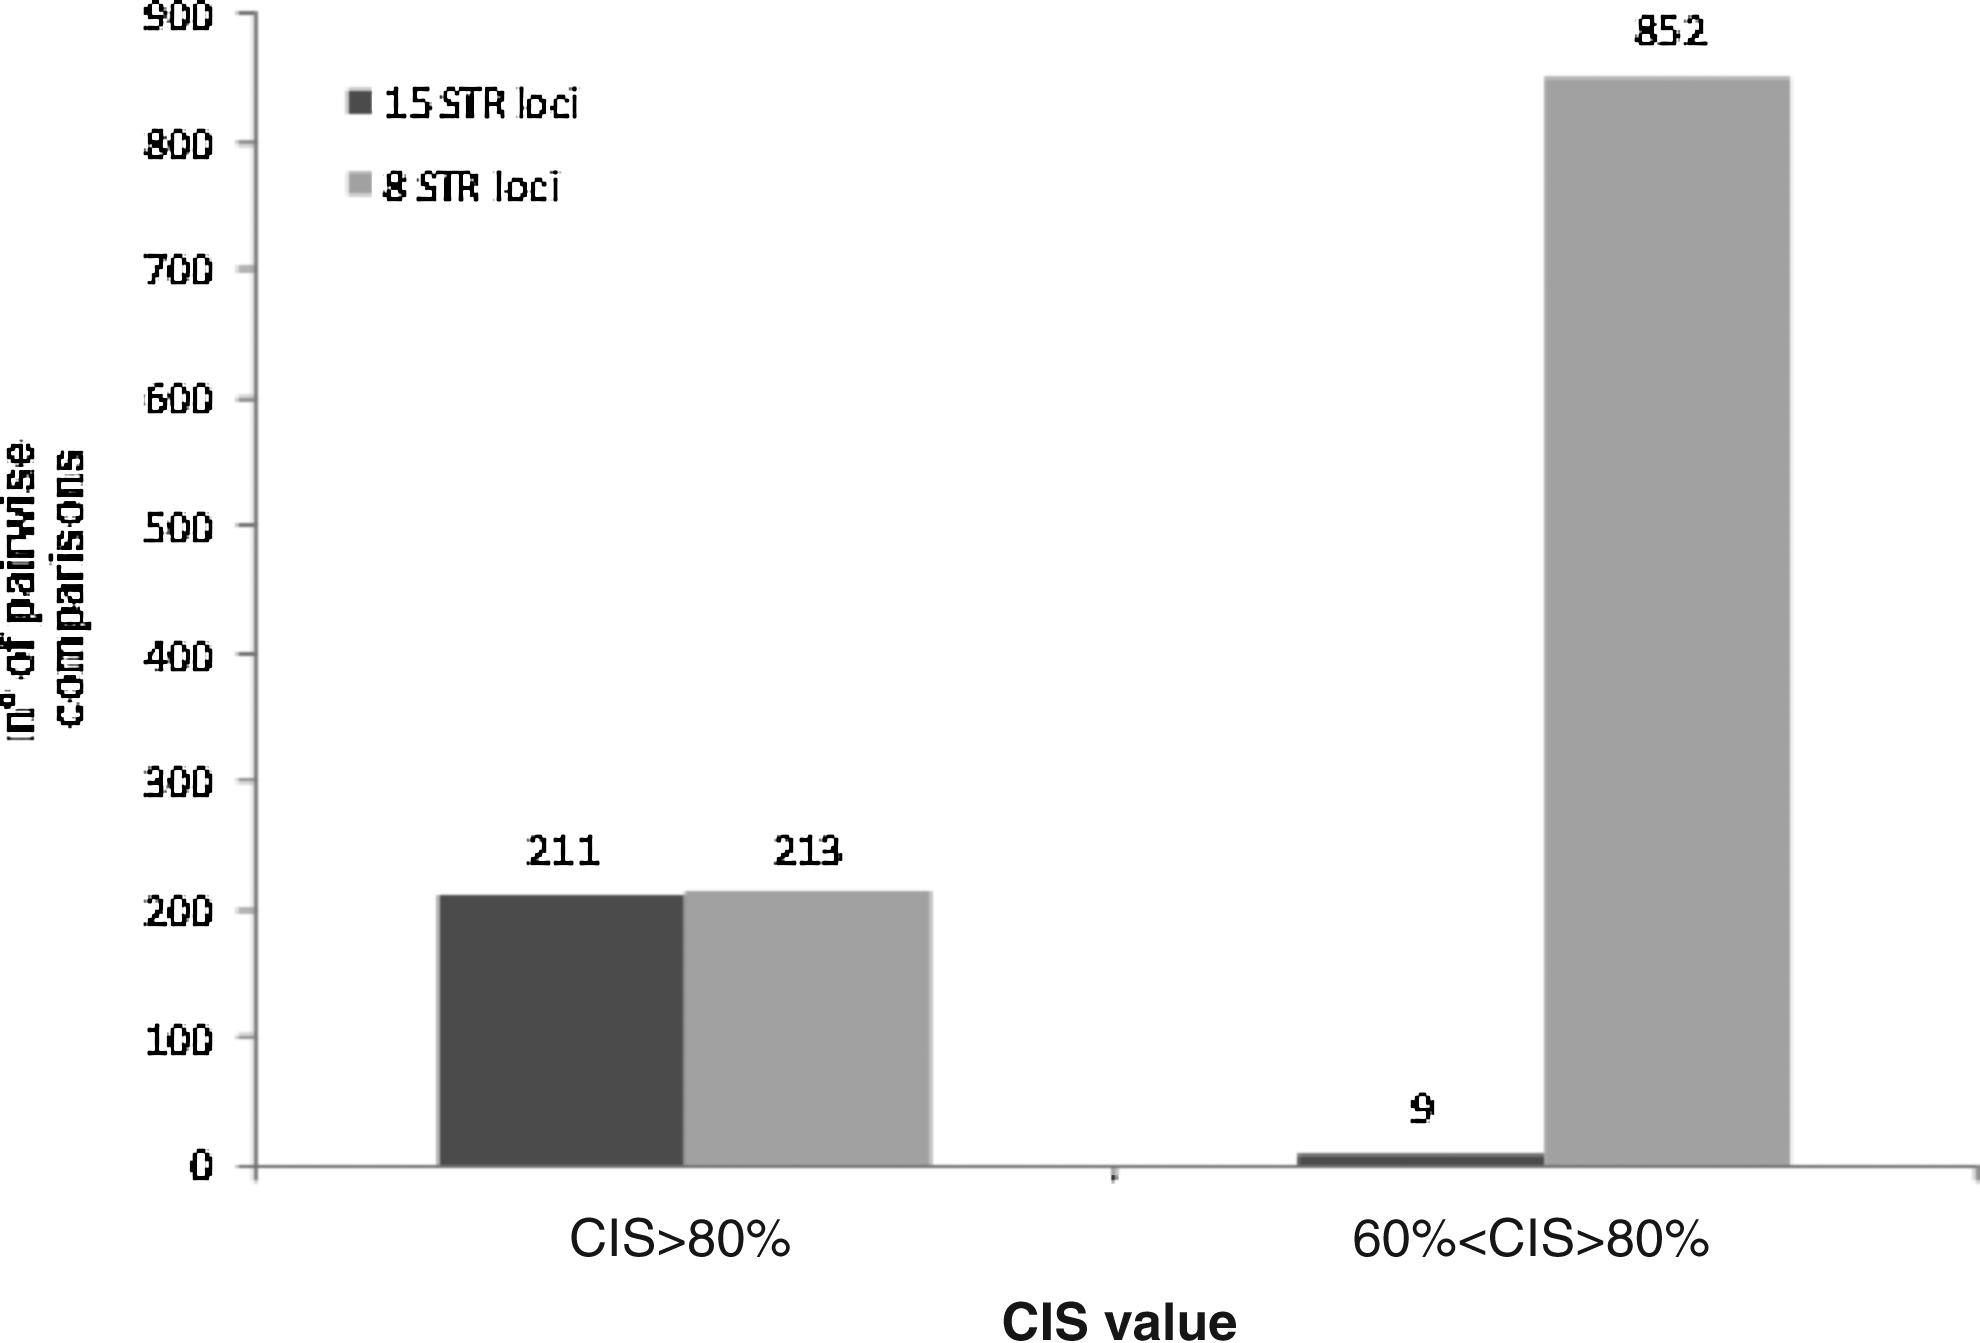
Comparison of CLIFF Identity Score (CIS) values computed for each pair of cell lines in our STR profile dataset using 15 or 8 STR loci. Histogram bars represent the sum of CIS values above the indicated thresholds, computed for all pairwise comparisons of 300×300 cell lines (for a total of 45,000 comparisons), using either 15 STR markers (dark grey) or just the 8 markers (light grey) used elsewhere (ATCC, DSMZ databases).
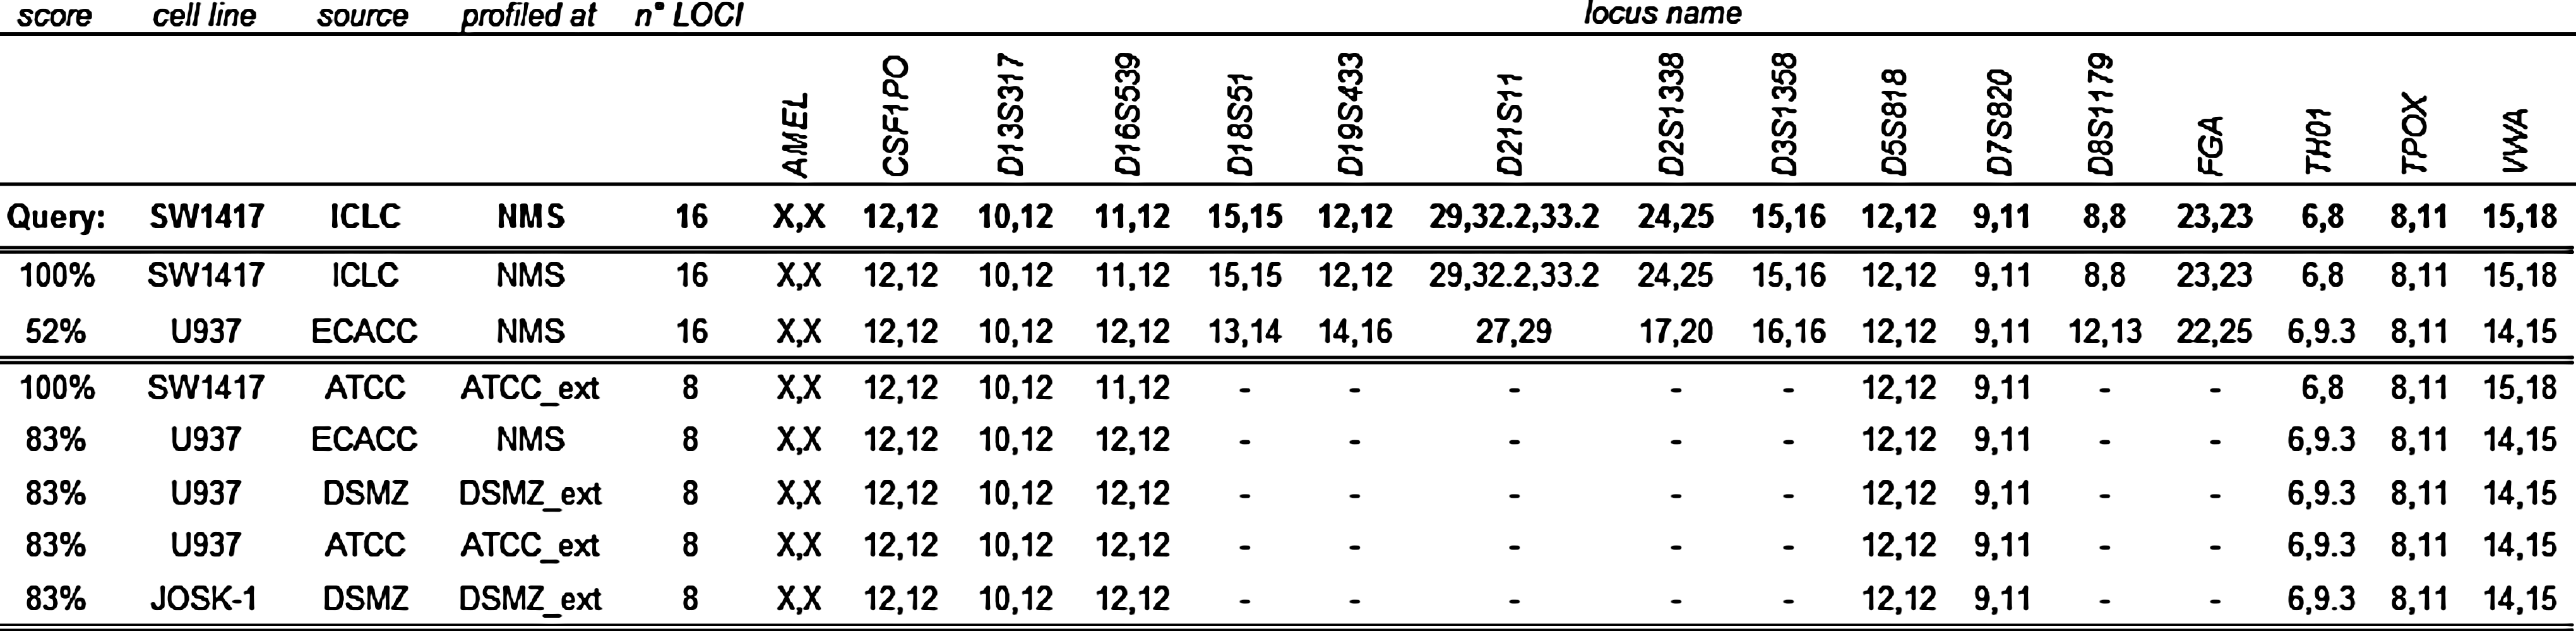
CIS values for the SW1417 cell line. The table provides the different CIS values computed for the SW1417 STR profile (15 loci+amelogenin) against our STR profile panel (300 cell lines, each profiled with 15 markers+amelogenin) or against the STR profiles supplied by DSMZ (8 STR loci+amelogenin). In particular, the U937 cell line profiled with 15+amelogenin markers is displayed, showing a low percent similarity (52%) only when all 16 markers are considered in the analysis.
Discussion
DNA profiling based on the analysis of highly polymorphic STRs is widely used for forensic applications. With increased availability and use of tumor cell lines in basic and applied research, accurate cell line authentication has emerged as a critical need to facilitate data sharing and interpretation.
Most cell line STR profiles reported so far are based on a limited number of loci, usually 8 plus amelogenin. As suggested by the ATCC-SDO Workgroup (ATCC-SDO, 2010), the analysis of an increasing number of STR loci can better assess the relatedness of cell lines subject to genetic drift or allele imbalances, as well as any mislabeling issues. A 15 loci profile was already used by Lorenzi et al. (2009) for the characterization of the 59 cancer cell lines of the NCI panel and, more recently, for the profiling of a panel of 39 glioma cell lines (Bady et al., 2012). In this work, the authors, using simulation procedures suggest that the higher number of markers provides superior discrimination of cell line identities and is sometimes essential to clarify ambiguous cases.
Here we report a large dataset comprising the STR profiling of 300 widely used tumor cell lines generated in parallel using 15 STR loci plus amelogenin.
To overcome the limitations in commonly used methods for STR profile comparison, we integrated our dataset in the user-friendly query tool (CLIFF), and we defined a CIS, which properly deals with the heterogeneous locus configurations typical of cancer cell lines. In combination with an extended set of loci, CIS allowed a consistent reduction of uncertainty in STR profile comparisons. Besides confirming and extending the previous knowledge, we could also correct erroneous classification of cell line pairs based on the 8 STR markers, such as the matched pair U251 and SNB19 correctly identified as having a common origin or the mistmatched U937 and SW1417 that were identified as different. Most importantly, we systematically showed that the use of a larger number of loci, together with the use of the CIS improved algorithm to deal with multiple allele calls, allows a better approximation to a binary false-true classification, as opposed to a continuum distribution that hampers a straightforward classification. Indeed, the application of a rigid threshold of 80% proved to be unfeasible with the algorithms used so far, since it would result in false negative matches. On the other hand, a more relaxed application of the cutoff introduces an element of subjectivity which, coupled with the technical variability observed for individual calls, leads to a gray area in the interpretation of the identity results. Therefore, we propose that STR profiling of tumor cell lines based on 15 loci plus amelogenin should become the standard for identity determination, and provide a large dataset and a flexible, easy to query, tool to facilitate this application.
Footnotes
Acknowledgments
Authors would like to acknowledge Andrea Milani and Giulia Masetti for technical support.
Author Disclosure Statement
No competing financial interests exist.