
Abstract
Background: Lung cancer is a leading cause of cancer mortality, and it shows a high incidence worldwide. Circulating microRNAs have been proposed as diagnostic indicators of lung cancer, but inconsistent results in the literature have prevented their widespread use in diagnosis. The present meta-analysis aimed to systematically evaluate the diagnostic accuracy of circulating microRNAs for lung cancer. Methods: Several research databases were searched systematically for studies of the accuracy of circulating microRNAs as diagnostic indicators of lung cancer. Results from different studies were pooled using random-effects models. Summary receiver operating characteristic (SROC) curves were used to assess the overall performance of microRNA-based assays. Results: Thirteen publications were included in the meta-analysis. The following summary estimates were obtained for the performance of circulating microRNAs in lung cancer diagnosis: sensitivity, 0.85 (95% confidence intervals [CI]: 0.83-0.87); specificity, 0.84 (95% CI: 0.81-0.86); positive likelihood ratio, 5.23 (95% CI: 3.75-7.29); negative likelihood ratio, 0.20 (95% CI: 0.14-0.27); and diagnostic odds ratio, 31.77 (95% CI: 16.98-59.42). The SROC curve indicated a maximum joint sensitivity and specificity of 0.85, with an area under the curve of 0.92. Conclusion: Circulating microRNAs show significant potential as diagnostic markers of lung cancer. The results of this meta-analysis justify larger, more rigorous studies to confirm such a diagnostic role.
Introduction
L
MicroRNAs are single-stranded RNA molecules of ∼19-22 nucleotides that regulate genes by either inducing mRNA degradation or inhibiting translation. They have been implicated in several cellular processes, including apoptosis, development, proliferation, and differentiation (Pritchard et al., 2012). Both in vivo and in vitro studies indicate that lung cancer involves dysregulation of microRNA expression. In fact, microRNAs have been implicated in nearly every carcinogenesis process of lung cancer, including tumor progression, angiogenesis, invasion, and metastasis (Qi and Mu, 2012). These studies have raised the possibility that microRNAs might provide insights into the pathophysiology of the disease.
Several studies have also suggested the possibility of using microRNAs to diagnose lung cancer. Expression profiles of circulating microRNA can be detected in the peripheral blood of patients with lung cancers (Chen et al., 2008; Cho, 2011; Lin and Yang, 2011; Heegaard et al., 2012). If circulating microRNAs can be shown to have a diagnostic value, it could significantly improve lung cancer identification and treatment, because a microRNA-based blood test would be minimally invasive, relatively inexpensive, and easily reproducible. In fact, several studies have been published on the potential diagnostic utility of circulating microRNAs in lung cancer, but they have given varying results. Therefore, we undertook a meta-analysis of the research literature to establish the overall accuracy of using circulating microRNAs as diagnostic markers of lung cancer.
Methods
The present meta-analysis was performed using the guidelines of the Preferred Reporting Items for Systematic Reviews and Meta-analysis (PRISMA) Statement and methods recommended by the Cochrane Diagnostic Test Accuracy Working Group (Leeflang et al., 2008; Moher et al., 2009).
Literature search and study selection
To identify studies that evaluate the use of circulating microRNAs to diagnose lung cancer, we searched in Pubmed (Medline), Embase, Web of Science, and the Cochrane database up to September15, 2012. The search terms were “lung cancer,” “microRNA,” “sensitivity” and “specificity.” We also manually searched the reference lists of eligible studies identified from the databases. Although no language restrictions were imposed on the search criteria, only English-language publications on human studies were included in the present meta-analysis.
Inclusion criteria
A study was included in the present meta-analysis if it met the following selection criteria: (1) it was a diagnostic study using circulating microRNAs for lung cancer; (2) the diagnosis of lung cancer was confirmed by histopathological or cytological examinations; (3) sufficient data were reported to allow the generation of a 2×2 table for calculating sensitivity and specificity.
Studies with fewer than 20 patients or without a control group were excluded to avoid a selection bias. Conference abstracts were excluded because of the limited data provided. Two authors independently screened the articles for inclusion. Disagreements between authors were resolved by consensus.
Data extraction and quality assessment
Two reviewers independently assessed the final set of articles. The following data were retrieved from the reports: the author, publication year, source of patients, diagnostic standard, sensitivity and specificity data, and microRNA expression profiles. In studies containing both a training group and a validation group, each group was treated as a single study in the meta-analysis.
The methodological quality of included studies was evaluated using the Quality Assessment for Studies of Diagnostic Accuracy (QUADAS) Tool (Whiting et al., 2006). This is an evidence-based approach to quality assessment intended for use in systematic reviews of diagnostic accuracy studies. A quality index is generated, with a maximum value of 14.
Statistical analyses
Standard methods recommended for meta-analyses of diagnostic accuracy studies were used (Devillé et al., 2002). All analyses were performed using two statistical software programs: Meta-DiSc for Windows (XI, Cochrane Colloquium, Barcelona, Spain) and Stata (version 12; Stata Corporation, College Station, TX). All statistical tests were two-sided, and significance was set at p<0.05.
The following measures of test accuracy, together with 95% confidence intervals (95% CIs) were calculated for each study: sensitivity, specificity, the positive likelihood ratio (PLR), negative likelihood ratio (NLR), and diagnostic odds ratio (DOR). The sensitivity and specificity for the single test threshold identified for each study was used to plot a summary receiver operating characteristic (SROC) curve (Walter, 2002; Jones and Athanasiou, 2005). Spearman rank correlation was used to test for threshold effects. The χ2 and Fisher's exact tests were used to assess heterogeneity across studies. A random-effects meta-analysis was carried out to take into account inter-study variability. Since a publication bias is a concern in meta-analyses of diagnostic studies, we tested for it using Deeks' funnel plots (Deeks et al., 2005).
Results
After systematic databases searches and manual review of reference lists in eligible studies, a total of 13 publications containing 18 studies on the diagnostic accuracy of circulating microRNAs in patients with lung cancer were considered eligible for inclusion in the present meta-analysis (Bianchi et al., 2011; Foss et al., 2011; Jeong et al., 2011; Leidinger et al., 2011; Li et al., 2011; Shen et al., 2011a, 2011b; Wei et al., 2011; Zheng et al., 2011; Chen et al., 2012; Hennessey et al., 2012; Ma et al., 2012; Wang and Zhang, 2012). Studies were excluded for primarily the following reasons: they were not diagnostic studies, they did not report sufficient data to construct a 2×2 table, or they contained less than 20 patients.
Quality of reporting and study design
The final set of 18 studies involved 2066 subjects, comprising 1187 patients with lung cancer and 879 controls. All studies were published from 2011 or 2012. In all included studies, lung cancer was diagnosed based on a histopathological or cytological examination, considered the gold standard for diagnosis. All studies used the polymerase chain reaction assay to determine microRNA expression profiles. Of the 13 included publications, 9 had QUADAS scores ≥10. Table 1 provides a clinical summary of each study and the QUADAS scores for each publication.
Detailed lists of profiled microRNAs are provided in the original articles.
LC, lung cancer; PCR, polymerase chain reaction; miR, microRNA; TP, true-positive; FP, false-positive; FN, false-negative; TN, true-negative; QUADAS, Quality Assessment for Studies of Diagnostic Accuracy.
Diagnostic accuracy
Forest plots of the sensitivity and specificity of microRNA assays for diagnosing lung cancer are shown, respectively, in Figures 1 and 2. The following pooled parameters were calculated over all 18 studies: sensitivity, 0.85 (95% CI: 0.83-0.87); specificity, 0.84 (95% CI: 0.81-0.86); PLR, 5.23 (95% CI: 3.75-7.29); NLR, 0.20 (95% CI: 0.14-0.27); and DOR, 31.77 (95% CI: 16.98-59.42). All five performance indices showed high χ2 values (p<0.05 in all cases): sensitivity, 80.30; specificity, 56.12; PLR, 65.79; NLR, 73.74; and DOR, 80.57. This suggests substantial heterogeneity among the studies.

Forest plot of sensitivity of circulating microRNAs for the diagnosis of lung cancer. The point estimates of sensitivity from each study are shown as solid circles. Error bars indicate 95% confidence intervals (CIs).

Forest plot of specificity of circulating microRNAs for the diagnosis of lung cancer. The point estimates of specificity from each study are shown as solid circles. Error bars indicate 95% CIs.
Figure 3 shows a plot of the rate of true positives as a function of the rate of false positives of individual studies, as well as the corresponding SROC curve. As a global measure of test efficacy across all studies, we determined the Q-value, defined as the point of intersection of the SROC curve with a diagonal line extending from the left upper corner to the right lower corner of the ROC space. The Q-value corresponds to the highest joint value of sensitivity and specificity for the diagnostic test. This point does not indicate the only or even the best combination of sensitivity and specificity for a particular clinical setting, but it does provide an overall measure of the discriminatory power of the diagnostic test. The Q-value for the studies in our meta-analysis was 0.85. The area under the curve (AUC) was 0.92, indicating a high overall accuracy.

Summary receiver operating characteristic (SROC) curve of circulating microRNAs for the diagnosis of lung cancer. The size of each solid circle represents the size of each study in the meta-analysis. The regression SROC curve indicates the overall diagnostic accuracy.
Subgroup analysis: assays based on microRNAs in serum or plasma
Of the 18 studies, 10 tested microRNAs in serum, while 5 tested microRNAs in plasma. We conducted a subgroup analysis to identify whether one type of assay gave a better diagnostic accuracy than the other. The pooled sensitivity, specificity, PLR, NLR, and DOR for the two groups are listed in Table 2. For serum specimens, the maximum joint sensitivity and specificity were 0.84, and AUC was 0.91; for plasma specimens, the corresponding values were 0.77 and 0.83. The SROC curve for the two groups plotted against each other is shown in Figure 4. These results suggest that serum is a better matrix for diagnostic profiling of microRNAs in lung cancer.

SROC curve of serum and plasma microRNAs for the diagnosis of lung cancer. The size of each solid circle represents the size of each study included in the present meta-analysis. The regression SROC curve indicates the overall diagnostic accuracy.
CI, confidence interval; PLR, positive likelihood ratio; NLR, negative likelihood ratio; DOR, diagnostic odds ratio; AUC, area under the curve.
Publication bias
The Deeks' funnel plot asymmetry test was used to evaluate the final set of studies for potential publication bias. The slope coefficient was associated with a p-value of 0.94, suggesting symmetry in the data and a low likelihood of publication bias (Fig. 5).
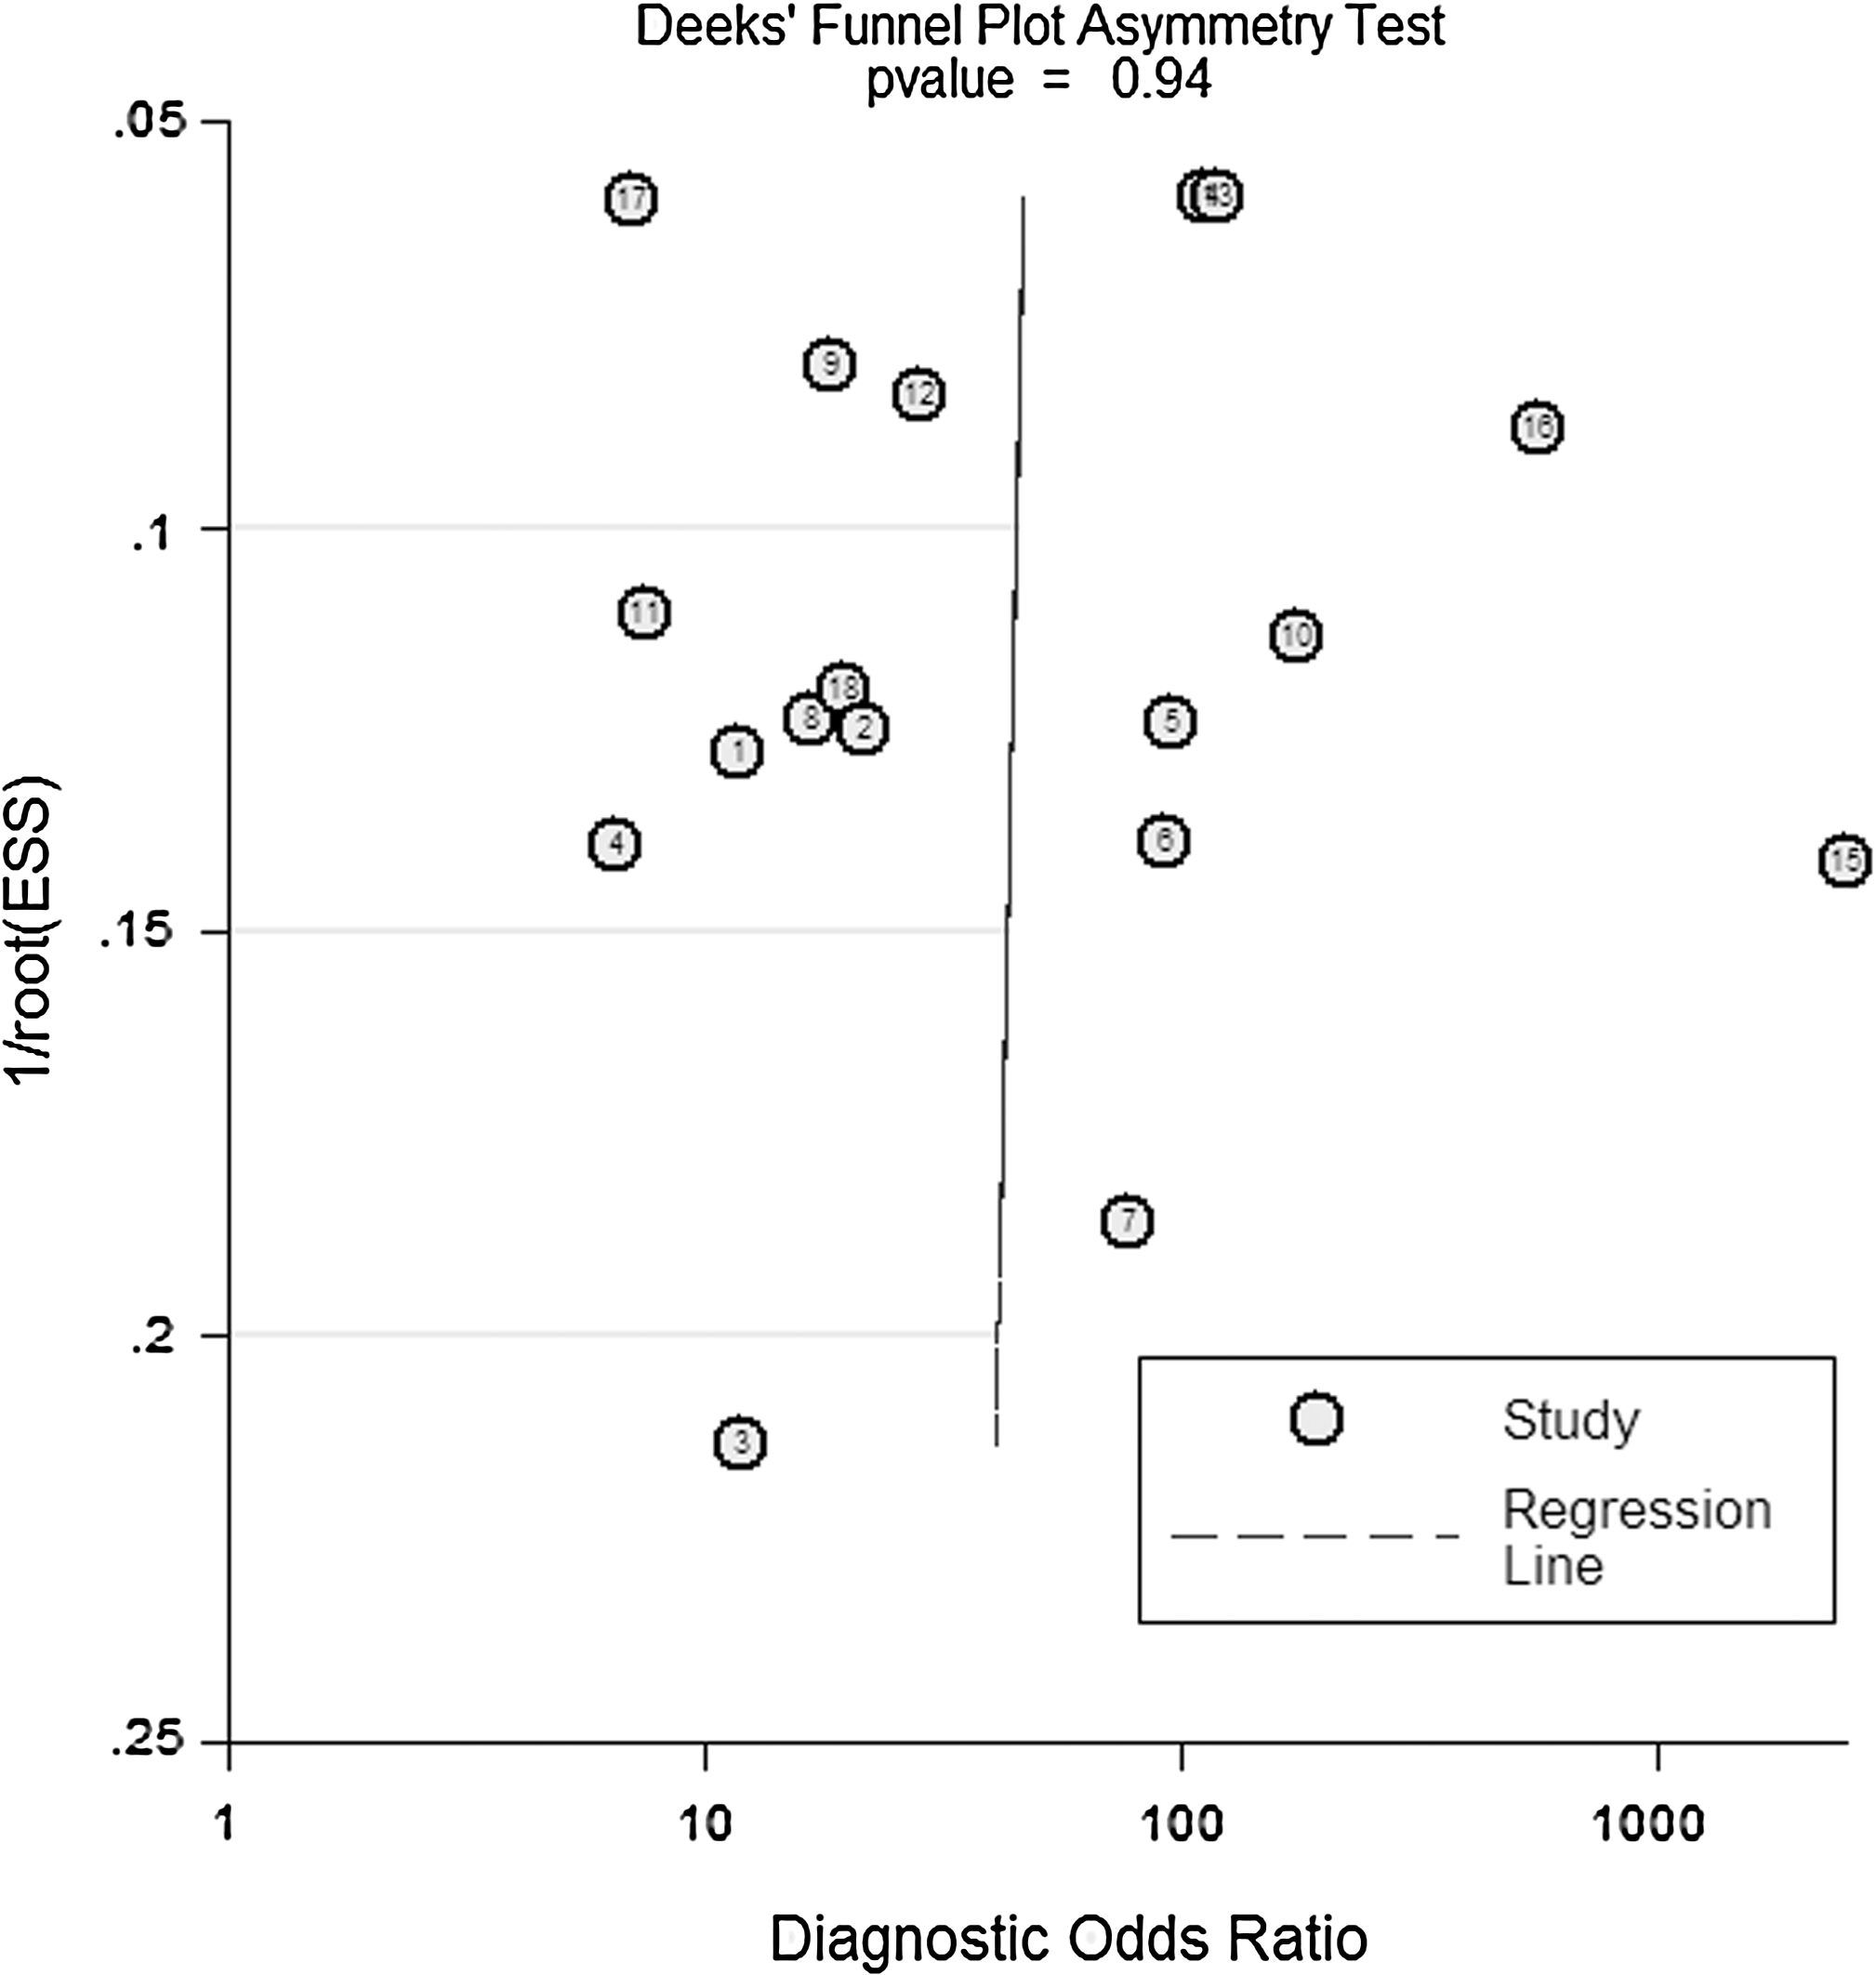
Linear regression test of funnel plot asymmetry. The statistically nonsignificant p-value of 0.94 for the slope coefficient suggests symmetry in the data and a low likelihood of publication bias.
Discussion
Lung cancer remains a leading cause of cancer mortality worldwide and it has a low overall 5-year survival rate. The low survival rate is attributed to late diagnosis: 75% of patients already have advanced and inoperable disease by the time it is discovered. Options for using imaging analysis and biomarker-based tests for early screening of lung cancer remain limited. Computed tomography (CT), for instance, produces a high false positive rate of 96.4%, which is likely to hinder the adoption of CT for population screening. In addition, questions about the cost-effectiveness of CT-based lung cancer screening remain unanswered (Bach et al., 2007; Welch and Black, 2010). Several tumor markers have been studied extensively as possible diagnostic indicators, but none has proven to have both high sensitivity and high specificity (Lu et al., 2010). The present meta-analysis suggests that circulating microRNAs may serve as diagnostic indicators of high sensitivity (0.85, 95% CI: 0.83-0.87) and medium specificity (0.84, 95% CI: 0.81-0.86). These findings suggest that circulating microRNAs may represent a new milestone in early lung cancer diagnosis.
The SROC curve presents a global summary of the test performance, and it shows the trade-off between sensitivity and specificity (Walter, 2002; Jones and Athanasiou, 2005). Our SROC analysis showed a maximum joint sensitivity and specificity of 0.85, and an AUC of 0.92, suggesting high overall accuracy. DOR, defined as the ratio of the odds of a true-positive to the odds of a false-positive, is a single indicator of diagnostic test accuracy that combines the sensitivity and specificity data into a single number (Glas et al., 2003). The value of a DOR ranges from 0 to infinity, with higher values indicating a better discriminatory test performance (higher accuracy). A DOR of 1.0 indicates that a test does not discriminate between patients with the disorder and those without it. In our meta-analysis, the mean DOR was 31.77, indicating that microRNA assays seemed to be helpful in the diagnosis of lung cancer. However, the SROC curve and the DOR are not easy to interpret and use in clinical practice, and the likelihood ratios are considered more clinically meaningful. Therefore, we also determined the PLR and NLR of microRNA assays to obtain a more comprehensive picture of their diagnostic accuracy (Deeks and Altman, 2004). The PLR value of 5.23 suggests that patients with lung cancer have an approximately fivefold higher chance of giving a positive microRNA test result than do patients without lung cancer, but this PLR is still lower than 10, considered the threshold for reliability (Deeks and Altman, 2004). At the same time, the pooled NLR was found to be 0.20, indicating that a negative microRNA test result is 20% likely to be a false-negative, which is not low enough to rule out lung cancer (Deeks and Altman, 2004).
Our findings clearly demonstrate the potential of these microRNAs to be a cost-effective, noninvasive diagnostic test or even a screening test for lung cancer. There are several advantages to using circulating microRNAs to diagnose lung cancer. A microRNA-based test would allow comprehensive analysis of tumors without invasive procedures, such as lung biopsy or surgical exploration. Sample collection and processing would be relatively inexpensive and simple. Such a test could offer a greater sensitivity and specificity than other diagnostic approaches, because it examines a panel of circulating microRNAs rather than a single one.
In addition to providing diagnostic information, analysis of circulating microRNAs can provide detailed, personalized information about patients with lung cancer. Lung cancer therapies targeting specific cellular alterations have recently been developed; these require that the lung cancer in a given patient be characterized in as much detail as possible. Defining the subtype of lung cancer is of great importance for therapy, and microRNAs may help accurately classify lung cancer. For example, Bishop et al. (2010) reported 100% concordance between the diagnosis established by conventional methods and the diagnosis established by microRNA-based methods in patients with non-small-cell lung carcinomas (NSCLCs). Incorporating microRNA analysis into clinical trials may help clarify the relationship between tumor cell differentiation and clinical end points in lung cancer, improving our ability to individualize therapy (Bishop et al., 2010). Tests based on microRNA may also provide information about cancer chemosensitivity. Plasma microRNA-21 levels, in addition to serving as a circulating tumor biomarker for early diagnosis of NSCLC, are related to cancer sensitivity to platinum-based chemotherapy (Wei et al., 2011). Finally, microRNAs may serve as prognostic biomarkers in lung cancer patients. For example, microRNA-21 is expressed at significantly higher levels in NSCLC tissue than in paired nonmalignant tissue, and this overexpression is associated with prognosis (Markou et al., 2008). Additional microRNAs have also been suggested as prognostic indicators in lung cancer (Hu et al., 2010; Boeri et al., 2011). In this way, microRNAs may turn out to be useful not only for diagnosing lung cancer, but also for characterizing its tissue type and for predicting chemosensitivity and prognosis, which will improve the comprehensive management of lung cancer patients.
As the present meta-analysis shows, microRNA-based assays have a long way to go before they can be applied in the clinic. For one thing, expression profiling of circulating microRNAs has not been systematically investigated; there was very little overlap among the microRNAs profiled in the 13 publications in this review. Further work should aim to identify the microRNA combinations that provide an optimal diagnostic accuracy. Optimization studies are also needed to determine the best medium from which to isolate the microRNAs, as well as the most appropriate technique for isolating them. There is not even consensus on the best normalization control to use (Heneghan et al., 2010). All these optimization and validation studies are critical for developing microRNA-based assays that can improve lung cancer diagnosis and management.
In summary, circulating microRNA assays show a significant process as diagnostic indicators in lung cancer. In the near future, assays based on circulating microRNAs may prove useful as a noninvasive confirmatory test to complement current screening procedures and as a rapid clinical test to guide the comprehensive management of patients with lung cancer.
Footnotes
Acknowledgments
This work was supported by grants 30971327 and 31171103 from the National Natural Science Foundation of China and grants 00-722 and 06-834 from the China Medical Board of New York to Dr. Fuqiang Wen. We are indebted to the authors of the primary studies included in this meta-analysis; without their contributions, this work would not have been possible. In addition, we are grateful to Armando Chapin Rodríguez, PhD and to Miss Jing Lin for kindly giving suggestions on how to revise the manuscript.
Author Disclosure Statement
No competing financial interests exist.