
Abstract
Aims: Microarray data were analyzed using bioinformatic tools to screen marker genes of human mesenchymal stem cells (hMSC) in response to bone morphogenetic protein 6 (BMP6). Results: A total of 190 differentially expressed genes were identified. The interaction network was divided into three functional modules. These genes were connected with BMP signaling pathways and regulation of cell processes, while NOG and BMPR2 participated in the transforming growth factor-beta signal pathway. Besides, several related small molecules were acquired. Conclusion: Marker genes in osteogenic responses to BMP6 treatment for hMSC were screened with microarray data along with elaborate function analysis by bioinformatics. NOG and BMPR2 showed potential to become indicators to monitor the directed differentiation of hMSC into osteoblasts, which can be used for bone disease treatment. Moreover, small molecules such as W-13 were retrieved and provided directions for future drug design.
Introduction
O
Several researchers have explored the expression pattern of known markers (Gonzalez et al., 2007; Riekstina et al., 2009). Gonzalez et al. (2007) had demonstrated that general pluripotent markers such as Oct-4, Nanog, Sox-2, and SSEA-4 existed in human second-trimester MSCs. In addition, some novel markers were also discovered, such as W5C5 (Masuda et al., 2012) and Stathmin-like 2 (Chiellini et al., 2008). Bae et al. (2011) combined transcriptome data and proteome data to screen new markers and suggested that TM4SF1 (transmembrane 4 L6 family member 1) can serve as a surface protein marker to identify hMSCs. Although some advances have been achieved, the knowledge was far from sufficient to support practical application.
High-throughput screening with microarray data is a potent way to discover new markers. Bone morphogenetic proteins (BMPs) can strongly stimulate mesenchymal bone progenitor cell differentiation into mature osteoblasts (Lories et al., 2006) and are, thus, involved in bone formation (Yoon et al., 2005). They are acidic glycoproteins that are widely present in bone matrix and which belong to the transforming growth factor β (TGF-β) superfamily. Therefore, BMP6 stimulation favors identification of markers in the early phase of hMSC differentiation into osteoblasts (Jeon et al., 2006). Based on the earlier considerations, we compared microarray data for hMSC samples treated with BMP6 and that for untreated hMSC samples to obtain differentially expressed genes and then performed function analysis to further characterize them.
Materials and Methods
Microarray data
Dataset GSE13604 (Luo et al., 2009) was downloaded from Gene Expression Omnibus database. The dataset contains a total of four gene chip measurements from duplicate experiments, each with paired measurements of hMSC with or without 8 h BMP6 treatment. The platform used to collect the microarray data was GPL570 [HG-U133_Plus_2] Affymetrix Human Genome U133 Plus 2.0 Array. Probe annotations were provided by Affymetrix, including all Affymetrix ATH1 (25K) chip probe. Both raw data and the probe annotations were collected.
Screening of differentially expressed genes
Raw data were first transformed to a recognizable expression profiling format, and then, the missing data were filled in (Troyanskaya et al., 2001). After normalization (Fujita et al., 2006), package limma (Smyth, 2005) in R language was utilized for statistical analysis. p-value<0.05 and | log FC |>1 were set as the cutoff criteria to screen the differentially expressed genes.
Establishment of interaction network
Uncovering the interactions between proteins is the basis for understanding their functions and regulation mechanisms. Therefore, software HitPredict was utilized to establish the interaction network for protein products of all the differentially expressed genes.
HitPredict collects protein-protein interactions from IntAct, BIOGRID, and HPRD database by high-throughput or small-scale experiments. It also includes predicted interactions according to the score, integrating information-like sequence, structure, and function using a Bayesian algorithm (Patil et al., 2011). Interactions obtained from experiments or with a score >1 are considered of high confidence (Patil and Nakamura, 2005), based on which we identified the interaction relationships and applied Cytoscape (Duncan et al., 2010) to visualize the network.
Function annotation
The plugins Mcode of Cytoscape (Goldberg et al., 2007) (cutoff: the degree of each node in the module >2) and Bingo (Bernstein et al., 2012) were used for module division and annotation based on the hypergeometric distribution (corrected p-value <0.05). Pathway enrichment analysis was also performed with FuncAssociate (Berriz et al., 2009) for the differentially expressed genes, and a p-value of <0.05 was set as the cutoff criterion.
Screening of related small molecules
The Connectivity Map (CMap) is a collection of transcriptional expression data and pattern-matching algorithms that together enable the discovery of function associations between drugs, genes, and diseases (Lamb et al., 2006; Lamb, 2007; Wen et al., 2011). Genes were divided into two groups: up-regulated and down-regulated, and then, they were analyzed separately by CMap. Those with a correlation score (| score |) >0.8 were retained.
Results
Differentially expressed genes
Microarray data were preprocessed and normalized (Fig. 1). A total of 190 differentially expressed genes were identified according to the criteria (p<0.01 and | logFC |>1), including 87 down-regulated genes and 103 up-regulated genes (Supplementary Table S1; Supplementary Data are available online at www.liebertpub.com/gtmb).
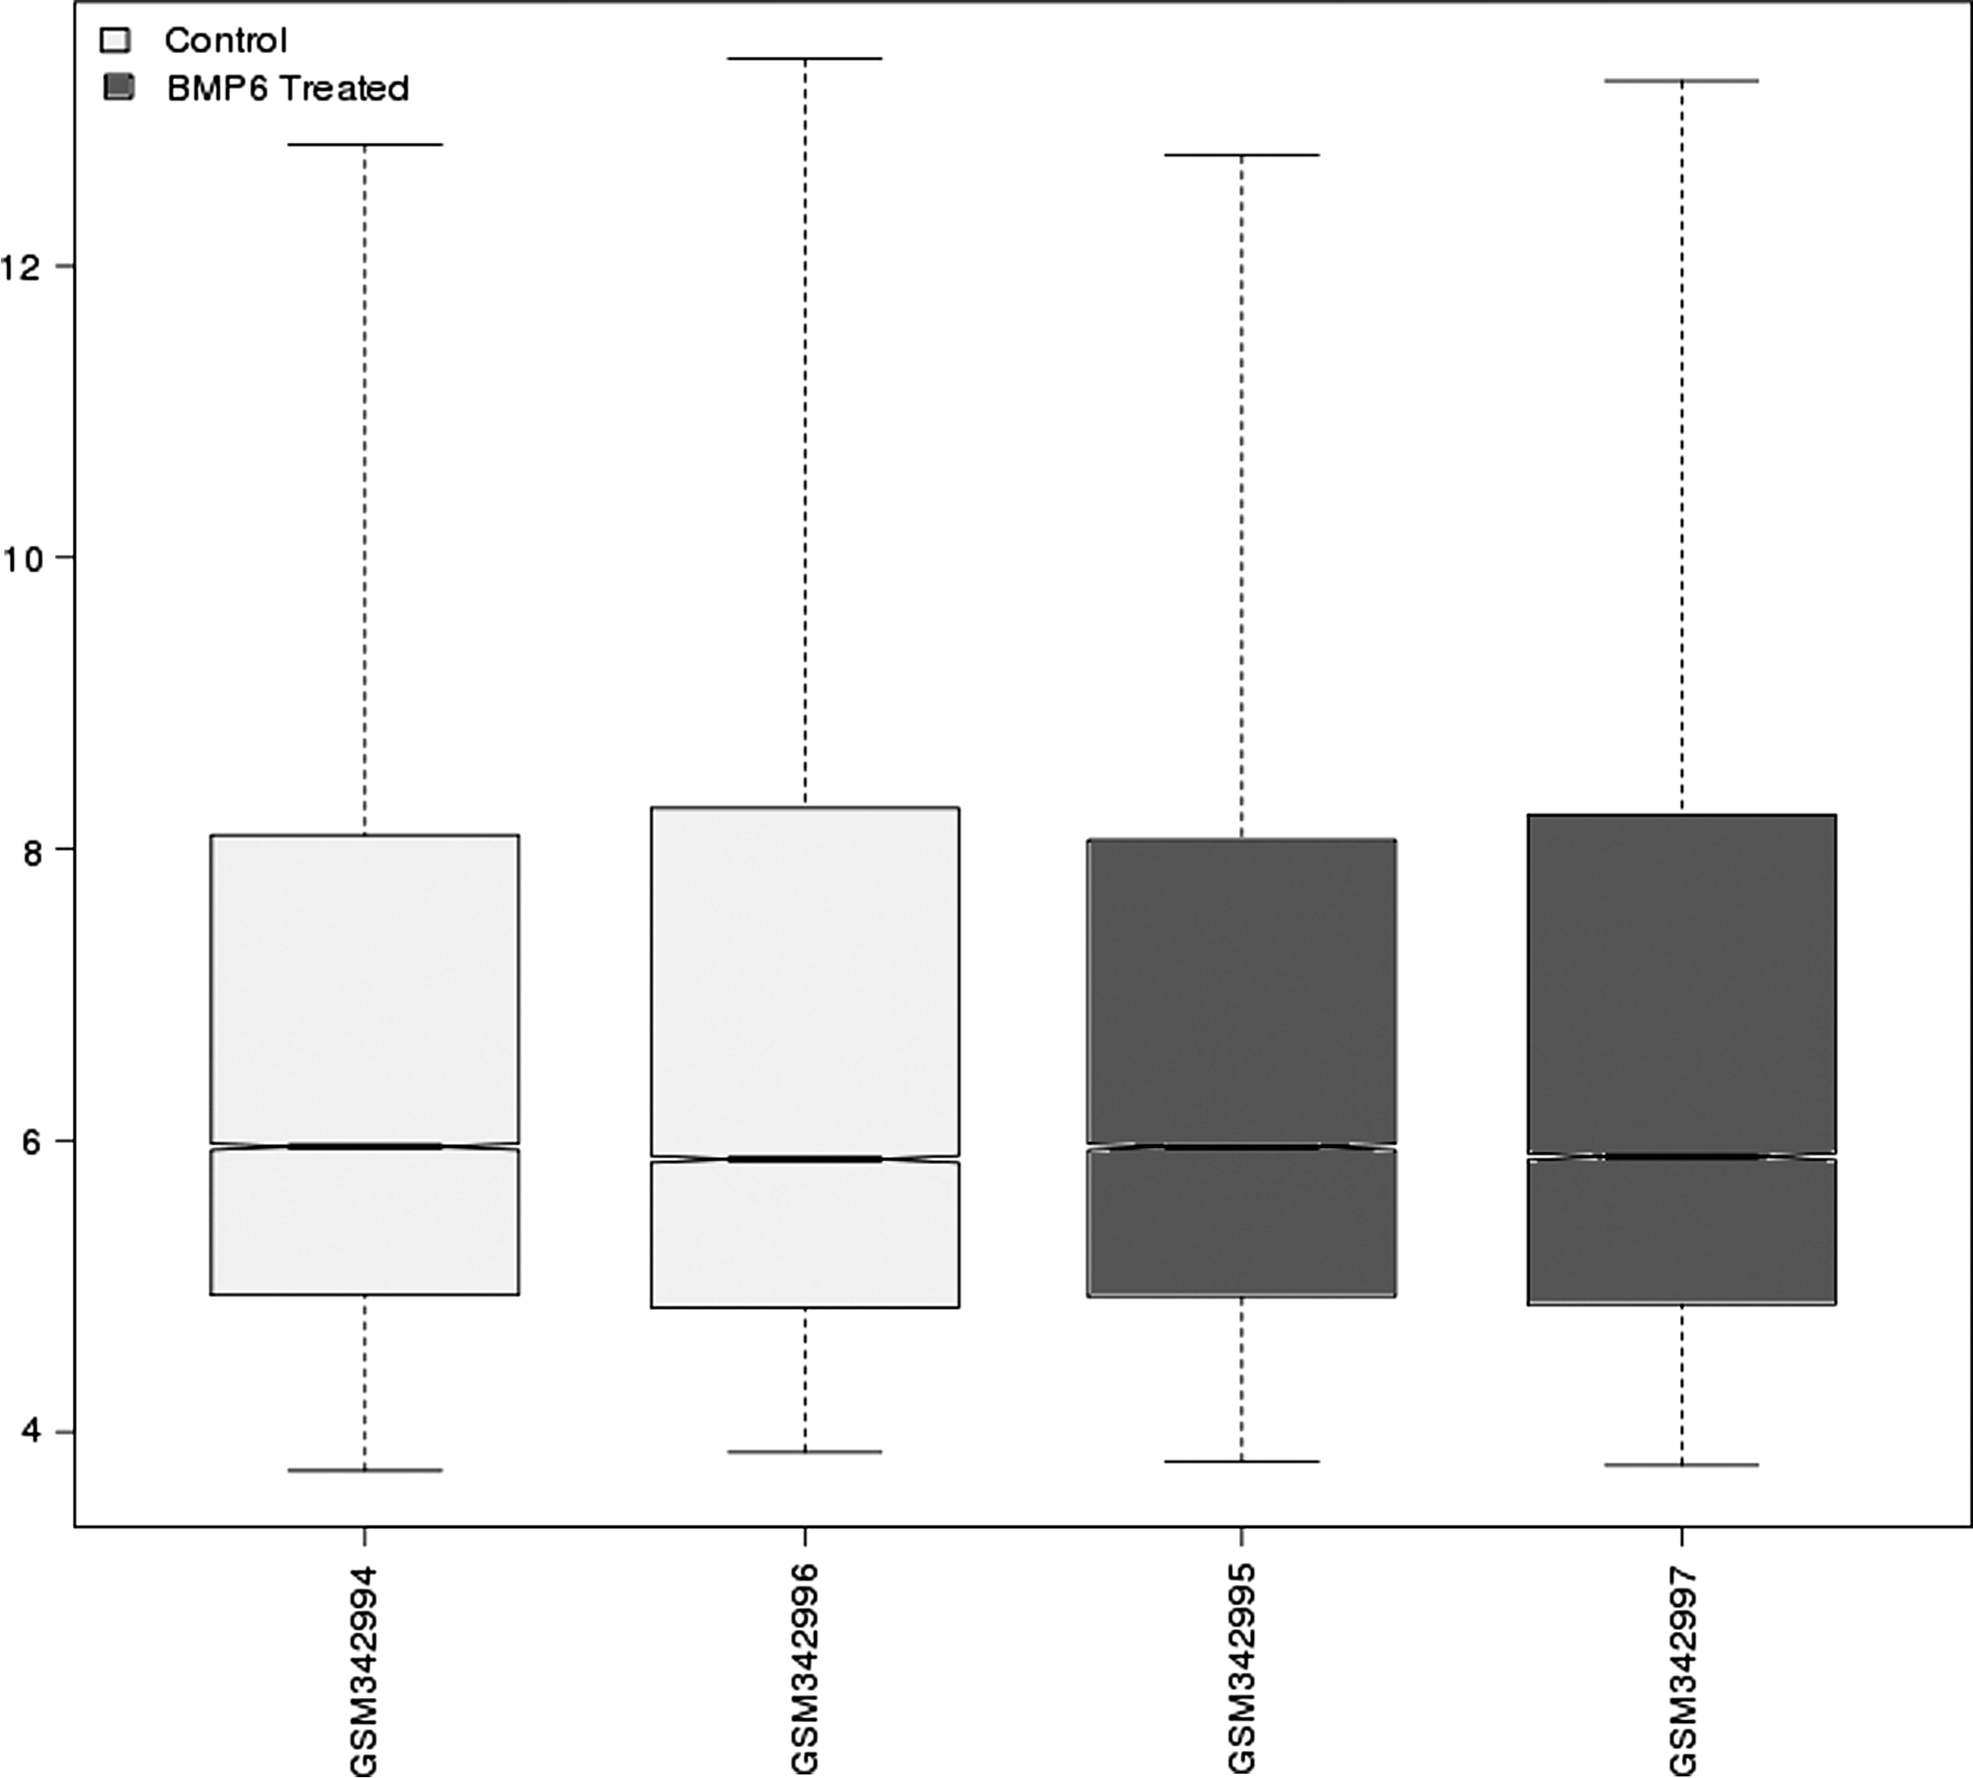
Box plots for normalized microarray data. The two gray boxes represent normal human mesenchymal stem cells (hMSCs) samples, and the two black boxes represent bone morphogenetic protein 6 (BMP6)-stimulated hMSCs samples. The black line in the box is the median of each data. The black lines are almost on the same line, indicating good effectiveness of normalization.
Function analysis results
A total of 395 pairs of interactions for all the differentially expressed genes were identified from HitPredict (Supplementary Table S2). Three modules were generated containing 8, 13, and 5 genes (Fig. 2), corresponding to 17, 10, and 5 functions (Tables 1, 2 and 3), respectively. As shown in Table 1 to Table 3, the most enriched functions were BMP signaling pathway and regulation of cellular process, respectively.
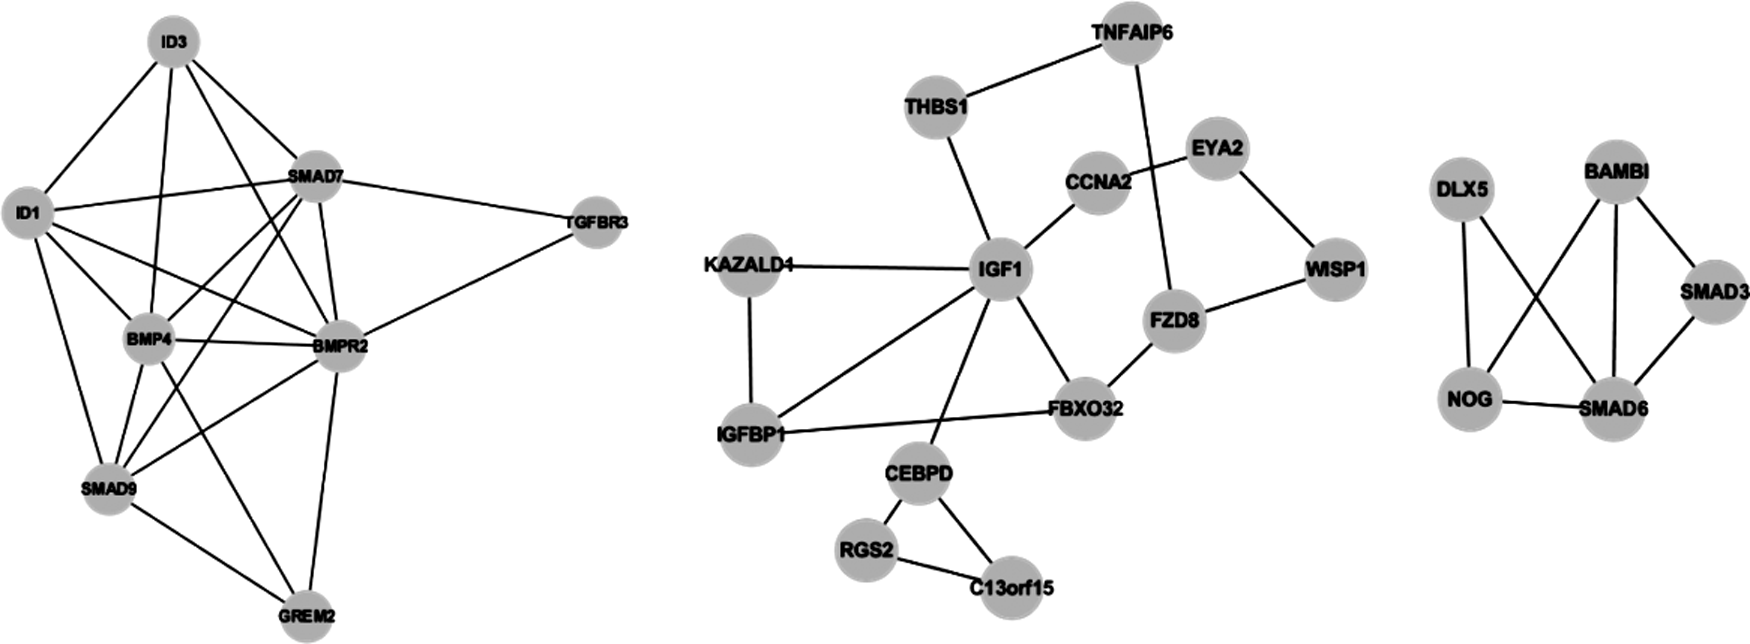
Three different modules of interaction network for the differentially expressed genes.
BMP, bone morphogenetic protein.
FuncAssociate is a web-based tool that will return a list of over- or under-represented pathways. Annotations with p<0.05 were regarded as significant in this study. All the differentially expressed genes were analyzed by the software, and the pathway involving NOG and BMPR2 was identified: TGF-beta signaling pathway (Fig. 3).
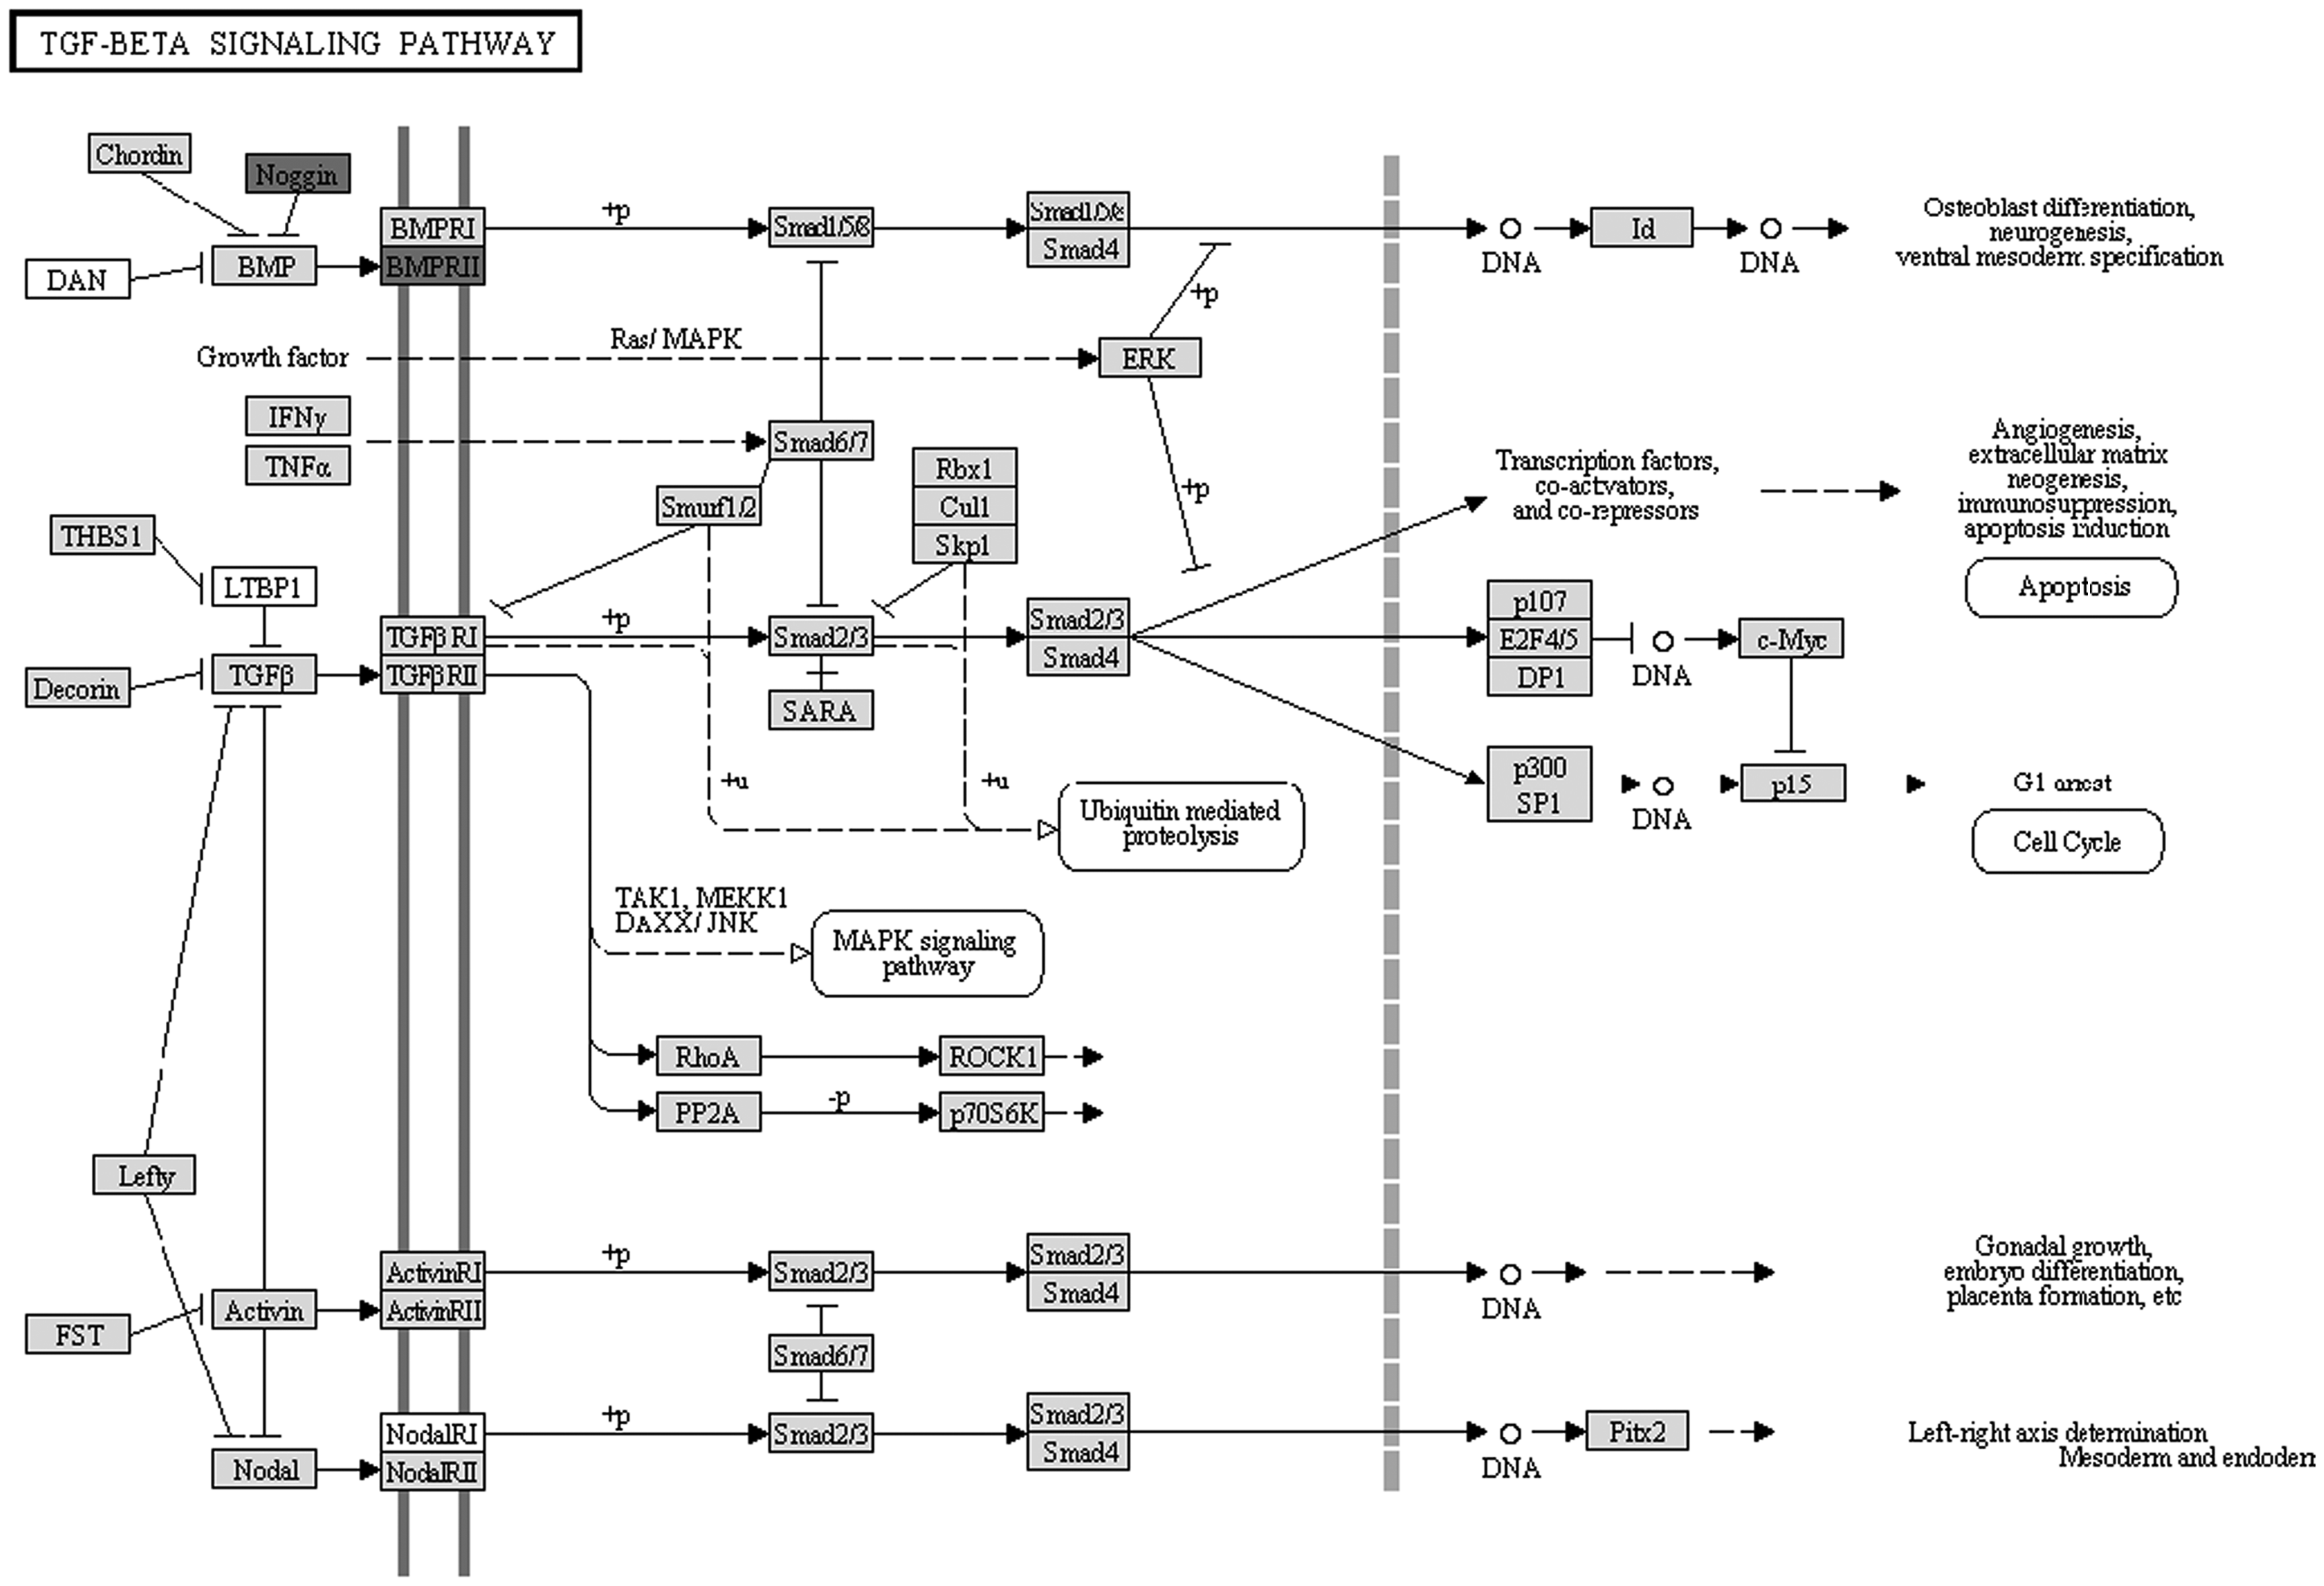
KEGG pathway map for genes in the three modules. The dark box indicates the differentially expressed genes.
Related small molecules
A total of 10 small-molecule drugs were recorded as | score |>0.8 (Table 4), in which W-13 had the highest correlation (0.88723).
CMap, Connectivity Map.
Discussion
We compared microarray data for hMSC samples treated with BMP6 versus untreated hMSC samples (as control) and screened out a total of 190 differentially expressed genes. These genes were divided into three modules, while the most enriched functions were BMP signaling pathway and regulation of cellular process. Pathway annotation was also performed, and the TGF-beta signaling pathway was identified, which contained Noggin (NOG) and BMP receptor type II (BMPR2).
It is not strange that the BMP signaling pathway is significantly enriched, as samples were treated with BMP6. However, it is worthy of note. The BMP signaling pathway is involved in many processes, including cell growth, cell differentiation, apoptosis, and other functions. Previous researchers have demonstrated the involvement of the BMP signaling pathway and TGF-beta signaling pathway in osteoblast differentiation and bone formation (Marie, 1997; Origuchi et al., 1998; Chen et al., 2012). NOG is a BMP antagonist that is induced by BMP (Gazzerro et al., 1998). Okamoto et al. (2006) found that over-expression of NOG would cause increased bone volume associated with decreased bone formation and decreased osteoclast number. Further, Gerhart et al. (2011) demonstrated that NOG is a essential regulator for BMP signaling in the early epiblast. However, a recent study pointed out that it was a novel inducer of MSC adipogenesis (Sawant et al., 2012). BMPR2 is a serine/threonine receptor kinase that can bind to BMPs. Several papers have explored the association of BMPR2 mutation with primary pulmonary hypertension (Arbustini et al., 2008; Fu et al., 2008; Rubin, 2008). Recently, one study found that it was necessary for signal transduction and osteogenic differentiation of human adipose-derived MSCs (Zeng et al., 2012). Therefore, we could say that the differentially expressed genes identified in this study are really involved in the regulation of hMSC osteogenic differentiation, especially NOG and BMPR2.
Considering that there would be practical value to develop molecules directing the differentiation process, we retrieved several small molecules from the CMap database, among which W-13 showed the highest correlation with the gene-expression changes in hMSC treated with BMP6. W-13 is a calmodulin antagonist that inhibits the growth of tumor cells (Wei et al., 1983; Strobl and Peterson, 1992). Although the connections between these molecules and hMSC's directed differentiation was not discovered, it provides certain guidelines for future developments.
Footnotes
Acknowledgments
This work was supported by a grant from the National Natural Science Foundation of China (No. 81200415) and a grant from the PhD Programs Foundation of the Minstry of Education of China (No. 20090071120020).
Author Disclosure Statement
The authors state that there are no conflicts of interest, including specific financial interests, relationships, and affiliations, which are relevant to the subject of this article.
References
Supplementary Material
Please find the following supplemental material available below.
For Open Access articles published under a Creative Commons License, all supplemental material carries the same license as the article it is associated with.
For non-Open Access articles published, all supplemental material carries a non-exclusive license, and permission requests for re-use of supplemental material or any part of supplemental material shall be sent directly to the copyright owner as specified in the copyright notice associated with the article.