




Abstract
Aim: To evaluate the use of real-time quantitative PCR (qPCR) as a diagnostic tool for follow up of abnormal microarray (aCGH) results. Method: qPCR was performed on 207 samples with known aCGH results to detect chromosomal abnormality and determine the capability of qPCR. Eighty-four samples were processed and the results compared with the original aCGH result and with one or more of the alternative follow-up methods: aCGH, fluorescence in situ hybridization (FISH), or karyotyping. A separate cohort of 107 samples was used to determine critical threshold values for qPCR. A further 16 samples were assessed in reproducibility and sensitivity studies. Results: All qPCR findings were consistent with the original aCGH results, and qPCR was found to be a superior follow-up method compared to FISH and karyotyping. Critical threshold values were also determined from this study. Conclusion: In this study, qPCR analysis identified all copy number changes. qPCR is an accurate, rapid, reliable, and inexpensive technique for confirming copy number changes, and for determining the inheritance of such abnormalities to aid interpretation of results. We also present the critical threshold values required for qPCR as a practical tool. This technique has now been successfully implemented as part of the clinical diagnostic service within our laboratory.
Introduction
Various strategies have been described for follow-up analysis, including repeat aCGH testing, fluorescence in situ hybridization (FISH), microsatellite analysis, and multiplex ligation-dependent probe amplification (MLPA) for specific genes (Sebat et al., 2007; Schluth et al., 2008; Siggberg et al., 2010).
Repeat aCGH testing of all abnormal findings, and aCGH testing of parental samples for inheritance studies adds significantly to the cost of the service and may also result in incidental findings in the parents, potentially requiring further investigation. Traditionally, this follow-up work would be performed by FISH analysis, however, this technique is also costly and time-consuming. It has the advantage of giving positional information (e.g., excluding or confirming balanced rearrangements in parents), but this approach requires cell culture, whereas real-time quantitative PCR (qPCR) is performed on the same DNA sample as that used for the original aCGH analysis. In addition, some regions of imbalance detected by aCGH are too small to be followed up by routinely available FISH probes and FISH is also unreliable for detecting copy number gain. MLPA is high in cost and it is difficult to develop new MLPA-based assays.
Weksberg et al. (2005) presented a qPCR approach for the detection of chromosomal microdeletions and microduplications in patients with the Velocardiofacial Syndrome, and the sensitivity of qPCR in detecting copy number variations has been demonstrated in other studies (Boehm et al., 2004; Lin et al., 2012).
Real-time qPCR offers a number of potential advantages over other systems (Gouas et al., 2008). It provides a means for continuous detection of products throughout the amplification process, and as such can dispense with a gel separation stage, thus saving substantial technical time. It also operates in a closed system eliminating the danger of PCR contamination and sample cross contamination. This approach is comparatively inexpensive and can detect copy number changes below the limit of FISH. qPCR offers a technique that can be applied to small amounts of DNA, but has not well been routinely applied within clinical cytogenetics. Therefore, we compared qPCR with other techniques as an alternative technique for follow up of abnormal aCGH results.
In this project, results from qPCR were compared with the original aCGH result and with alternative follow-up methods (karyotyping, FISH, or repeated aCGH) to determine if qPCR is a suitable and reliable technique for aCGH follow-up, and critical threshold values for copy number loss, gain, and normal results were determined.
Materials and Methods
Eighty-four samples were divided into two cohorts and tested by qPCR. Fifty-nine samples (including 19 family trios) were selected for a retrospective cohort and follow-up data were available for all of these cases for primary findings confirmed by microarray, FISH, or karyotyping or a combination of two of them. Twenty-five samples were selected for a prospective cohort. Existing follow-up data were not available at the outset for any of these prospective cases and this study was performed in parallel to follow up by FISH, karyotyping, or repeated aCGH.
A separate cohort of 107 samples was assessed to determine critical threshold values (ranges) for the relative quantitation (RQ) values. These RQ values are the ratios produced by the StepOne software and represent the quantity of PCR product (the 95-125 bp sequence amplified by the selected primers) in relation to the quantity of PCR product in normal control DNA. So ideally, a deletion would produce an RQ value of 0.5 and duplication would give an RQ value of 1.5 with normal DNA used as a control.
A reproducibility study was carried out using eight samples in which qPCR testing was performed in quadruplicate on each of the four different samples. The quadruplicates were tested on the same machine by the same operator using separate PCR plates.
A sensitivity of experiment was carried out to test the level of detection for different copy numbers of the same PCR product on the X chromosome from eight samples.
DNA was extracted from blood samples using Nucleon (Amersham) and Genomic DNA Purification Kits (Gentra) according to the manufacturer's instructions. Comparative genomic hybridization based on microarrays (aCGH) was performed using Nimblegen Chips.
Primers for qPCR were designed online using publicly available software (http://frodo.wi.mit.edu/primer3). The product sequences were subjected to BLAT searches on www.ncbi.nlm.nih.gov to verify genomic position and sequence homology. Target regions were screened for single-nucleotide polymorphisms using https://ngrl.manchester.ac.uk/SNPCheckV2. Primers were 20 bp in length, with an average product size of 100 bp.
In all qPCR reactions, the target and reference genes were amplified with 0.20 μM of each primer, 25 ng of DNA and SYBR® Green PCR MasterMix (Applied Biosystems) in a 20 μL reaction. qPCR was performed using the StepOnePlus™ Real-Time PCR System (Applied Biosystems). The amplification conditions were as follows: a 10-min preincubation at 95°C followed by 40 cycles of 15 s at 95°C and 1 min at 60°C. The PCR products were subjected to a linear temperature transition from 60°C to 95°C at 0.3°C/s, and melting curves of the decrease of SYBR Green fluorescence were generated using StepOne Software v2.2 (Applied Biosystems). Standard curve, relative standard curve and an analysis of comparative CT experiments were also run on the StepOnePlus system. A comparative CT (ΔΔCT) experiment used an endogenous control to determine the quantity of target in a sample relative to the quantity of target in a reference sample. StepOne Software v2.2 was used for analysis.
Results
Of the 84 samples in the prospective and retrospective cohorts, 34 samples showed a normal result (i.e., no copy number change), 21 had duplications, and 29 showed deletions (Table 1).
family 36.
dup, duplication; del, deletion; N, normal; M, aCGH; K, karyotype; F, FISH; qPCR, quantitative polymerase chain reaction.
All samples showed consistent results except sample 36 for which the proband was originally reported as a 17p13.1 duplication. This was detected by aCGH and confirmed by FISH. qPCR revealed no evidence of a duplication and subsequent aCGH by a different platform also confirmed no evidence of duplication. This was therefore a false-positive finding by aCGH and FISH (Table 1).
In the cohort of 107 samples, 95.4% (±2 SD) of samples with normal aCGH results fell within the RQ value range of 0.77-1.24. Using normal DNA as a control, RQ values of ≥1.3 were recorded from patients with copy number gains and RQ values of ≤0.7 from patients with copy number losses (Fig. 1). When normal parental DNA from within each family was used as a second internal control, RQ values of ≥1.32 were recorded for copy number gain and ≤0.66 for copy number loss (Fig. 2).
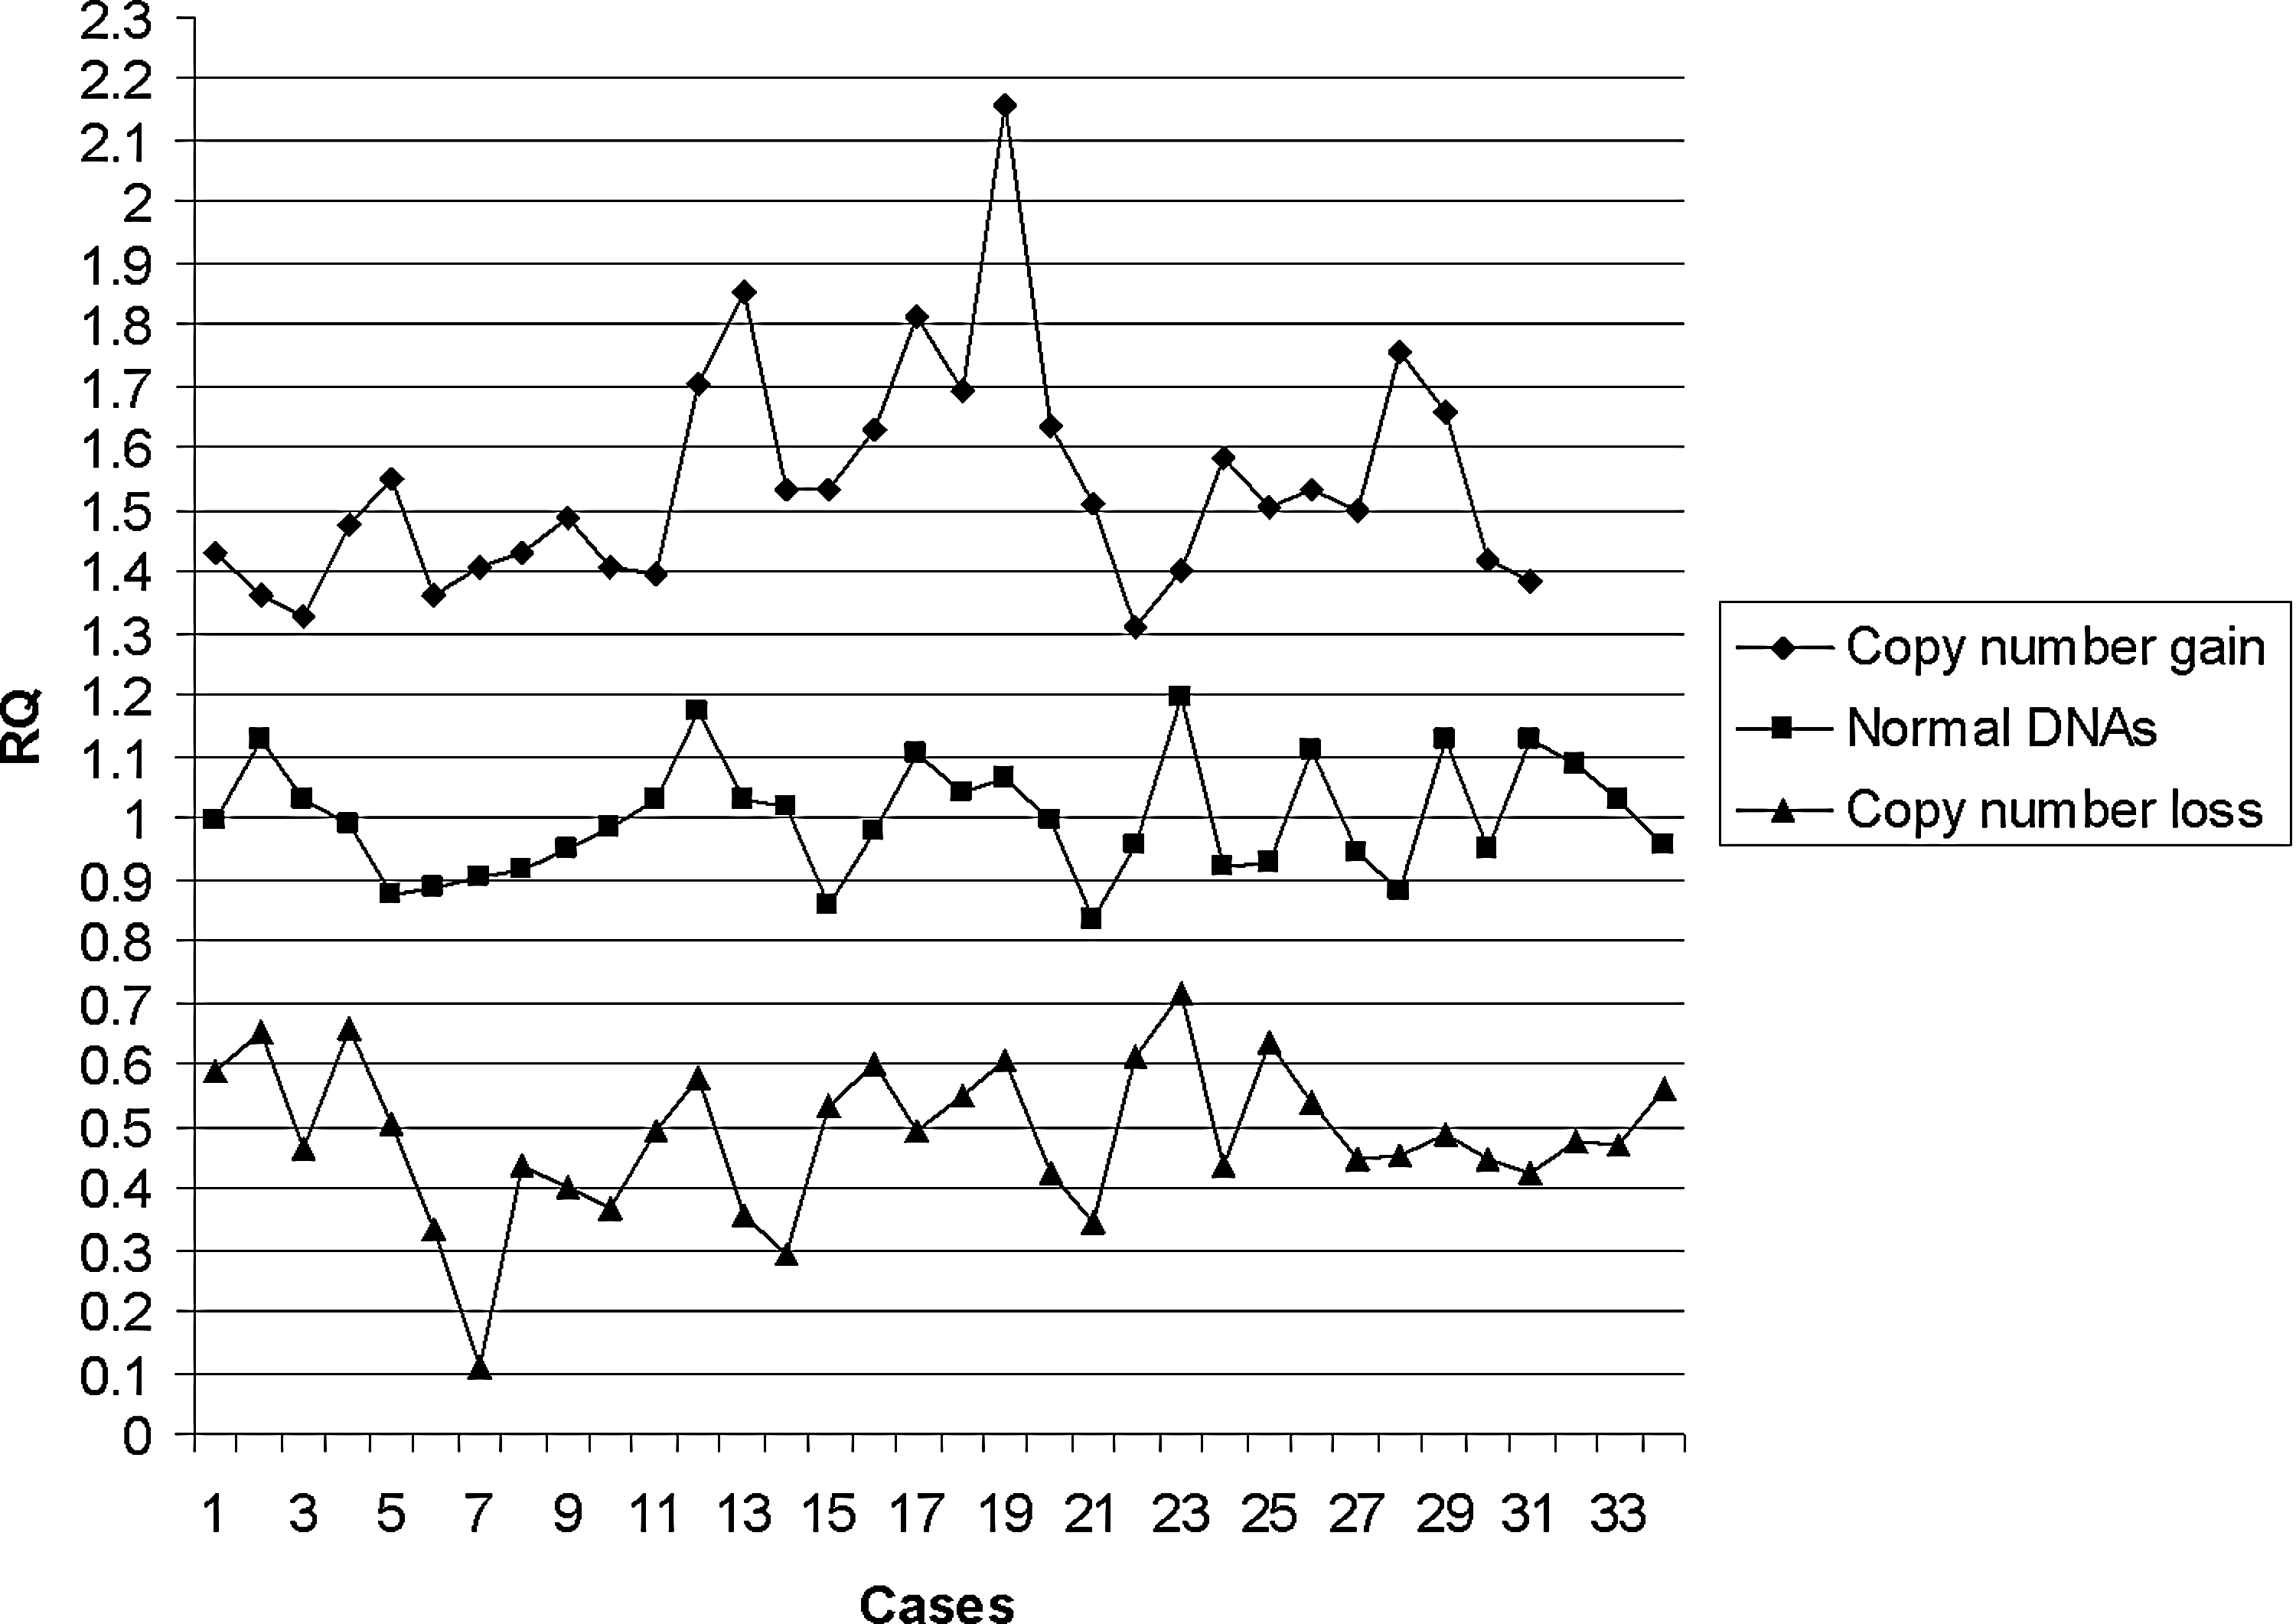
Relative quantitation (RQ) values from 107 patients with unrelated normal DNA used as control.

RQ values from 107 patients with normal parent used as control.
Two normal male, a normal female, a patient with Turner syndrome (45, X), a patient with a duplication of Xp22.31, and a mixed sample of two normal females with a normal male sample were tested using qPCR. Normal female DNA was used as a control. Two pairs of primers from the region of copy number gain in the Xp22.31 duplication patient were selected for the test. RQ values were collected as a measurement of copy number. The sensitivity experiment showed RQ value changes consistent with copy number changes (Table 2).
RQ, relative quantitation.
In the reproducibility experiment, the RQ values produced following repeated qPCRs were consistent (Table 3).
Discussion
All qPCR results were consistent with the original aCGH findings, with the exception of sample 36. It was a false-positive finding by both the earlier microarray platform (now no longer in use) and FISH. The limitations of FISH for detecting duplication are clearly demonstrated in this case. Following this result, our laboratory now does not use FISH to follow up copy number gains and instead employs qPCR.
Sample 208 was reported as a mosaic gain of chromosome 16 by aCGH analysis. The qPCR RQ value for the proband showed deviation from the mean log ratio for gain of chromosome 16, but the deviation in this case was lower than the threshold value for copy number gain. This is suggestive of, but cannot confirm mosaicism; and although consistent with aCGH in this case, we do not recommend the use of qPCR for detecting mosaicism. This case was not included in the prospective or retrospective study as the material was not available for FISH and karyotyping.
RQ values from repeating qPCR in quadruplicate (cases F and G carrying a deletion) ranged from 0.458 to 0.525 with ΔCTSE values (standard deviations) of 0.053-0.056. RQ values for the same testing strategy (cases H and I carrying a duplication) ranged from 1.371 to 1.663 with ΔCTSE values between 0.103 and 0.113. All were consistent with each other and with the aCGH results. There was also no test-retest variability as consistent results were gained from experiments that were repeated in quadruplicate on different plates, therefore showing that qPCR is a stable technique.
Sensitivity of the test was demonstrated by the copy number analysis test using primers from the Xp22.31 region. This showed that RQ values accurately reflected the range of change from copy number loss to copy number gain.
Determining the critical threshold values is vital for qPCR as thresholds which are too wide will lead to an increase in false-positive results and if too narrow, the threshold will lead to an increase in false-negative results. These values were determined by testing 107 samples with an unrelated normal DNA sample as a control. RQ values of between 0.77 and 1.23 were considered normal (i.e., no copy number change). RQ values of ≤0.7 indicated copy number loss, and RQ values ≥1.3 indicated copy number gain. For each family, a parent without copy number change was used as an internal control to increase confidence in the result. With the internal control, RQ values ≤0.66 indicated copy number loss, and ≥1.32 indicated copy number gain. Ratios outside these intervals were considered inconclusive and required repeat testing.
Results for each family were generally available within 1 to 2 weeks of sample receipt. Primers were usually synthesized and dispatched by the manufacturer within three working days of ordering. Tests using existing stocks of primers could be turned around in less than a week in urgent cases.
However, the limitations of qPCR are firstly, that balanced rearrangements (and contamination) cannot be detected. Exclusion of balanced parental rearrangements by FISH is recommended for apparently de novo abnormalities. In addition, only two families can be tested per 96-well plate, therefore high throughput is not possible.
The results presented here demonstrate that qPCR is a fast, robust, efficient, and accurate technique for confirmation and follow-up of both copy number gains and losses detected by aCGH. The qPCR approach results in significant time and cost savings (being less expensive than parental aCGH testing) and provides confirmation of the proband abnormality using a different technique to the original aCGH method. It also has a lower minimum detection threshold than FISH.
We have developed an effective qPCR-based service in our laboratory and have used this to improve our follow-up testing strategy. We have refined our sample preparation and data analysis techniques to improve accuracy and turnaround times, and are now using this technique routinely for aCGH follow-up studies for confirmation and determination of inheritance. More than 300 families have been reported to date.
Footnotes
Acknowledgments
We thank the CPA Trust Ltd for providing the CPA bursary to fund this project.
Author Disclosure Statement
No competing financial interests exist.