




Abstract
Backgrounds: Interferon (IFN)-α has been used to treat hepatocellular carcinoma (HCC). Here, we report that the IFN-α-induced microRNA-26a (miR-26a) can inhibit HCC proliferation and invasion by suppressing enhancer of zeste homologue 2 (EZH2) expression in tumor cells. Materials and Methods: First, the miR-26a transcription level was quantified by real-time quantitative PCR in the HCC specimens from IFN-α-treated HCC patients. Next, we transfected HepG2 cells with miR-26a mimics and miR control, and then we investigated the influence of miR-26a mimic transfection on HepG2 cell proliferation and invasion. Results: It was shown that there was increased miR-26a accompanied with downregulated EZH2 expression in the HCC specimens, and EZH2 mRNA levels were inversely correlated with miR-26a expression. There was a dose-response correlation between the IFN-α dosage and EZH2 expression. In addition, the miR-26a mimic transfection decreased the EZH2 expression level significantly in the transfected HepG2 cells and inhibited HepG2 cell proliferation and invasion effectively. Conclusion: Our results indicate that miR-26a exerts growth inhibition in HCC and that its inhibitory effect is mediated briefly by blocking EZH2 expression.
Introduction
H
The microRNA (miR)-26 family is composed of miR-26a-1, miR-26a-2, and miR-26b located on chromosomes 3, 12, and 2, respectively (Gao and Liu, 2011; Han et al., 2012). miR-26a is consistently downregulated in a wide range of malignant tumors, such as HCC, nasopharyngeal carcinoma, lung cancer, and breast cancer (Lu et al., 2011; Yu et al., 2013). Therapeutic miR-26a delivery using the adeno-associated virus vector was able to inhibit cancer cell formation while inducing tumor-specific apoptosis and providing apparent protection from disease progression without side effects (Kota et al., 2009). As well, patients with reduced miR-26a expression in tumors had a significant improvement in overall survival after receiving adjuvant therapy with interferon (IFN)-α (Ji et al., 2009). Enhancer of zeste homologue 2 (EZH2) is the potential target gene for miR-26a (Wong and Tellam, 2008), which methylates histone H3 lysine 27 (H3K27) and mediates transcriptional silencing (Cao et al., 2002; Vire et al., 2006). A previous study showed that the silence of EZH2 gene in HCC cells is capable of reversing tumorigenicity in a nude mouse model (Chen et al., 2007) and demonstrated the potential therapeutic value of EZH2 inhibition in HCC. Recent studies have also reported the improved expression of EZH2 in HCC tissues, which was correlated with the aggressiveness or poor prognosis of HCCs (Yonemitsu et al., 2009; Cai et al., 2011).
However, the mechanism underlining the sensitivity of HCCs to IFN-α is unclear; there is a need for applying molecular methods to elucidate the chain reactions induced by IFN-α therapy. In this study, we initially analyzed the miR-26a level in HCC specimens in IFN-α-treated HCC patients and found that the IFN-α treatment promoted miR-26a levels and suppressed EZH2 expression in HCC cells. Next, we transfected the HepG2 cells with miR-26a mimics or a control and observed that miR-26a blocked HepG2 proliferation and invasion by decreasing EZH2 expression. Our study will provide a better understanding on the mechanism of IFN-α treatment to HCC.
Materials and Methods
Human HCC specimens
Tumor tissue specimens were collected by needle biopsy, before and post-INF-α treatment, from HCC patients, who were registered in the Jinan Central hospital, Shandong University (n=34) (Jinan, China) or the Affiliated Anhui Provincial Hospital (n=26) (Hefei, China) from January 2009 to April 2013. All tissue specimens for miR-26a and EZH2 expression analysis were stored at −80°C before use. Utilization of all specimens was approved by all patients and our hospital Internal Review Board (IRB) in the two hospitals.
Cell culture and treatment with reagents
HepG2 cells were purchased from the cell resource center of the Chinese Academy of Medical Sciences (Beijing, China) and cultured in RPMI-1640 (Invitrogen, Carlsbad, CA) with 10% fetal bovine serum (FBS; Invitrogen) and were incubated at 37°C in 5% CO2. HepG2 cell maintenance was performed with RPMI-1640, adding 2% FBS. IFN-α was purchased from Sigma-Aldrich (St. Louis, MO) and resolved in DMEM without FBS. miR-26a mimics and miR control (Qiagen, Valencia, CA) were utilized to elevate the miR-26a level with a concentration of 20 or 40 nM. Each of them was transfected into the HepG2 cells by Lipofectamine 2000 (Invitrogen).
RNA extraction and quantitative real-time polymerase chain reaction
Total RNA and miR samples were extracted from tissue samples or HepG2 cells with the Trizol agent (Invitrogen) and then assayed with a NanoDrop ND-1000 spectrophotometer (NanoDrop Technologies, Wilmington, DE) at 260 and 280 nm. For quantitative real-time polymerase chain reaction (qRT-PCR) analysis of the level of miR-26a or EZH2 mRNA, the mirVana qRT-PCR miRNA Detection Kit (Invitrogen) or SYBR green RT-qPCR kit (Takara, Tokyo, Japan) were used, and the U6 small nuclear RNA or β-actin was used as the internal control. The ΔΔCt method was used for relative quantification (Livak and Schmittgen, 2001). Furthermore, a nonradioactive northern blot method,
Protein sample isolation and western blot analysis
Whole HepG2 cells were collected and prepared with a cell lysis reagent (Pierce, Rockford, IL). In addition, all protein samples were quantified with a BCA kit (Thermo Scientific, Rockford, IL), separated by an 8-12% SDS-PAGE gel, and transferred to a PVDF membrane. EZH2 and β-actin were detected by immunoblot analysis using anti-EZH2 or anti-β-actin rabbit polyclonal antibody (1:500; Sino Biological, Beijing, China). Goat anti-rabbit IgG conjugated to horseradish peroxidase (Pierce) and ECL detection systems (Super Signal West Femto; Pierce) were used for detection. The EZH2 level was expressed as percentage to β-actin.
Cell proliferation, colony formation assay
To assay the influence of miR-26a mimics on the HepG2 cell proliferation, 85% confluent HepG2 cells were transfected with 20 nM miR-26 mimics or miRNA control and then were incubated in CCK-8 (Dojindo, Kumamoto, Japan). The 450 nm absorbance of each cell well was detected after visual color occurrence at 0, 12, or 24 h. For cell colony formation assay, 5×10² HepG2 cells were incubated in 12-well plates and then were transfected with or without 20 nM miR-26a mimics or miRNA control, 4-8 days postincubation; the cells were stained with crystal violet (0.005%) for 20 min and the colony numbers recorded by ImageJ software.
Migration and invasion assay of HepG2 cells
The migration capability of HepG2 cells was examined by scratch assay and transwell migration assays. For scratch assay, HepG2 cells were cultivated to ∼85% confluence on the six-well plates and transfected with 40 nM miR-26a mimics or miRNA control. Then, a pipette tip was used to scratch the confluent cells 6 h post-transfection. We observed the cellular growth from 0 to 48 h. The transwell chambers were used to perform a transwell invasion assay. Briefly, HepG2 cells were seeded to 2×10⁵ cells in serum-free media in the upper chamber with the noncoated membrane (8 μm pore size) and transfected with 25 or 50 nM miR-26a mimics or miRNA control. The lower chamber contained media with 20% FBS as a chemoattractant. The cells in the upper chamber were discarded after 24 h, and the migration cells in the lower chamber were counted by a microscope.
Statistical analyses
The results are expressed as mean±standard deviation. Student's t-test was performed to compare the difference between two groups. The correlation of miR-26a level with the EZH2 mRNA level in HCC specimens was performed with the Spearman rank correlation analysis. All statistical analyses were conducted by SPSS 17.0 software. Statistical significance was considered when p<0.05 or less.
Results
EZH2 was downregulated and inversely correlated with miR-26a levels in HCC specimens post-IFN-α treatment
A panel of 60 human HCC specimens from patients before and post-IFN-α treatment was analyzed in this study. Initially, we quantitatively examined the transcription level of miR-26a and the histone-lysine N-methyltransferase, EZH2, in these specimens. The mean relative miR-26a level to U6 rose from 1.000 before IFN-α treatment to 1.513 post-treatment, and there was a statistical difference (Fig. 1A). Whereas the mean relative EZH2 level to β-actin dropped significantly from 1.000 to 0.769 (p<0.01) (Fig. 1B). Then, we correlated the miR-26a level with the EZH2 level in the specimens, as shown in Figure 1C; a significant inverse correlation was observed when EZH2 mRNA levels were plotted against miR-26a expression.
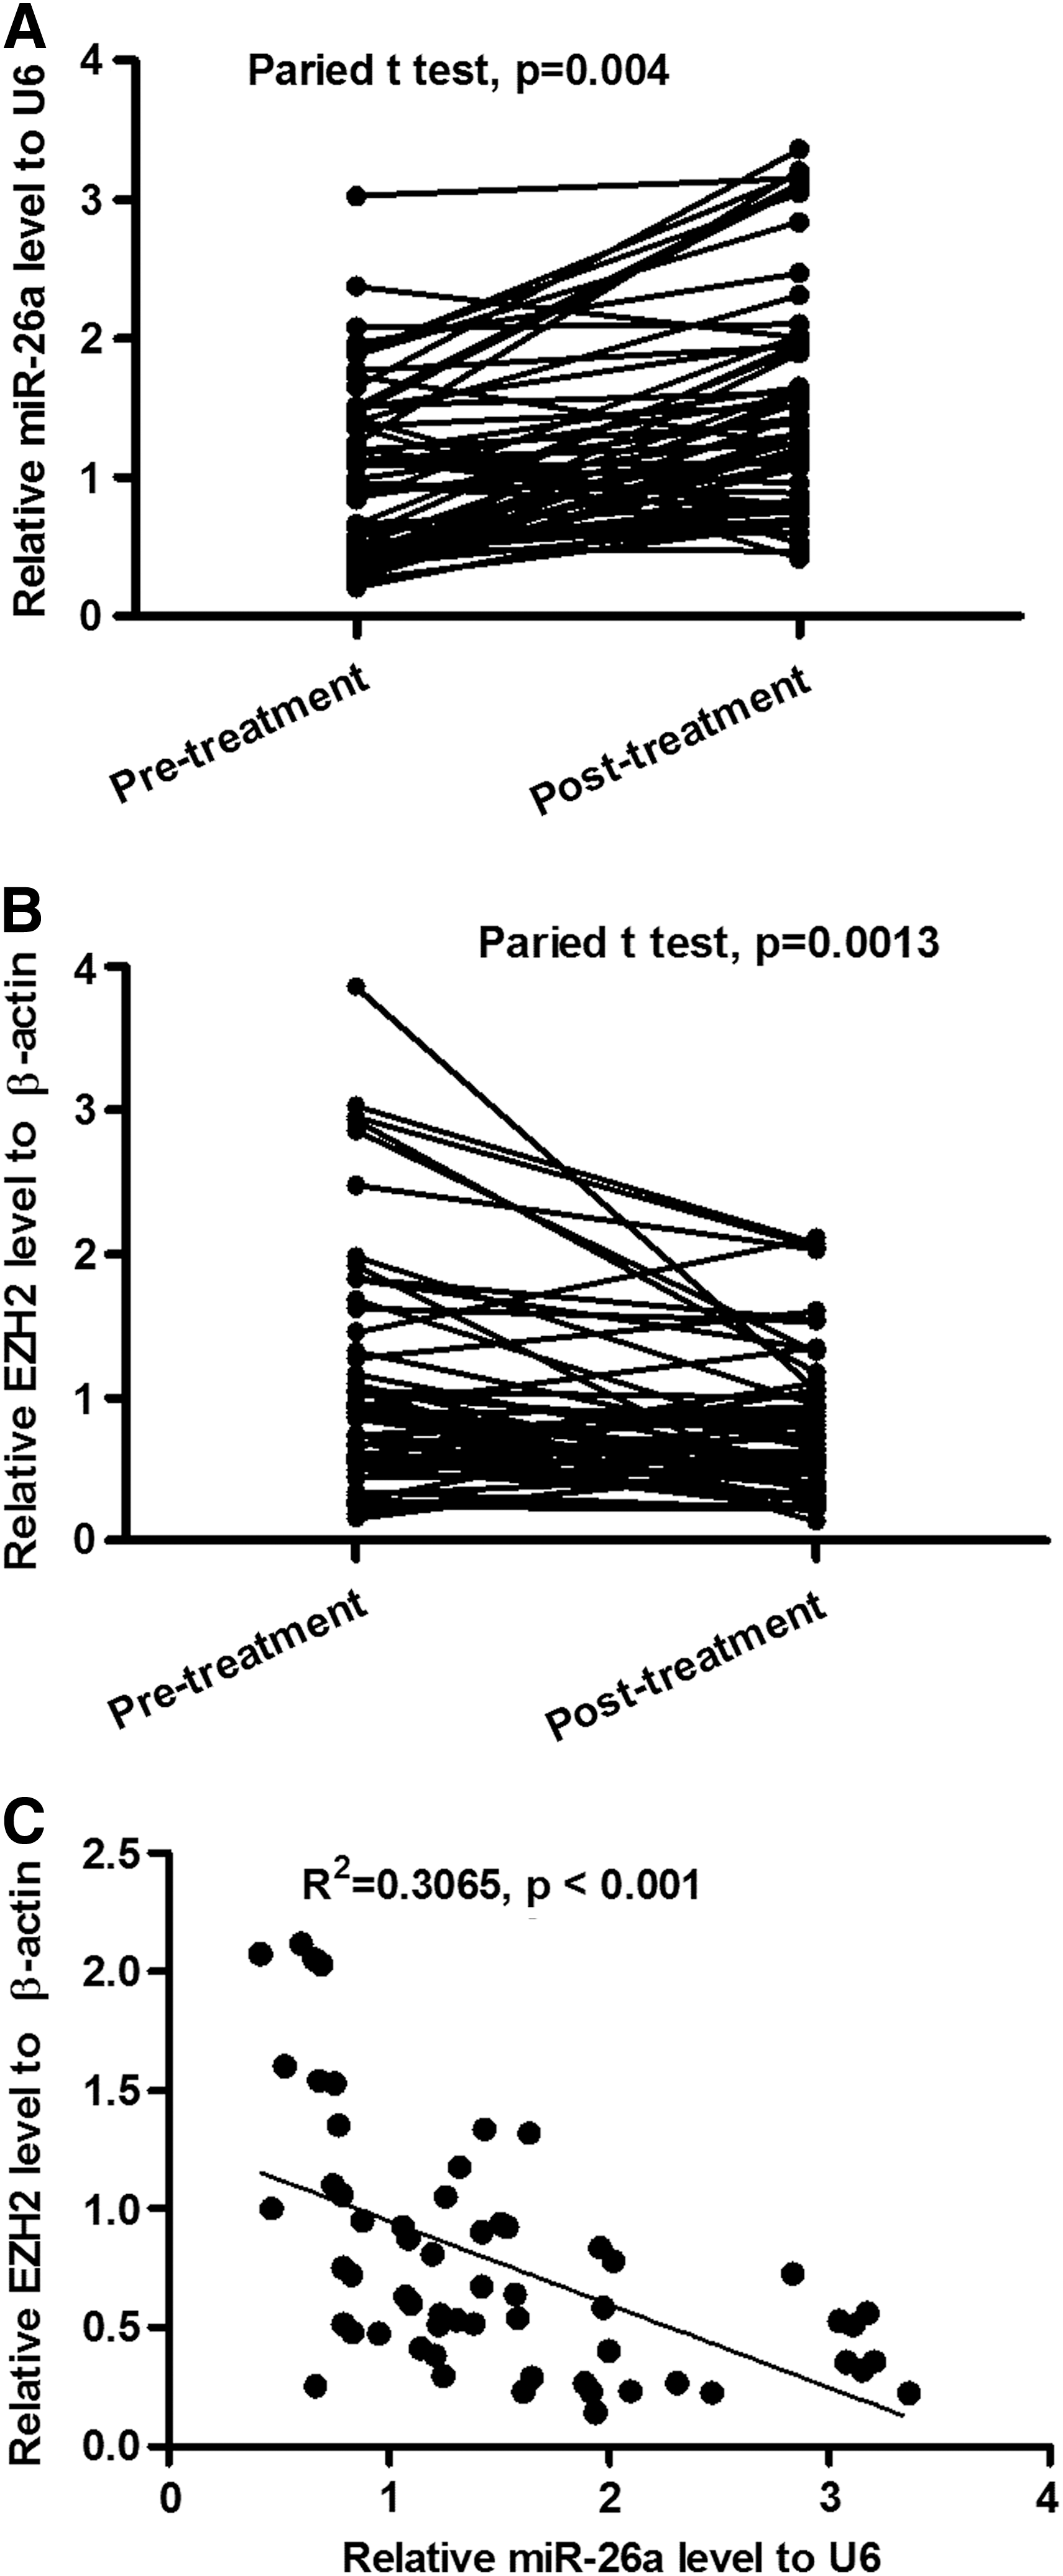
Correlation of increased miR-26a with decreased EZH2 in HCC specimens post-IFN-α treatment.
IFN-α treatment promoted miR-26a level and suppressed EZH2 expression in HCC cell line, HepG2
HepG2 cells were sampled at the time point of 0, 12, 24, and 48 h after IFN-α treatment. Then, the copies of miR-26a and the housekeeping gene U6 were subsequently measured by real-time quantitative PCR. The relative miR-26a level to U6 did not increase significantly at 12 h post-treatment; the level rose to a higher level at the point of 24 h and maintained this level until 48 h after IFN-α intervention (Fig. 2A).The percentage of miR-26a to U6 evaluated by northern blot also confirmed the above result, and the miR-26a percentage in 24 and 48 h was statistically different when compared with that in 0 h (Fig. 2B).
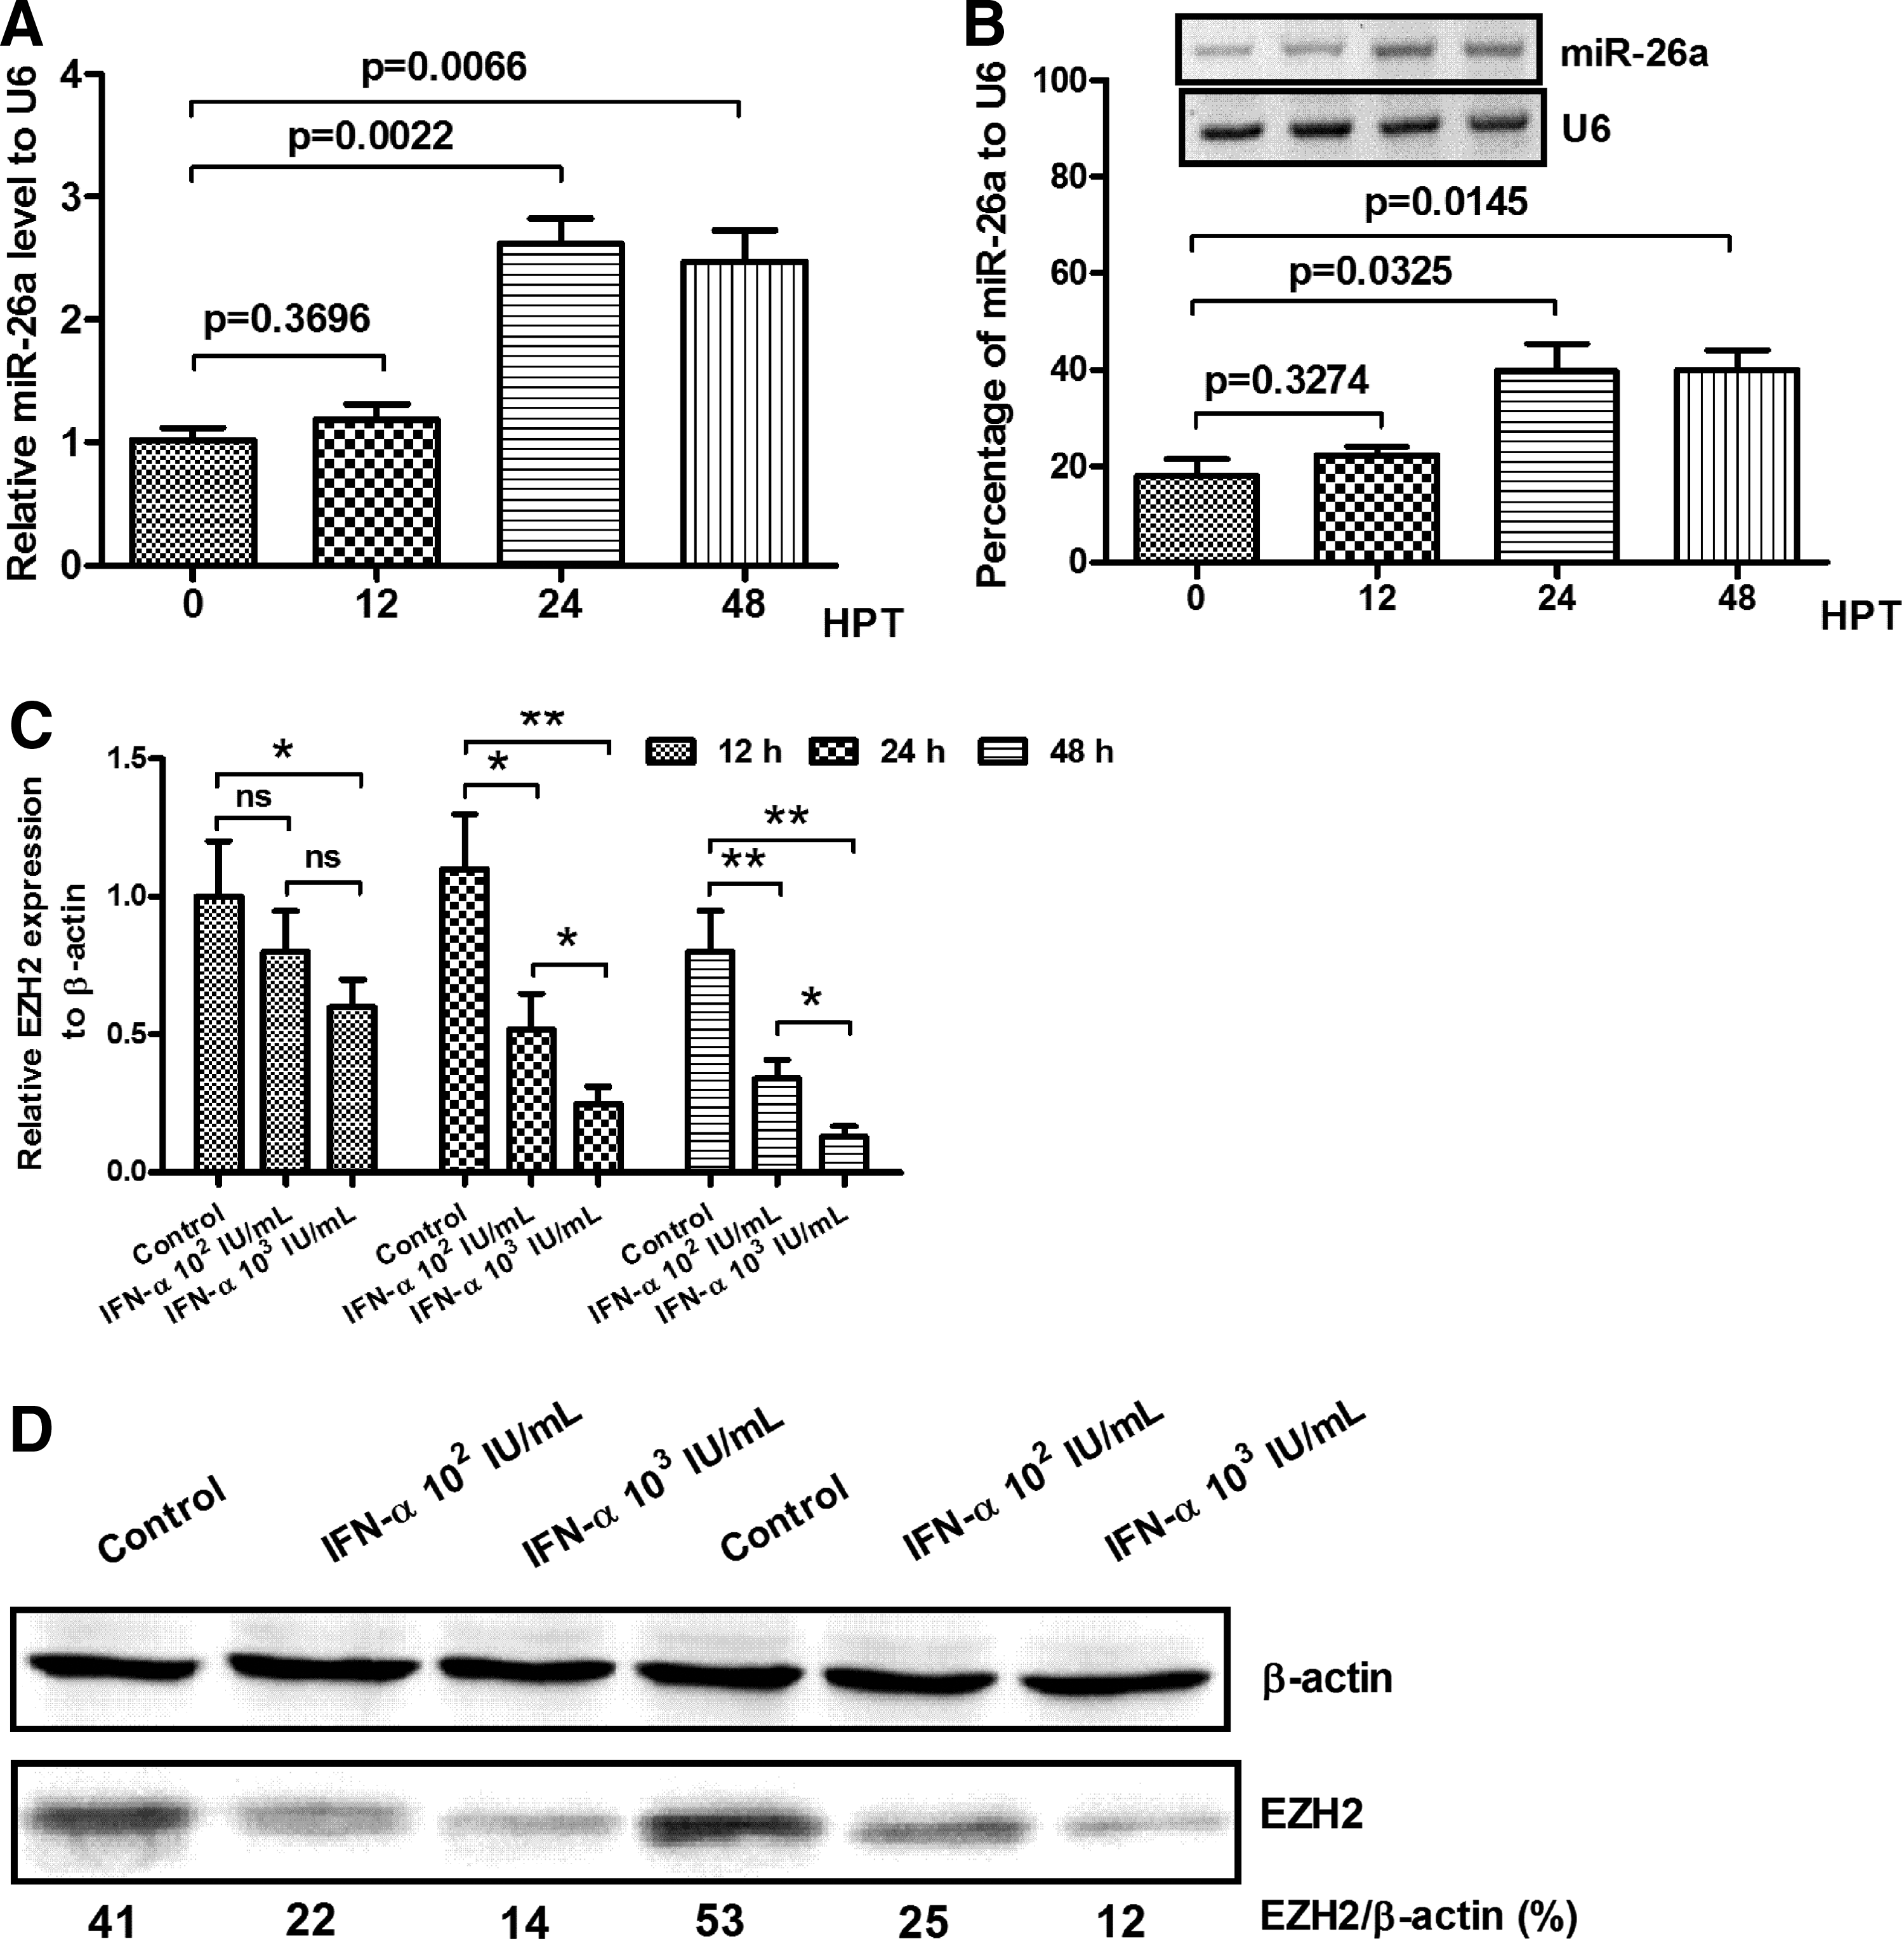
IFN-α promotes miR-26a level, while inhibits EZH2 expression in HCC cells.
The EZH2 mRNA transcription level after IFN-α intervention was also evaluated, as shown in Figure 2C; the EZH2 mRNA level decreased significantly at 24 and 48 h post-IFN-α treatment. In contrast with 102 IU of IFN-α, 103 IU of IFN-α suppressed the EZH2 mRNA level to a lower level. Next, we checked the EZH2 protein expression in the treated HCC cells, IFN-α led to a dose-dependent decrease in EZH2 protein levels, specially at 103 IU dosages of IFN-α, EZH2 expression was decreased by ∼34% compared with the negative control (Fig. 2C, D).
miR-26a blocks the EZH2 expression in the HepG2 cell line
To confirm the association between miR-26a and EZH2, the HepG2 cells were transfected with miR-26a mimic or miR control at the same amount, separately. As shown in Figure 3A, the relative miR-26a level of the miR-26a mimic group was significantly higher compared with the miR control group, at either 20 or 40 mM, and there was a dosage-effect relationship between the miR-26a mimic dose and relative miR-26a level in HepG2 cells. Next, we checked the EZH2 mRNA level to β-actin in HepG2 cells every 24 h after transfection; a significant difference was observed between the miR-26a mimic group and control group, and the EZH2 mRNA level was stable during 72 h post-transfection (Fig. 3B). Finally, we evaluated the EZH2 expression level by western blot at different time points post-transfection, as shown in Figure 3C and D; a dramatic difference was clearly disclosed between the control group and miR-26a group during the three time intervals. These results demonstrated that upregulated miR-26a can inhibit the EZH2 expression in the transcription level.

Upregulated miR-26a blocks the EZH2 expression in HCC cell line, HepG2.
miR-26a induced growth inhibition and decreased the migratory and invasive capacity of HepG2 cells
To explore the effect of miR-26a on cell proliferation, HepG2 cells were transiently transfected with miR-26a mimics and miR control, respectively. As shown in Figure 4A, the results of MTT assay displayed that miR-26a mimics inhibited cell proliferation in Hep G2 cells by 33% (p<0.05) at 48 h and 50% (p<0.05) at 72 h post-transfection separately. The growth inhibition induced by miR-26a mimic transfection was also observed in HepG2 cells, as demonstrated in colony formation assay; the miR-26a mimic group displayed much fewer and smaller colonies compared with the control group (Fig. 4B, C).
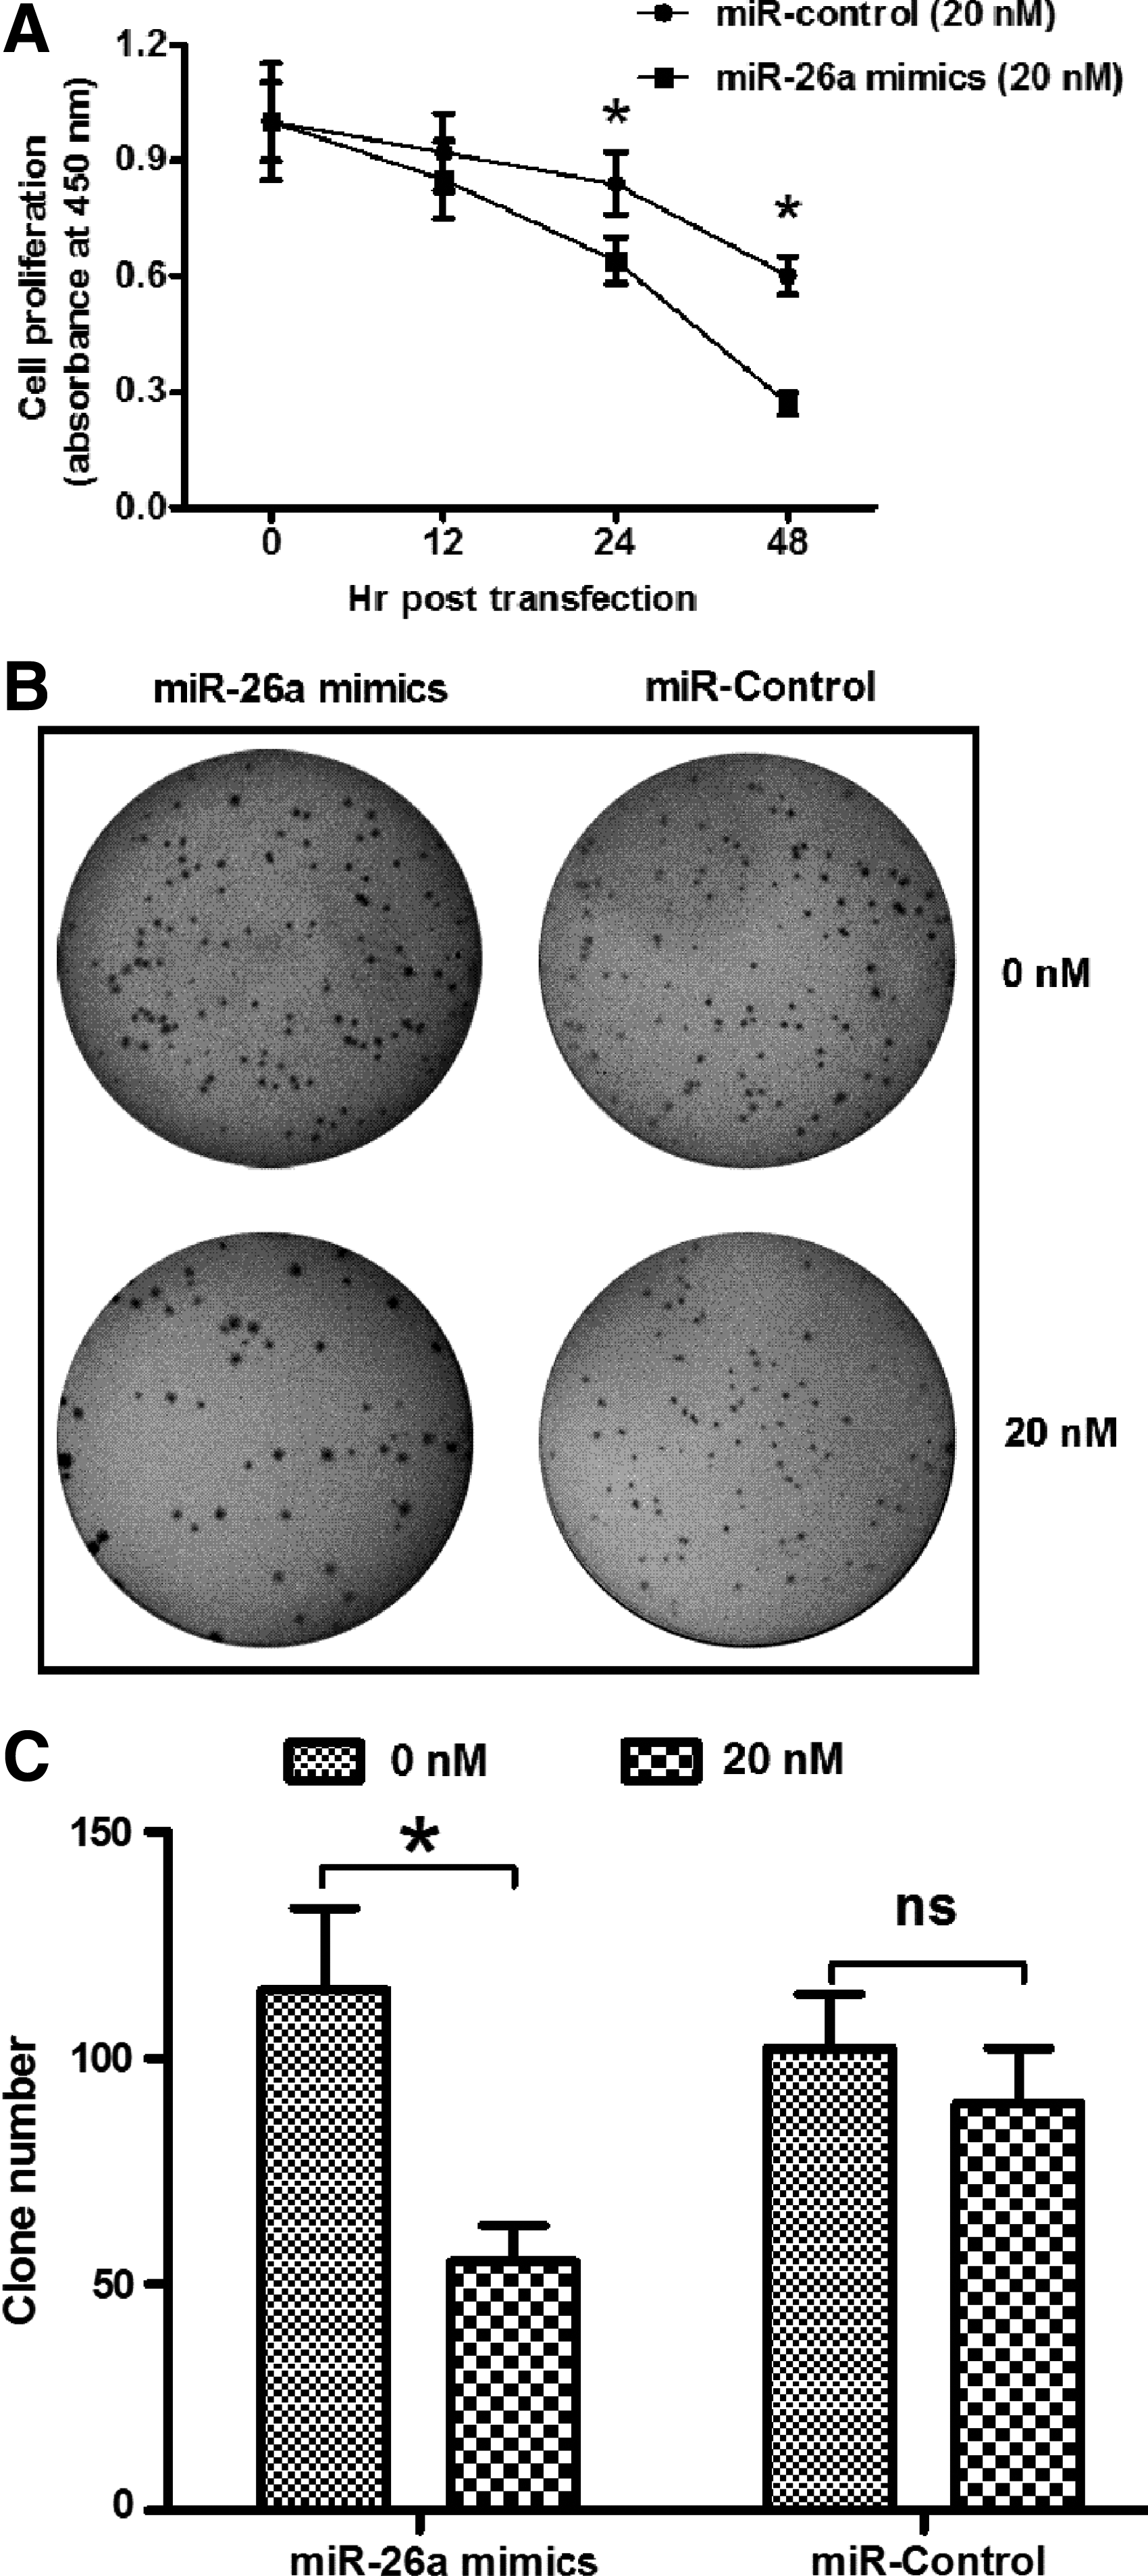
Upregulated miR-26a inhibits HepG2 cell proliferation in vitro.
To investigate the effects of miR-26a on HCC cell invasion and migration, we conducted cell migration and invasion assays on HepG2 cells. It was shown that upregulated expression of miR-26a significantly suppressed the migratory and invasive abilities of HepG2 cells 48 h after transfection (Fig. 5A). The number of migrated cells per field in the miR-26a mimic group was decreased by 36% compared with the control group (Fig. 5B). Also, the number of invasive cells in the miR-26a group declined by 37.5% and 62.5% compared with the control group, respectively, when the HepG2 cells were transfected with mimics at concentration of 25 and 50 nM separately (Fig. 5C). These results suggested the inhibitory role of miR-26a in HepG2 cell metastasis.

Upregulated miR-26a inhibits tumor cell migration and invasion.
Discussion
In this research, we designed an experiment to test the reasonability of IFN-α treatment of HCC. At first, we stimulated the HCC specimens using IFN-α and found that the IFN-α treatment promoted the miR-26a level and suppressed EZH2 expression in HCC cells. Next, we discovered that miR-26a mimic transfection of the HepG2 blocked the EZH2 expression at the transcription level and inhibited the tumor cell proliferation and invasion capability, consequently. The result indicated that the IFN-α treatment may be effective in containing the HCC disease progression.
IFN-α has always been used to treat HCC and many miRNAs have been thought to relate with patient survival following IFN treatment (Sun et al., 2006; Clavien, 2007; Lo et al., 2007). Previous research has revealed a positive correlation between miR-26 expression and IFN-α efficacy on patient survival (David, 2010; Zhao et al., 2012). Patients receiving IFN-α with low intratumor miR-26a levels have an apparent increase in the overall survival, while those with high miR-26a levels are not sensitive to IFN-α treatment. Similar results have also been observed with miR-26b (Jiang et al., 2009). In this research, as well, we found that IFN-α treatment actually improves the miR-26a transcription level in HCC specimens in vitro (Figs. 1A and 2A, B), and our experimental research is direct evidence supporting the previous clinical research result.
Numerous studies suggest that EZH2 is overexpressed in multiple cancers and can enhance cell proliferation and tumor transformation. EZH2 also plays a vital role in the tumorigenesis of HCC. Increased expression of EZH2 has been frequently detected in HCC tissues (Sudo et al., 2005; Sasaki et al., 2008), and has been correlated with the aggressiveness and poor prognosis of HCCs (Yonemitsu et al., 2009). Our research also clearly revealed that the IFN-α downregulates the EZH2 transcription level and the highest inhibition effect emerged at 48 h post-IFN-α using. To test the key role of miR-26a in blocking the EZH2 expression, we used the miR-26a mimics to transfect the HepG2 cells and found that the miR-26a mimics suppressed the tumor cell proliferation and evasion by inhibiting the EZH2 expression. The results clarified the molecular mechanism and rationality of IFN-α treatment to HCC. In the study, we also hypothesized that the antimetastatic effect of miR-26a in HCC was mediated through EZH2 and testified it subsequently in vitro; further research should be carried out in the animal models to confirm the anti-invasion function of miR-26a.
Conclusions
In conclusion, we have identified that IFN-α-induced miR-26a inhibited migration and invasion of HepG2 in vitro and the inhibitory effects were partially mediated by EZH2. Since miR-26a is apparently downregulated in HCC, reintroduction of miR-26a mimics into the tumor may provide an alternative therapy by reducing expression of target gene EZH2. Although miRNA-related therapies still remain immature, our findings on IFN-α-induced inhibition on HCC suggest that the miR-26a delivery may be a promising therapy for the treatment of HCC.
Footnotes
Acknowledgment
This work is supported by a doctor grant from Jinan Central Hospital, Shandong University.
Author Disclosure Statement
The authors declare that there are no competing interests.