
Abstract
Aims:
Ancient DNA (aDNA) extracted from historical bones is damaged and fragmented into short segments, present in low quantity, and usually copurified with microbial DNA. A wide range of DNA quantification methods are available. The aim of this study was to compare the five most common DNA quantification methods for aDNA.
Materials and Methods:
Quantification methods were tested on DNA extracted from skeletal material originating from an early medieval burial site. The tested methods included ultraviolet (UV) absorbance, real-time quantitative polymerase chain reaction (qPCR) based on SYBR® green detection, real-time qPCR based on a forensic kit, quantification via fluorescent dyes bonded to DNA, and fragmentary analysis. Differences between groups were tested using a paired t-test.
Results:
Methods that measure total DNA present in the sample (NanoDrop™ UV spectrophotometer and Qubit® fluorometer) showed the highest concentrations. Methods based on real-time qPCR underestimated the quantity of aDNA. The most accurate method of aDNA quantification was fragmentary analysis, which also allows DNA quantification of the desired length and is not affected by PCR inhibitors.
Conclusions:
Methods based on the quantification of the total amount of DNA in samples are unsuitable for ancient samples as they overestimate the amount of DNA presumably due to the presence of microbial DNA. Real-time qPCR methods give undervalued results due to DNA damage and the presence of PCR inhibitors. DNA quantification methods based on fragment analysis show not only the quantity of DNA but also fragment length.
Introduction
A
Quantification of damaged and ancient human DNA
aDNA is quantified by applying wide-scale methods using many types of different approaches. Measurement of ultraviolet (UV) absorbance used to determine aDNA quality and quantity has been used since one of the first ancient analyses in the 1990s of the 20th century (Lassen et al., 1994). Commonly used instrument for DNA quantification is the NanoDrop™ spectrophotometer (Thermo Scientific, Wilmington, DE). This instrument allows the determination of the quantity and quality of DNA using a ratio of UV absorbance of 260/280 nm.
The Qubit® fluorometer instrument (Invitrogen, Carlsbad, CA) measures fluorescence of dyes, which are directly bonded to DNA. No enzymatic reaction such as PCR is necessary for this quantification. Quantification using the Qubit fluorometer is fast and easy to use. Real-time quantitative PCR (qPCR) quantification of DNA is based on measurement of fluorescence emitted by intercalation dyes (SYBR® green, Eva® green) or fluorescently labeled sequence-specific probes. The real-time qPCR quantification approach to aDNA analysis is based on individually designed applications or commercially available kits for forensic applications (Plexor®; Promega, Madison, WI; Quantifiler®; Applied Biosystems, Foster City, CA; Investigator Quantiplex®; Qiagen, Hilden, Germany). The use of labeled probes allows amplifying both DNA types—mitochondrial DNA and nuclear DNA in one PCR (Alonso et al., 2003). Quantification of aDNA through real-time qPCR is being used to prediction of survival, recovery, and localization of aDNA in historical skeletal samples (Adler et al., 2011) and dependence of DNA preservation on type and length of storage and excavation (Pruvost et al., 2007), burial condition (Campos et al., 2012), and thermal damage (Ottoni et al., 2009). Data from real-time qPCR quantification help to determine inhibition of PCR (Sutlović et al., 2005; Kontanis and Reed, 2006), optimization of aDNA extraction protocol (Lee et al., 2010), and setting up PCR conditions (King et al., 2009). Forensic quantification kits based on real-time qPCR are widely used for aDNA quantification (Amory et al., 2007; Bouakaze et al., 2007; Keyser et al., 2009; Lacan et al., 2011).
Currently, methods that can not only measure quantity but also determine the degree of fragmentation of the molecule are becoming widely used. These procedures frequently use next gene sequencing (NGS) (Dabney et al., 2013). Another approach that is able to determine the degree of fragmentation is fragmentary analysis. This method combines detection using fluorescent dyes and separation of DNA molecules by gel electrophoresis. The Fragment Analyzer™ (Advanced Analytical, Amen, IA) is a device used mainly for checking NGS libraries (Ripma et al., 2014), allelic discrimination assays for mutation detection (Bonatelli et al., 2015), and also for quantification of direct genomic DNA (Pan et al., 2015) or RNA (Maldotti et al., 2016).
The aim of this study was to compare the most widely used quantification methods and evaluate their suitability for aDNA studies.
Materials and Methods
Bone samples used for this study originate from an early medieval burial site in the south of the Czech Republic (Znojmo-Hradiště). This burial site comes from the pre-Christian period and it typically has a high rate of graves with two individuals.
The skeletal material was well preserved. Bones and teeth used in this study were compact without any signs of damage. Teeth were located in alveoli. Anthropological analysis determined age of death, body height, and sex of adults (Drozdová, 2011). Plexor HY Male Genomic DNA (50 ng/μL, Promega) was used as recent control material.
Contamination precaution
Standard contamination precautions as previously described in the literature were used for the aDNA analysis (Cooper and Poinar, 2000; Kalmar et al., 2000; Hofreiter et al., 2001; Kaestle and Horsburgh, 2002; Cappellini et al., 2004; Pääbo et al., 2004; Willerslev et al., 2004; Kemp and Smith, 2005). We collaborated closely with archaeologists from the Department of History, Faculty of Education, Masaryk University (Brno, Czech Republic), to obtain freshly excavated bones. Historical bones were excavated under aseptic conditions. All steps of the analysis were performed in a laboratory dedicated to aDNA studies only. Pre- and post-PCR procedures were carried out in physically separated laboratories. Laboratories, plastic ware, reagents, pipettes, benches, and other laboratory equipment were UV irradiated (250 nm, for 30 min) before and after each experiment. Everyone who manipulated the material was genotyped and their genetic profiles were compared with results of the aDNA analysis. DNA extraction of each sample was performed in two independent runs. Blank controls were carried in parallel with the extraction of the archaeological material.
Purification of DNA
The surface of the teeth and bones was brushed to ∼3 mm of depth with a sanding machine to remove soil and eliminate contamination. Each bone fragment or tooth was bleached and UV irradiated for 20 min. Skeletal material was pulverized in an oscillating grinder. aDNA extraction was performed using an optimized protocol MinElute® PCR Purification Kit (Qiagen) (Yang et al., 1998). The initial amount of bone powder was 100 mg and final volume of eluate was 100 μL.
NanoDrop UV spectrophotometer
Quantification of aDNA and control samples was performed on a NanoDrop 2000 UV-Vis spectrophotometer (Thermo Scientific) according to the manufacturer's instructions. Input volume of the eluate was 1 μL. Results were analyzed using NanoDrop 2000 software.
Qubit fluorometer
Ten microliters of aDNA sample was quantified using a Qubit dsDNA HS Assay kit (Invitrogen). Measurement was performed according to the manufacturer's instructions in two independent reactions.
Real-time PCR quantification
Plexor HY system
Plexor HY assay (Promega) was applied for quantification of aDNA and control samples. An AB 7500 instrument (Applied Biosystems) was used according to the manufacturer's instructions to perform PCR. Input volume of the eluate was 2 μL. Results were analyzed using Plexor HY software.
SYBR green detection
aDNA quantity was also determined using real-time qPCR. The master mix contained 2× SYBR Green PCR Master Mix (Applied Biosystems), bovine serum albumin (New England Biolabs, Ipswich, MA), water (amplification grade), and primers (200 nM; both Sigma-Aldrich, Saint-Louis, MO) (Nováčková, 2015). The human tyrosine hydroxylase (TH) gene was used as a marker. TH is widely used in quantification assays in forensic applications (Tringali et al., 2004). The product of amplification is 62 bp long.
Reverse primer: TGA AAA GCT CCC GAT TAT CCA, forward primer: CAC TCG GAA GCC CTG TGT ACA, and 10 μL of template DNA.
Reaction volume was 50 μL. An AB 7500 machine (Applied Biosystems) was used and PCR conditions were as follows: initial denaturation: 95°C/10 min, two-step cycling: denaturation step 95°C/15 s, annealing and elongation step: 60°C/60 s, 45 cycles. The dissociation stage followed right after cycling. Results were analyzed using SDS v1.4 software (Applied Biosystems).
Fragment Analyzer
The quantity and length of aDNA fragments and control DNA were analyzed using a DNF 474 High-Sensitivity NGS Fragment Analysis Kit (Advanced Analytical) according to the manufacturer's instructions. Input amount of DNA was 2 μL.
Analyses were run on a Fragment Analyzer (Advanced Analytical). Results were analyzed using Fragment Analyzer PROSize 2.0 software.
Statistical analysis
Differences between groups were tested using a paired t-test.
Results
Five different methods of DNA quantification were applied. aDNA was extracted from 16 individuals and from 2 independent sources from each individual (e.g., two separated teeth). DNA quantity was determined twice for every sample by all of the methods described. The average of measurements was used for statistical analysis. The results of the analyses are summarized in Table 1. The highest value of the amount of aDNA was obtained by using the NanoDrop machine. The lowest value of the amount of aDNA in the samples was determined by using real-time qPCR based on Plexor HY assays (Promega). The results of the aDNA quantification are described above.
Labeling of archaeological samples was based on the archaeological situation. The letters A and B mean that the samples came from the same grave.
Drozdová (2011).
NA, not available, which could not be measured; NTC, no template control, blank control; TA, total amount of DNA in the sample.
NanoDrop UV spectrophotometer
Concentration of ancient samples measured by the NanoDrop UV spectrophotometer ranged from 0.7 ng/μL (492A) to 33.3 ng/μL (618S). Plexor HY male genomic DNA concentration was 49.2 ng/μL. The NanoDrop UV spectrophotometer also provided information about the purity of isolated DNA using a ratio of A260/280. Plexor HY male genomic DNA purity was normal—1.8 and average of aDNA was lower—1.45.
Qubit fluorometer
The Qubit fluorometer detected the highest concentration in sample 488B (21.9 ng/μL) and the lowest concentration was detected in sample 655A (0.76 ng/μL).
Real-time PCR quantification
SYBR green detection
The initial quantity of aDNA in samples was determined by comparison to a standard curve of fivefold dilution series with a known amount of modern standardized DNA. All samples and standards were run in triplicate in two separate reactions. Modern samples kept a linear regression relationship between DNA quantity and Ct. The efficiency of reactions was between 97% and 105% and R2 > 0.95. Primer specificity was accessed using post-PCR melt curve analysis to visualize the dissociation curve. A single peak was observed for all samples. The dissociation temperature was 79-80.1°C. The highest amount of aDNA was determined in sample 655B (0.009889 ng/μL) and the lowest concentration of aDNA was measured in 655A (0.000244887 ng/μL).
Plexor HY system
The Plexor HY System allows sex determination and quantification of aDNA in one reaction. Genetic sex determination matches anthropological sex determination. Amplification curves of the internal positive control (IPC) assay, which is coamplified as internal control, did not show any PCR inhibition. The efficiency of real-time qPCR was between 98.18% and 101.2% for autosomal assay and between 101.21% and 102.42% for Y assay. The dissociation temperature was 80.5°C for the autosomal marker and 81.9°C for the Y marker. The highest aDNA concentration was determined in sample 488B (0.00919 ng/μL) and the lowest one was measured in 471A—below the threshold of detectability (0.00003106 ng/μL).
Fragment Analyzer
The Fragment Analyzer showed two peaks of various lengths of DNA molecules. The first peak belonged to molecules with a length from 55 bp to ∼200 bp and the second peak rose at fragment length of 800 bp and decreased beyond the limit of detection of this method. The amount of DNA was determined for all samples. The highest total amount of DNA (both peaks) was detected in sample 488A (6.413 ng/μL) and the lowest concentration was detected in sample 499A (0.16 ng/μL). Figure 1 shows typical fragment length distribution of the samples analyzed. DNA fragments are divided into two clearly visible peaks. The first peak includes oligonucleotides from 55 bp to ∼200 bp and the second one includes fragments longer than 800 bp. DNA fragments around 80 bp are the most frequent.
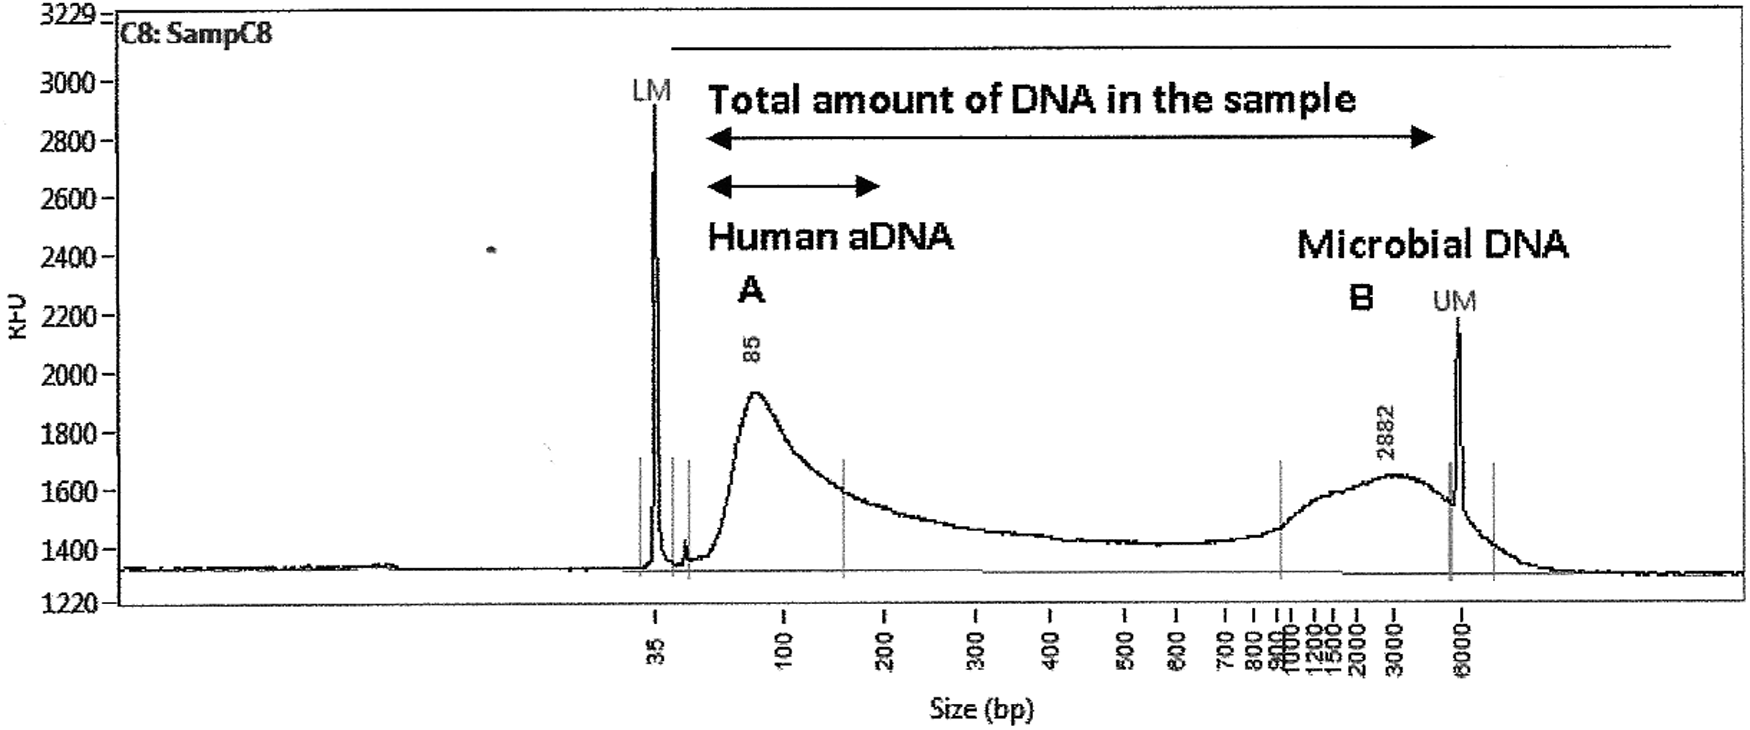
Ancient DNA fragment length distribution measured by Fragment Analyzer™. The figure represents results of fragmentation analysis of sample 488B. Electrophoretogram displays the distribution of DNA fragment length of samples originated from Znojmo-Hradiště. Axis X shows the length of fragments, on the Y axis is quantity of DNA (RFU). The length of fragments is divided into two visually clear definable peaks. The first peak, marked as A, includes fragments from 55 bp to about 200 bp. The most frequent fragments are about 80 bp in length. The second peak, marked as B, includes DNA fragments longer than 800 bp. According to knowledge about ancient DNA, B peak could be assigned to microbial DNA, which was coextracted from skeletal material together with ancient human DNA. aDNA, ancient DNA; RFU, reference fluorescent unit.
This method allows quantification of DNA fragments of specific length. Total DNA (human aDNA and microbial DNA) in a sample (both peaks) was quantified and compared with other methods of quantification. Subsequently, fragments up to 200 bp (human aDNA) were quantified and compared with other methods too.
Statistically significant differences were found between different methods (Table 2). The highest values of aDNA concentrations were measured with the NanoDrop UV spectrophotometer. The value of aDNA concentration was 0.70-33 ng/μL (
Statistically significant difference (p < 0.05 based on the paired t-test).
Highly statistical significant difference (p < 0.01 based on the paired t-test).
aDNA, ancient DNA; FA, fragmentation analysis by Fragment Analyzer; SG, SYBR green detection; TA, total amount of DNA in the sample;
Authenticity of results
Analyses of blank samples were performed during all steps and procedures of the experiment. No DNA was detected in any blank sample.
Discussion
The results of different methods vary widely in some cases, but closer methods analysis can explain this. Differences are based on the principle of methods and on characteristics of aDNA. The NanoDrop UV spectrophotometer and Qubit fluorometer measure total DNA in the eluate, so this includes even the microbial DNA. aDNA is purified from the historical tissue along with microbial DNA (Hagelberg and Clegg, 1991; Tuross, 1994). Exogenous microbial DNA may represent up to 94% of total DNA in a sample (Millar et al., 2008). In addition to human DNA of ancient origin, microbial DNA is measured in the eluate too. The most widely used method for quantification of aDNA is real-time qPCR. This method allows also to monitor the sensitivity and efficiency of the PCR (Pruvost et al., 2004). The most commonly used are forensic quantification kits. They are applicable for samples containing inhibitors and low DNA concentration. When these kits are applied to aDNA, it should be understood that forensic DNA samples and samples of aDNA differ (Capelli et al., 2003). The Plexor HY kit was used in the experiment. Autosomal locus length (99 bp) and the locus on the Y chromosome length (133 bp) are amplified specifically during one reaction, so human DNA is quantified and sex is determined (Krenke et al., 2008). Another method based on the principle of real-time qPCR uses intercalating dye SYBR green at target sequence of length 62 bp in the TH gene 01. The lowest values of DNA quantity, often under the limit of detection, were obtained by using real-time qPCR methods (Bulander and Rolf, 2009). Using these methods on aDNA is associated with problems. Polymerase is significantly inhibited by humic acids, which bind to it (Sutlović et al., 2005). Furthermore, allele dropouts may occur in the case of aDNA PCR (Alonso et al., 2004), and fragmentation of aDNA molecule causes underestimation of its real concentration in general (Sedlackova et al., 2013). The last method tested using the Fragment Analyzer device probably best reflects real concentration of aDNA. Intercalation dye is bound to double-stranded DNA during this method. DNA fragments of different length are then separated by gel electrophoresis, and the fluorescence intensity of the individual fragments is sensed. There were two peaks on electrophoretogram of aDNA from Znojmo-Hradiště. The first has an average range of 50-200 bp with a peak around 80 bp and the second rises at 800 bp and has at maximum length, DNA fragments over the limit of detection of the DNF 474 High Sensitivity NGS fragment Analysis kit. The characteristics of aDNA imply that the first peak is human DNA that is being preserved up to a length of about 200 bp (Hummel, 2010); the second peak could be exogenous microbial DNA, which is characterized by longer chain length (Malmström et al., 2005, 2007). When data obtained were analyzed first, the total amount of DNA was evaluated and then just the DNA in the range up to 200 bp. Boundary of 200 bp base was set as the maximum length of aDNA, DNA longer than the 200 bp was taken as exogenous.
The results of fragmentary analysis show that the most common aDNA fragment is shorter than the target sequences in the Plexor HY forensic kit. Therefore, if this method is used to quantify, most of the fragments are not amplified by real-time qPCR. While quantification of the target sequence using sequences 62 bp long, many more fragments of aDNA undergo reaction.
Experiment using TaqMan® probe was designed for validation of obtained results. TaqMan Copy Number Reference Assay, human, RNase P (Thermo fisher, Carlsbad, CA) was used as a target sequence. This assay detects the ribonuclease P RNA component H1 (H1RNA) gene (RPPH1) on chromosome 14q11.2. It has an 87 bp amplicon. Sample 655B was selected for this purpose because this sample showed the highest concentration of aDNA measured by qPCR-based methods as indicated in Table 1. Based on the concentration of aDNA in sample 655B obtained by different methods, this sample was diluted to get total amount of 50 pg per reaction. The dilution process is summarized in Table 3. Plexor HY Male Genomic DNA Standard (50 ng/μL, Promega) was used as a standard, and dilution factor was 5. The master mix contained 10 μL TaqMan Universal PCR Master Mix (Applied Biosystems™; Thermo fisher), 2 μL TaqMan Copy Number Reference Assay, amount of aDNA as listed in the Table 3, and Water, Amplification Grade (Promega), and so, resulting volume was 20 μL. Cycling conditions were as follows: initial denaturation: 95°C/10 min, two-step cycling: denaturation step 95°C/15 s, annealing and elongation step: 60°C/60 s, 45 cycles. Results of these reactions are summarized in Table 4. Efficiency of real-time qPCR was 105, 87%. DNA standards were successfully amplified, and there was no fluorescent increase detected within any template controls. Real-time qPCR was successful in two cases in the undiluted aDNA samples (Dilution 5-6). During reaction, no inhibition was visible. aDNA was not detected in the diluted samples (Dilution 1-4). Initial sample concentrations of 655B in these cases were measured by methods that detect the total amount of DNA in a sample irrespective of their origin, not only human DNA but also the exogenous DNA. The concentration values obtained by validation reactions using TaqMan Copy Number Reference Assay are similar to those that have been obtained by real-time qPCR using SYBR green. These approaches measure the concentration of DNA regardless of origin, not only human DNA but also the exogenous DNA. The validation method based on real-time qPCR using TaqMan probe is not able to detect DNA fragments shorter than target sequence 87 bp.
For dilution of purified DNA from the skeleton, 655 B was used. Water, Amplification Grade (Promega, Madison, WI).
ct, threshold counter.
Only fragments of aDNA, which are at least as long as or longer than the target sequence and are not cleaved in the place of the target sequence, undergo real-time qPCR. Another advantage of fragmentary analysis is that there is no enzymatic reaction that could be negatively affected by any inhibitors. Fragmentation analysis is thus suitable not only for quantification of aDNA but also for evaluation of the degree of aDNA degradation. This kind of information can then have a major impact on the design of subsequent reactions.
Conclusion
The experiment compared five methods of DNA quantification applied on aDNA samples from the Znojmo-Hradiště burial ground. Methods based on quantification of the total amount of DNA (NanoDrop UV spectrophotometer and Qubit fluorometer) in samples are unsuitable on ancient samples. They measure not only human DNA but also microbial DNA and results are overestimated. Real-time qPCR methods (SYBR green methods and Plexor HY) give undervalued results due to the DNA damage and low concentration of template molecules. DNA quantification methods based on fragment analysis show not only the quantity of DNA but also fragment length. The range of measurement allows optimization of the following PCR.
Footnotes
Acknowledgments
The authors thank Dr. Bohuslav Klíma and Lukáš Kratochvíl from the Department of History, Faculty of Education, Masaryk University (Brno, Czech Republic) and Biovendor Company for renting the Fragment Analyzer.
Author Disclosure Statement
No competing financial interests exist.